ICT Killzones and Macros mt4
- Indicadores
- Barend Paul Stander
- Versión: 1.0
- Activaciones: 5
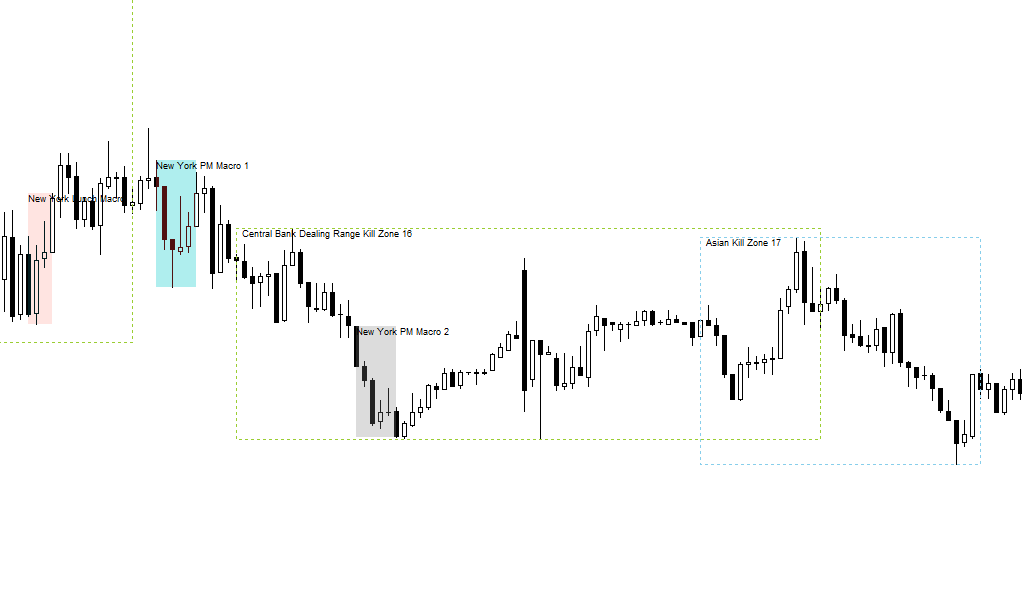
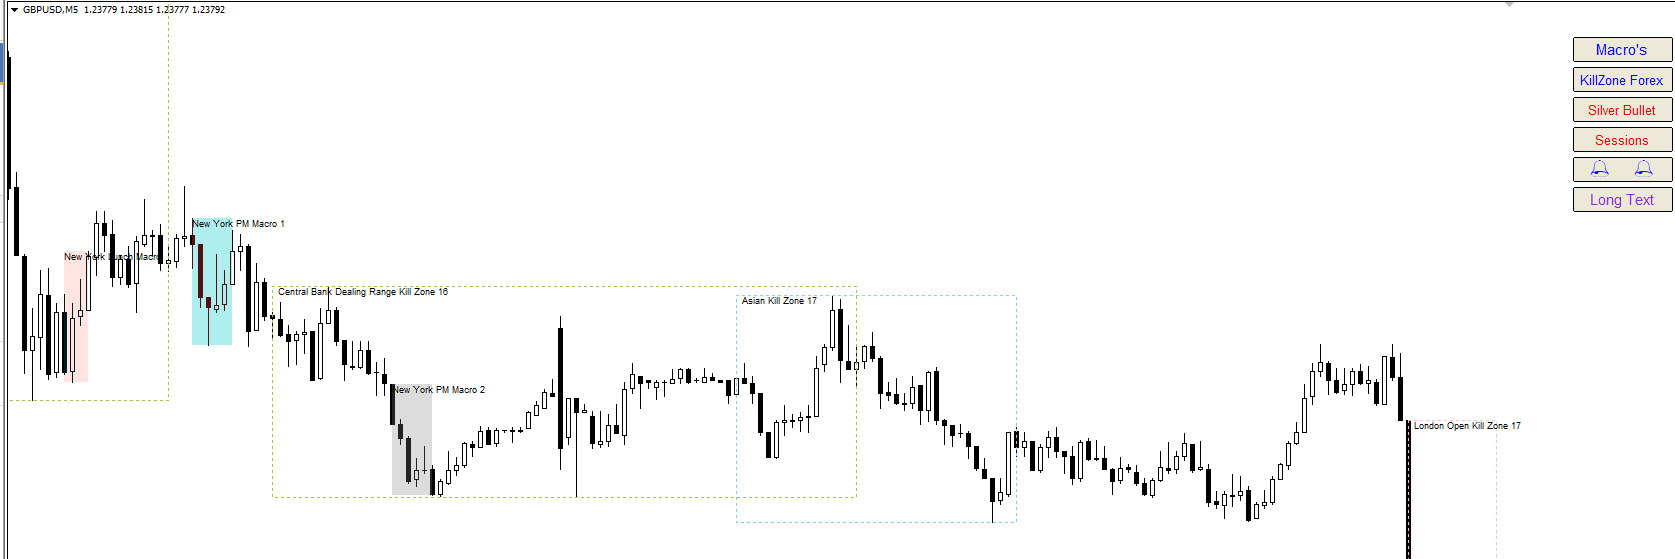
- Kill zones
- Kill zone Forex
- Asian
- London Open
- New York Open
- London Close
- Central Bank Dealing range
- Kill zone Indices
- Asian
- London Open
- New York AM
- New York Lunch
- New York PM
- Power Hour
- Macros
- London 1
- London 2
- New York Am 1
- New York AM 2
- New York Lunch
- New York PM 1
- New York PM 2
- Silver bullet
- London Open
- New York AM
- New York PM
- Sessions
- Asian
- London
- New York
Chart
The display of Kill zone , Macro , Silver bullet or Session can be switch on / off by n button on the chart
Zone color can be Customize as well as outline rectangles or Solid rectangles
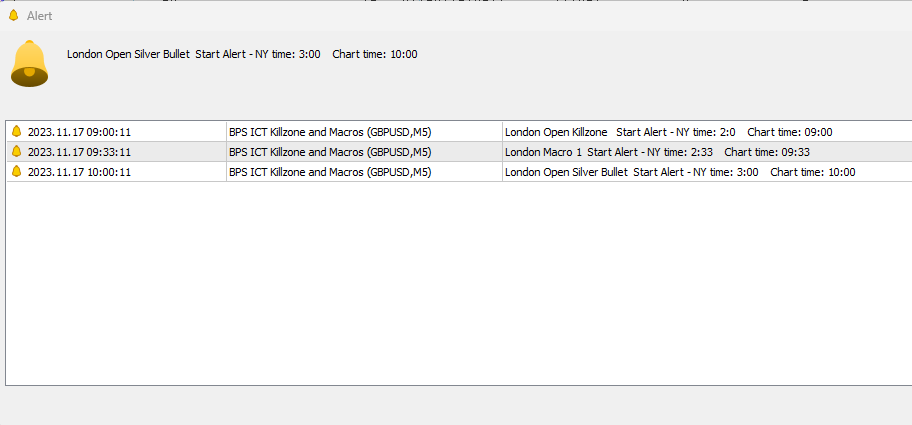
Alerts
Get alerts at Start and/or End of Kill zone , Macro , Silver bullet or Session
Data Window