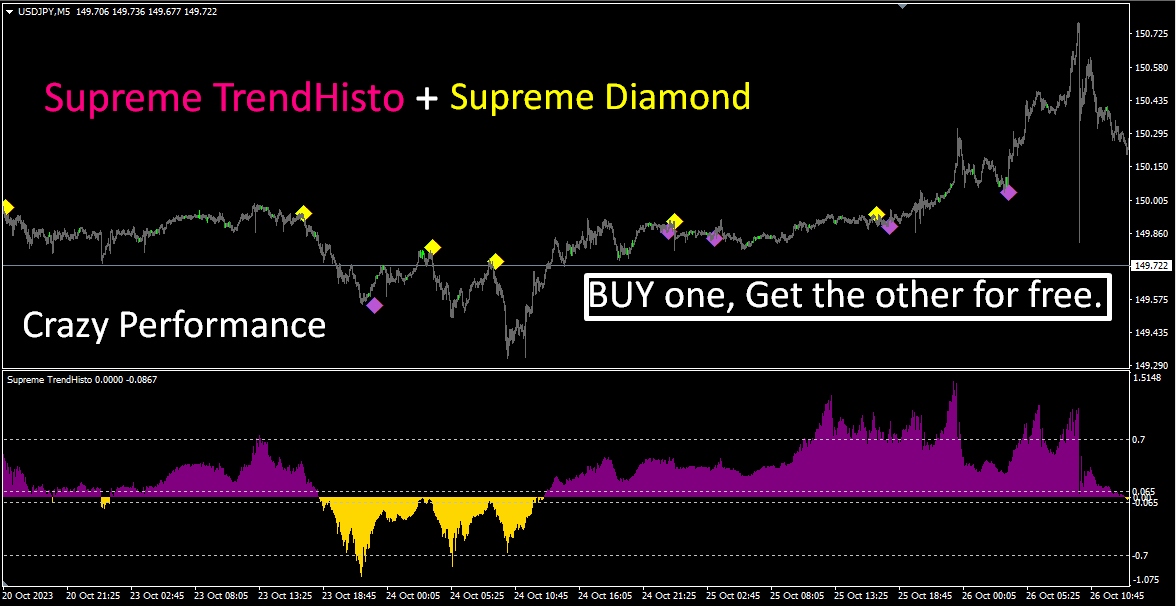
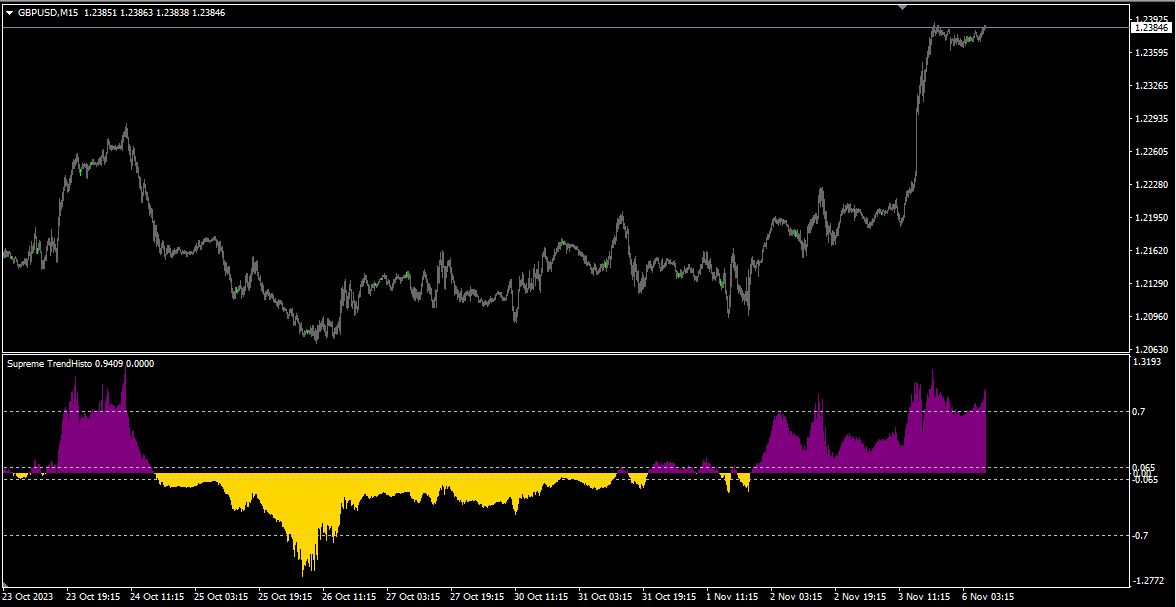
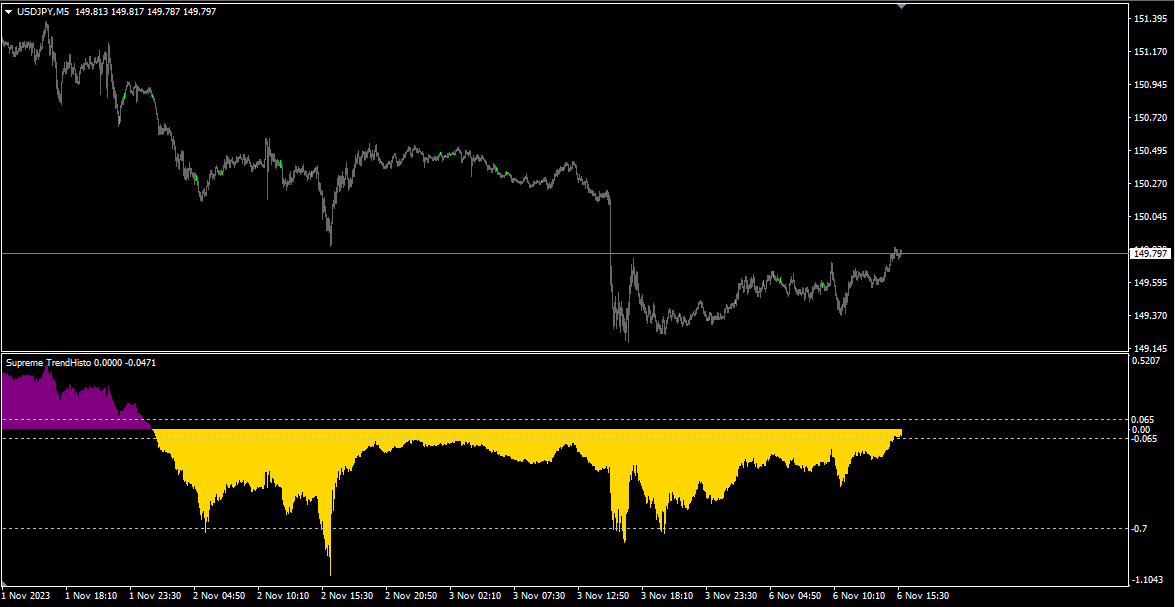
• Información general
  • Comentarios
  • Discusión

Supreme TrendHisto

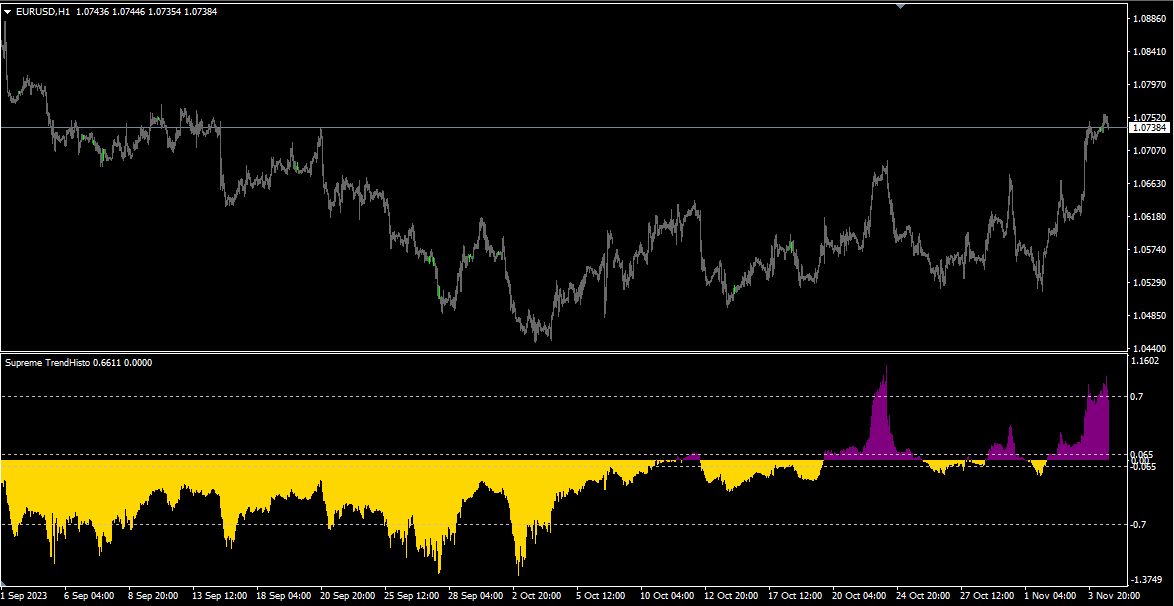
Supreme TrendHisto es un indicador de tendencia que proporciona señales de tendencia hacia arriba y hacia abajo, el indicador actúa como un histograma, el indicador no repinta/pinta de nuevo/retrasa.
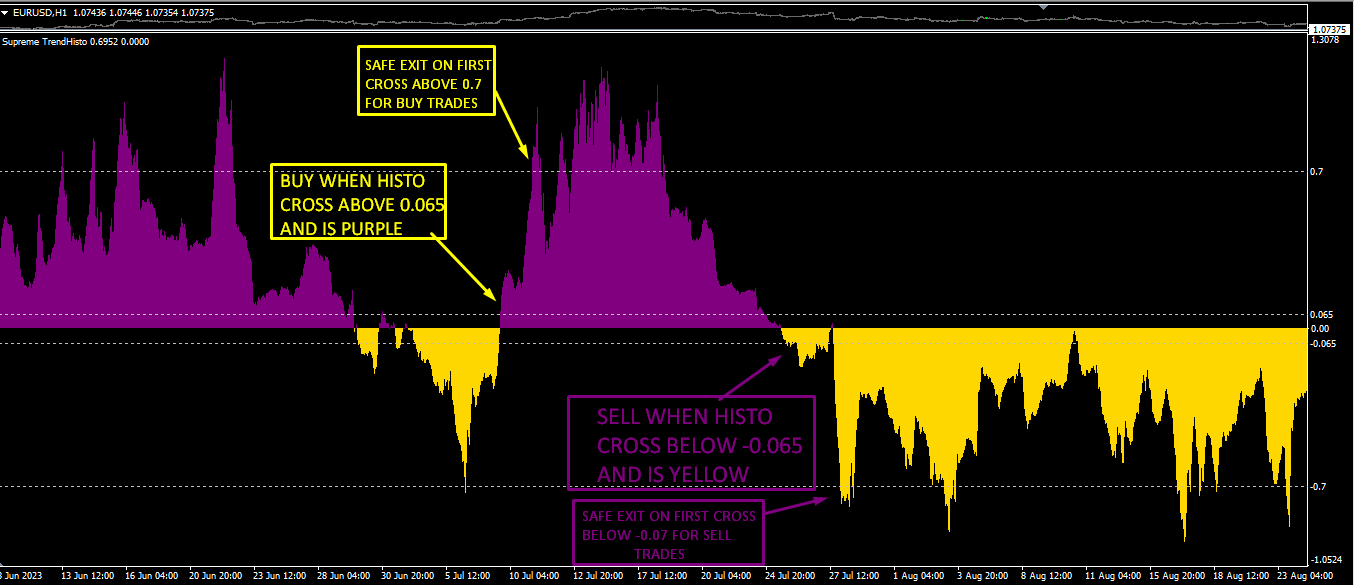
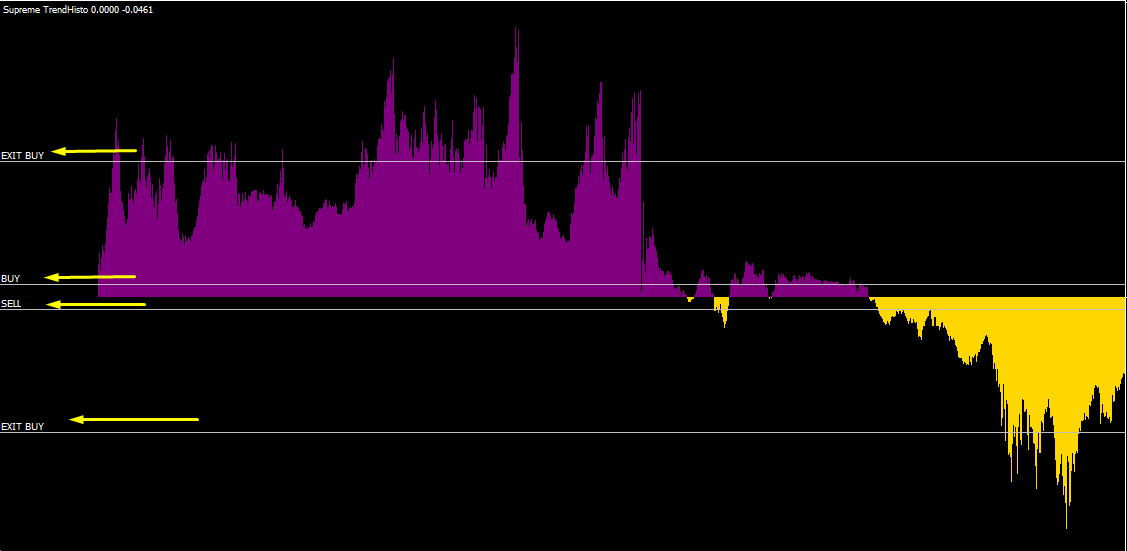
Estrategia

Compra de operación: el histograma cruza por encima de 0,65, abrimos la operación de compra, en cuanto a la salida, puede salir cuando el histograma alcance el nivel 0,70 o salir bien.

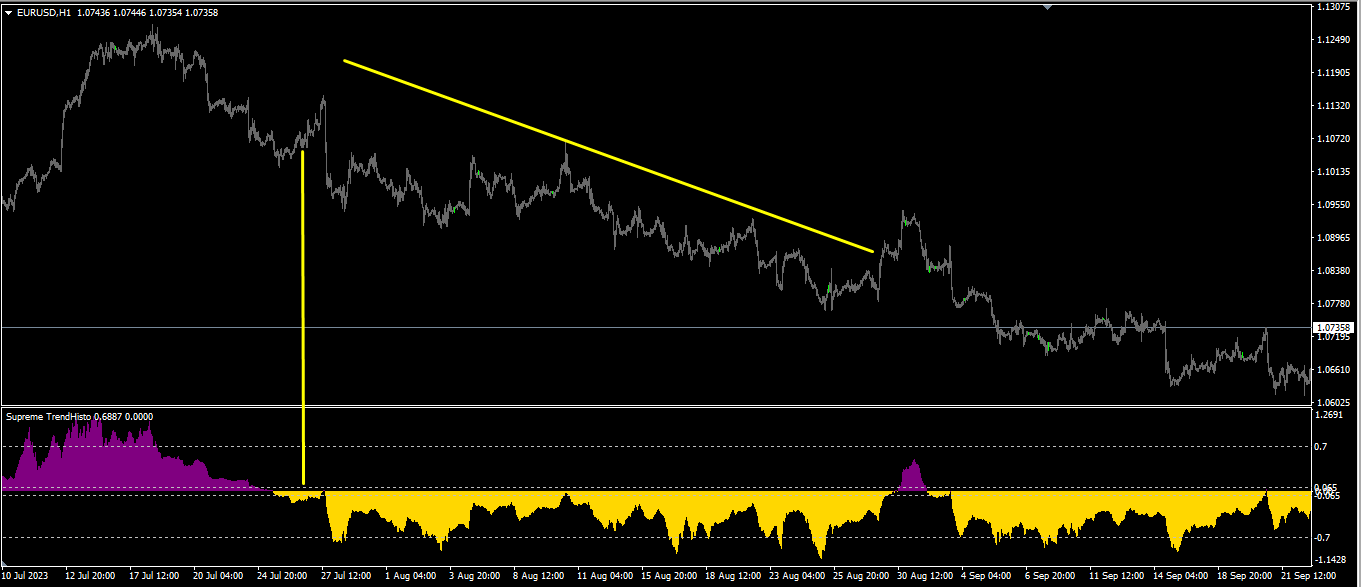
Operación de venta: el histograma cruza por debajo de -0,65, abrimos la operación de compra, en cuanto a la salida, puede salir cuando el histograma alcance el nivel -0,70 o salir bien.
=================================

Plazo recomendado: cualquiera

Periodo recomendado: Predeterminado

=============================================

Parámetros:

1.período del indicador (más bajo para el especulación más alto para el swing trading)

2.tipo de cálculo (cerrar/abrir/resaltar...etc)

3.barra máxima (cuántos historiales mostrar)

4.modo rápido (mantener verdadero)

==================================================== ==================================================== =========================
Productos recomendados
The indicator detects and displays Shark harmonic pattern (see the screenshot). The pattern is plotted by the extreme values of the ZigZag indicator (included in the resources, no need to install). After detecting the pattern, the indicator notifies of that by a pop-up window, a mobile notification and an email. The indicator highlights the process of the pattern formation and not just the complete pattern. In the former case, it is displayed in the contour triangles. After the pattern is comple
Introducing the Consecutive Green/Red Candle Alert Indicator for MT4 - Your Trend Spotting Companion! Are you ready to take your trading to the next level? We present the Consecutive Green/Red Candle Alert Indicator, a powerful tool designed to help you spot trends and potential reversals with ease. Whether you're a new trader looking for clarity in the market or an experienced pro seeking additional confirmation, this indicator is your trusted companion. Key Features of the Consecutive Green/Re
FREE
Trend PA
Mikhail Nazarenko
5 (3)
The Trend PA indicator uses   Price Action   and its own filtering algorithm to determine the trend. This approach helps to accurately determine entry points and the current trend on any timeframe. The indicator uses its own algorithm for analyzing price changes and Price Action. Which gives you the advantage of recognizing, without delay, a new nascent trend with fewer false positives. Trend filtering conditions can be selected in the settings individually for your trading style. The indicator
Basado en ondas indicadoras MACD con parámetros estándar Aplica los niveles de Fibonacci a las dos últimas ondas MACD, positivas y negativas respectivamente, si en el momento en que el indicador MACD se queda sin Onda negativa - el color es verde, si en el momento en que el indicador MACD se queda sin Onda positiva - el color es rojo. El criterio de terminación de onda son dos ticks con un signo MACD diferente. Aplica líneas de tendencia en las últimas cuatro ondas MACD. Trabaja bien
El Capturador de Tendencias: La Estrategia del Capturador de Tendencias con Indicador de Alerta es una herramienta versátil de análisis técnico que ayuda a los traders a identificar las tendencias del mercado y los posibles puntos de entrada y salida. Presenta una Estrategia dinámica del Capturador de Tendencias, adaptándose a las condiciones del mercado para una clara representación visual de la dirección de la tendencia. Los traders pueden personalizar los parámetros para que se ajusten a s
FREE
This product is a part of  ON Trade Waves Patterns Harmonic Elliot Wolfe you can test free version on EURJPY from this link  Wolf Waves Indicator Descubre Wolf Waves - Tu Herramienta Definitiva de Trading ¿Estás en busca de una herramienta poderosa para identificar fácilmente Wolf Waves en cualquier marco de tiempo? ¡No busques más! Nuestro indicador de Wolf Waves hace este trabajo sin esfuerzo. Aquí te explicamos por qué es perfecto para ti: Características Clave: Detección Automática: Nues
Day Pattern
Oleksandr Martsynyshen
Description: - D ay Pattern - an indicator that helps to identify patterns of price changes for the development of trading algorithms and strategies. For whom this tool? - For developers of trading strategies and algorithms. - Medium- and long-term traders. Time frames H1-W1. Features of the indicator: - There is a function of exporting indicator values to a file of the csv format. - Using the information panel, you can conduct an express analysis of trading tool. - The indicat
Wise Men Indicator demo
Bohdan Kasyanenko
3 (2)
The indicator displays signals according to the strategy of Bill Williams on the chart. Demo version of the indicator has the same features as the paid, except that it can work only on a demo account . Signal "First Wise Man" is formed when there is a divergent bar with angulation.  Bullish divergent bar - with lower minimum and closing price in the upper half. Bearish divergent bar - higher maximum and the closing price at the bottom half. Angulation is formed when all three lines of Alligat
FREE
Owl smart levels
Sergey Ermolov
4.34 (35)
Versión MT5  |   FAQ El   Indicador Owl Smart Levels   es un sistema comercial completo dentro de un indicador que incluye herramientas de análisis de mercado tan populares como   los fractales avanzados de Bill Williams , Valable ZigZag que construye   la estructura de onda correcta   del mercado y   los niveles de Fibonacci   que marcan los niveles exactos de entrada. en el mercado y lugares para tomar ganancias. Descripción detallada de la estrategia Instrucciones para trabajar con el indi
VR Cub
Vladimir Pastushak
VR Cub es un indicador para obtener puntos de entrada de alta calidad. El indicador fue desarrollado para facilitar los cálculos matemáticos y simplificar la búsqueda de puntos de entrada a una posición. La estrategia comercial para la cual se diseñó el indicador ha demostrado su eficacia durante muchos años. La simplicidad de la estrategia comercial es su gran ventaja, que permite que incluso los operadores novatos negocien con éxito con ella. VR Cub calcula los puntos de apertura de posiciones
Chart Patterns Detect 15 patterns (Ascending Triangle, Descending Triangle, Rising Wedge, Falling Wedge, Bullish Flag, Bearish Flag, Bullish Rectangle, Bearish Rectangle Symmetrical triangle, Head and Shoulders, Inverted Head and Shoulders, Triple top, Triple Bottom, Double Top, Double Bottom) Use historical data to calculate the probability of each pattern to succeed (possibility to filter notification according to the chance of success) gives graphic indication about the invalidation level and
Introduction to X3 Chart Pattern Scanner X3 Cherart Pattern Scanner is the non-repainting and non-lagging indicator detecting X3 chart patterns including Harmonic pattern, Elliott Wave pattern, X3 patterns, and Japanese Candlestick patterns. Historical patterns match with signal patterns. Hence, you can readily develop the solid trading strategy in your chart. More importantly, this superb pattern scanner can detect the optimal pattern of its kind. In addition, you can switch on and off individu
Trendiness Index
Libertas LLC
5 (3)
"The trend is your friend" is one of the best known sayings in investing, because capturing large trendy price movements can be extremely profitable. However, trading with the trend is often easier said than done, because many indicators are based on price reversals not trends. These aren't very effective at identifying trendy periods, or predicting whether trends will continue. We developed the Trendiness Index to help address this problem by indicating the strength and direction of price trend
UPD1 Rsi Dots Dashboard
Vitaliy Kuznetsov
5 (1)
El indicador muestra señales basadas en el oscilador RSI del terminal en el gráfico. Es posible filtrar señales repetidas. En este caso, el oscilador se utiliza para buscar una señal inversa. Se recomienda como punto de entrada en estrategias de swing y trading desde niveles. Está disponible un panel de control multidivisa. Con él, puede cambiar fácilmente entre gráficos. En las discusiones de productos, puede sugerir un algoritmo en el que puede incrustar un panel de control. Parámetros
FREE
Los indicadores [ZhiBiCCI] son ​​adecuados para todos los ciclos de uso y también son adecuados para todas las variedades de mercado. [ZhiBiCCI] La línea verde sólida es una reversión de la divergencia alcista. La línea de puntos verde es una divergencia alcista clásica. [ZhiBiCCI] La línea continua hacia el rojo es una divergencia bajista inversa. La línea roja punteada es una divergencia bajista clásica. [ZhiBiCCI] puede configurarse en los parámetros (Alerta, Enviar correo, Enviar notif
The indicator displays the data of the Stochastic oscillator from a higher timeframe on the chart. The main and signal lines are displayed in a separate window. The stepped response is not smoothed. The indicator is useful for practicing "manual" forex trading strategies, which use the data from several screens with different timeframes of a single symbol. The indicator uses the settings that are identical to the standard ones, and a drop-down list for selecting the timeframe. Indicator Parame
Indicador Forex "MACD con tendencia ZigZag" para MT4 El indicador MACD en sí es una de las herramientas más populares para el comercio de tendencias. "MACD con Trend ZigZag" es excelente para usar con entradas de Price Action o en combinación con otros indicadores Utilice este indicador para seleccionar las señales de entrada más precisas: - Si MACD está por encima de 0 (color verde) y la línea ZigZag está hacia arriba - busque solo patrones de acción del precio de compra - Si MACD está por d
The main idea of this indicator is rates analysis and prediction by Fourier transform. Indicator decomposes exchange rates into main harmonics and calculates their product in future. You may use the indicator as a standalone product, but for better prediction accuracy there is another related indicator - FreqoMaster - which uses FreqoMeterForecast as a backend engine and combines several instances of FreqoMeterForecast for different frequency bands. Parameters: iPeriod - number of bars in the ma
El indicador construye cotizaciones actuales, que se pueden comparar con las históricas y, sobre esta base, hacer un pronóstico de movimiento de precios. El indicador tiene un campo de texto para una navegación rápida a la fecha deseada. Opciones: Símbolo - selección del símbolo que mostrará el indicador; SymbolPeriod - selección del período del cual el indicador tomará datos; IndicatorColor - color del indicador; HorisontalShift: cambio de cotizaciones dibujadas por el indicador
Gold Phoenix
Yaroslav Varankin
The perfect tool for Scalng in the Forex markets You can trade both from signal to signal and using take profit  The algorithm does not use Zigzag!  No redrawing!  This is a channel instrument that uses a moving average as a filter. Moving Average  There are 2 parameters for the settings Ma Period = 5 period Moving Average  Channel 1.0 distance of channel lines from the chart Price Signal Filter - calculation of signal opening and filter There is a complete set of Alert There is a multi-timefram
Magic Balance
Daniil Evstratenko
The indicator shows which trading pairs, strategies, robots and signals that you use are profitable and which are not. The statistic of trades and balance graph are displayed in the account currency and pips - to switch simply click on the graph. button "$"(top left) - minimize/expand and move the indicator panel button ">"(bottom right) - stretching and resetting to the original size Statistic of trades 1 line - account balance, current profit and lot of open trades; 2 line - the number of al
Trend Scanner
Vladimir Kalendzhyan
4.33 (6)
By purchasing this indicator, you have the right to receive a free copy of one of   my other indicator's or advisor’s!  (All future updates are included. No limits) . To get it , please contact me by  mql5 message ! The Trend Scanner trend line indicator displays the trend direction and its changes. The indicator works on all currency pairs and  timeframes. The indicator simultaneously displays multiple readings on the price chart: the support and resistance lines of the currency pair, the exist
Trend Ray
Andriy Sydoruk
The indicator shows the potential trend direction by cyclical-wave dependence. Thus, all the rays of the intersection will be optimal rays, in the direction of which the price is expected to move, taking into account the indicator period. Rays can be used as a direction for potential market movement. But we must not forget that the approach must be comprehensive, the indicator signals require additional information to enter the market.
Atomic Analyst
Issam Kassas
5 (2)
En primer lugar, vale la pena enfatizar que este Indicador de Trading no repinta, no redibuja y no se retrasa, lo que lo hace ideal tanto para el trading manual como para el automatizado. Manual del usuario: configuraciones, entradas y estrategia. El Analista Atómico es un Indicador de Acción del Precio PA que utiliza la fuerza y el impulso del precio para encontrar una mejor ventaja en el mercado. Equipado con filtros avanzados que ayudan a eliminar ruidos y señales falsas, y aumentan el poten
Reversal Pattern Pro
Boonyapagorn Rodvattanajinda
Reversal Patterns Pro Reversal Patterns Pro is a Price Action (PA) analytical tool that scans the reversal patterns.  - Finds and marks the most dependable Japanese candlestick patterns in real-time. - Supports all time frames (Best for Scalping) - Doesn't repaint making it an exceptional indicator for Expert Advisors. Input parameters : - Support & Resistance Mode ( true or false ) for enabling advanced filtering - Donchian Period - RSI Period - RSI Oversold Level - RSI Overbought Level - 
MACD Intraday Trend PRO es un indicador desarrollado a través de una adaptación del MACD original creado por Gerald Appel en la década de 1960. A lo largo de años de negociación, se observó que al cambiar los parámetros del MACD con proporciones de Fibonacci logramos una mejor presentación de la continuidad de los movimientos de la tendencia, haciendo que sea posible detectar de manera más eficiente el inicio y el final de una tendencia de precios. Debido a su eficiencia en la detección de
Super Reversal Pattern
Parfait Mujinga Ndalika
Super Reversal Pattern Indicator Unlock the power of advanced pattern recognition with our Super Reversal Pattern Indicator. Designed for traders seeking precision and reliability, this indicator identifies one of the most effective reversal patterns in technical analysis, offering a significant edge in your trading strategy. Key Features: Non-Repainting Accuracy: Enjoy the confidence of non-repainting technology. Once a Super Reversal Pattern is detected, it remains static, providing consis
The indicator detects and displays М. Gartley's Butterfly pattern. The pattern is plotted by the extreme values of the ZigZag indicator (included in the resources, no need to install). After detecting the pattern, the indicator notifies of that by the pop-up window, a mobile notification and an email. The pattern and wave parameters are displayed on the screenshots. The default parameters are used for demonstration purposes only in order to increase the amount of detected patterns. Parameters
This indicator monitors the market for a flat state and possible breakout. The flat state is detected as a predefined number of consecutive bars during which price fluctuates inside a small range. If one of the next bars closes outside the range, breakout is signaled. The indicator shows 3 lines: blue - upper bound of flat ranges AND consecutive breakout areas; red - lower bound of flat ranges AND consecutive breakout areas; yellow - center of flat ranges (NOT including breakout areas). When a b
Retroceso de Fibonacci & Herramientas de Dibujo de Líneas Extendidas Retroceso de Fibonacci & Herramientas de Dibujo de Líneas Extendidas son aptos para la plataforma MT4 y para operadores que emplean el método de negociación de puntos y la negociación de sección áurea. Ventajas: Sin líneas excusadas ni las excesivamente largas, y es fácil de observar y descubrir oportunidades de negociación. Versión de prueba: https://www.mql5.com/zh/market/product/35884 Funciones principales: 1.
Los compradores de este producto también adquieren
Enigmera
Ivan Stefanov
5 (3)
ENIGMERA: El núcleo del mercado https://www.enigmera.com Introducción Este indicador y sistema de negociación es un enfoque extraordinario de los mercados financieros. ENIGMERA utiliza los ciclos fractales para calcular con precisión los niveles de soporte y resistencia. Muestra la auténtica fase de acumulación y proporciona dirección y objetivos.  Un sistema que funciona tanto si estamos en una tendencia como en una corrección.  ¿Cómo funciona? ENIGMERA consta de tres líneas: la línea de s
Gold Channel is a volatility-based indicator, developed with a specific timing algorithm for the XAUUSD pair, which consists of finding possible corrections in the market. This indicator shows two outer lines, an inner line (retracement line) and an arrow sign, where the theory of the channel is to help identify overbought and oversold conditions in the market. The market price will generally fall between the boundaries of the channel. If prices touch or move outside the channel it is a tra
TrendMaestro
Stefano Frisetti
5 (3)
note: this indicator is for METATRADER4, if you want the version for METATRADER5 this is the link:  https://www.mql5.com/it/market/product/108106 TRENDMAESTRO ver 2.4 TRENDMAESTRO recognizes a new TREND in the bud, he never makes mistakes. The certainty of identifying a new TREND is priceless. DESCRIPTION TRENDMAESTRO identifies a new TREND in the bud, this indicator examines the volatility, volumes and momentum to identify the moment in which there is an explosion of one or more of these data a
This indicator is based on the Gann Signal indicator and acts as a market scanner. All you need to do is fill in the selected currency pairs in the settings and that’s it. Next, the indicator itself will view all these currency pairs and time frames from M5 to D1 simultaneously. When a new signal appears, the indicator will give you an Alert and also draw the letter N where this new signal will be.
PTS Precision Index Oscillator V2
PrecisionTradingSystems
5 (1)
El Oscilador de Índice de Precisión (Pi-Osc) de Roger Medcalf de Precision Trading Systems La versión 2 ha sido cuidadosamente recodificada para cargar rápidamente en su gráfico y se han incorporado algunas otras mejoras técnicas para mejorar la experiencia. El Pi-Osc fue creado para proporcionar señales precisas de temporización de operaciones diseñadas para encontrar puntos de agotamiento extremos, los puntos a los que los mercados se ven obligados a llegar solo para eliminar las órdenes
Bomb Bank Signal
Igor Pereira Calil
5 (1)
Señal de Bomb Bank: su indicador de confianza en MetaTrader 4 Bomb Bank Signal es un poderoso indicador para MetaTrader 4, diseñado para identificar las tendencias más relevantes en el mercado financiero. Si buscas una herramienta que anticipe los movimientos con precisión, el Bomb Bank es el aliado que necesitas. Cómo funciona: Este indicador combina tres métodos distintos (análisis de volumen, cierre de velas y tendencia simétrica) para detectar y señalar oportunidades de compra y venta
¡LEA LA INFORMACIÓN A CONTINUACIÓN ANTES DE COMPRAR EL PRODUCTO! ¡Apollo Pips PLUS SP es un producto único! ¡ES PARA AQUELLOS QUE QUIEREN OBTENER MI NUEVO INDICADOR "APOLLO PIPS" MÁS BONO "SUPER PACK" CON ACCESO A TODOS MIS INDICADORES COMERCIALES! Al comprar el producto Apollo Pips PLUS SP, en realidad está comprando una versión absolutamente nueva de mi indicador Apollo Pips. Esta versión del indicador tiene un algoritmo mejorado y un parámetro fácil de usar que le brinda la oportunidad de uti
RelicusRoad Pro
Relicus LLC
4.64 (103)
Manual de usuario de RelicusRoad + Videos de capacitación + Acceso al grupo privado de Discord + Estado VIP UNA NUEVA MANERA DE VER EL MERCADO RelicusRoad es el indicador comercial más poderoso del mundo para divisas, futuros, criptomonedas, acciones e índices, y brinda a los comerciantes toda la información y las herramientas que necesitan para mantenerse rentables. Brindamos análisis técnicos y planes comerciales para ayudar a todos los operadores a tener éxito, desde principiantes hasta
Indicator : RealValueIndicator Description : RealValueIndicator is a powerful tool designed specifically for trading on the EURUSD pair. This indicator analyzes all EUR and USD pairs, calculates their real currency strength values, and displays them as a single realistic value to give you a head start on price. This indicator will tell you moves before they happen if you use it right. RealValueIndicator allows you to get a quick and accurate overview of the EURUSD currency pair tops and bottoms,
Precautions for subscribing to indicator This indicator only supports the computer version of MT4 Does not support MT5, mobile phones, tablets The indicator only shows the day's entry arrow The previous history arrow will not be displayed (Live broadcast is for demonstration) The indicator is a trading aid Is not a EA automatic trading No copy trading function The indicator only indicates the entry position No exit (target profit)  The entry stop loss point is set at 30-50 PIPS Or the front
This indicator ( dashboard) provides trend for multi currency on multi timeframe Charts. It gives entries and Stoploss on the chart itself  if the currency pair is uptrend then the cell color is displayed as Green and if its downtrend the cell displays the color as Red Alerts are generated whenever the trend changes on that particular timeframe. can customize the time frames as desired
Por supuesto, aquí tienes la traducción al español: Presentamos el Indicador de Astronomía para MT4: Tu Compañero Celestial Definitivo en el Trading ¿Estás listo para elevar tu experiencia de trading a alturas celestiales? No busques más allá de nuestro revolucionario Indicador de Astronomía para MT4. Esta innovadora herramienta trasciende los indicadores de trading tradicionales, aprovechando el poder de algoritmos complejos para proporcionarte una visión astronómica sin igual y cálculos de pre
How to use Pair Trading Station Pair Trading Station is recommended for H1 time frame and you can use it for any currency pairs. To generate buy and sell signal, follow few steps below to apply Pair Trading Station to your MetaTrader terminal. When you load Pair Trading Station on your chart, Pair Trading station will assess available historical data in your MetaTrader platforms for each currency pair. On your chart, the amount of historical data available will be displayed for each currency pai
El indicador " ZigZag on Trend " es un asistente para determinar la dirección del movimiento del precio, así como una calculadora de barras y pips. Consiste en un indicador de tendencia que monitorea la dirección del precio con una línea de tendencia presentada en forma de zigzag y un contador que calcula el número de barras pasadas en la dirección de la tendencia y el número de puntos en una escala vertical. (Los cálculos se realizan mediante la apertura de la barra) El indicador no se vuelve a
Septermber OFFER 85% OFF next price for unlimited version will be 2500$. This is the only time you can get this institutional and professional indicator at this price for unlimited version. Don't dare to miss this. The tool I am about to introduce to you you can't compare it with other tools due to its strategy and accuracy level in predicting the next price directional movement. This tool is designed for serious traders who have decided to make a difference through trading. Be the next person t
Dear Traders this is my another tool called " Swing Master Indicator ". As the name above the indicator is designed to help you in swing trading by capturing the low and highs of the price. You may us this tool with any trading strategy and style from scalping to position trading. It is made for level of traders including newbies and advanced traders even prop-firms, hedge funds and banks to help them make sold market analysis. I create tools for serious traders who want to make a difference in
Moving pivot Average Fibonacci The  indicator compares the selected period with its counterpart from the previous period. The indicator determines the moving Fibonacci levels for the day or any time interval to assess the price movement range from the time average. The indicator helps predict the expected high or low for the day based on historical time data. The pivot line can be considered an average trend line and use it in a variety of trading strategies. If you have any question about t
Max Paynex
Abdulkarim Karazon
Max Payne es un indicador de señal de reversión/tendencia que proporciona señales en forma de flecha, este indicador da su señal al cerrar la misma barra, este indicador puede aparecer varias veces en el gráfico con diferentes períodos para obtener confirmación doble/triple de las señales. El indicador es altamente ajustable para adaptarse a cualquier estilo comercial y nunca se repinta ni se vuelve a pintar. Obtendrá el sistema completo en capturas de pantalla después de la compra junto con la
La VELOCIDAD DE TRANSACCIÓN es el indicador de mayor calidad que muestra dónde y cuándo se acumulan grandes órdenes en el mercado y los beneficios de ello. Detecta los cambios de tendencia en una fase muy temprana. Es a la vez un indicador y un sistema de trading. El concepto es único e increíblemente rentable. En Forex, el volumen de ticks se denomina engañosamente volumen. En realidad, se trata de la variación del precio por unidad de tiempo, que de hecho es la VELOCIDAD DE TRANSACCIÓN. Est
The indicator is designed to work on any trading platform. The program is based on proprietary algorithms and W.D.Ganna's mathematics, allowing you to calculate target levels of price movement based on three points with the highest degree of certainty. It is a great tool for stock trading. The indicator has three buttons: NEW - call up a triangle for calculation. DEL - delete the selected triangle. DELS - completely remove all constructions. The probability of achieving the goals is more than 80
Gann Signal
Kirill Borovskii
Gann Signal is a very simple indicator at first glance, but hidden inside is many years of experience in studying W.D.Ganna methods. The indicator gives accurate BUY/SELL signals, without redrawing. The indicator is very easy to use. All you need to do is attach it to your chart and follow its recommendations. The indicator constantly analyzes the market for entry opportunities. When such an opportunity appears, the indicator gives a signal in the form of an arrow. I repeat, all signals are NOT
Connect Indicator
Sukunthakan Ngernbamrung
Connect Indicator is a tool used for connecting indicators between the MQL market and MT4. The connected indicators are made by our group and can be used for other applications, such as sending messages to the Line application or Telegram application. If you have any questions, please don't hesitate to ask us to receive support. Function and indicator buffer Buffer one is the high price of the previous candle. Buffer two is the high price of the previous candle. Usage To connect indicators to fu
Al in one level
Kundan Kumar Srivastava
5 (1)
This indicator is collection of important dynamic support and resistance giving a trader crystal clear idea , where to sell and where to buy. it completely complements trend lines, support, resistance, and sideways market and allow a trader to make sustainable profits. The thickness of lines suggests its strengths, the thicker the dynamic line, the stronger is rejection or pullback allowing a trader to make multi-fold profit, as they can clearly see them. Introducing Your Ultimate Trading Edge
This product is based on the methodologies of Gann, his follower Don E. Hall. The Indicator builds a working view grid, which is used to analyze graphics. The Pyrapoint tool, developed by Don Hall, is a grid based on the Pythagorean cube. In his calculations he uses the Gann Square 9 methodology and the relationship between Price and Time. This tool is used to predict changes in trend and overall market actions. More information about the method   HERE
A. ¿Qué es A2SR ?   * Es un indicador técnico líder (sin repintado, sin retraso). -- Guía : -- en https://www.mql5.com/en/blogs/post/734748/page4#comment_16532516 -- y https://www.mql5.com/en/users/yohana/blog A2SR tiene una técnica especial para determinar los niveles de Soporte (demanda) y Resistencia (oferta). A diferencia de la forma ordinaria que vimos en la red, A2SR tiene un concepto original para determinar los niveles reales de SR. La técnica original no se tomó de Internet y tampoco
This indicator uses support and resistance, volume and some special formula to calculate the volume to filter the candles. If the volume reaches a specific value, And at the same time, Candle breaks the support/resistance line, There would be a signal and we can enter the market. Signals appear when the current candle closes. then you can enter the trade when a new candle appears. Please don't forget to follow your money management plan. MT5 Version Support/Resistance Breakout MT5 :   https:
Full STO
Roman Smoroda
Indicador STO completo (incluye todas las versiones de tres indicadores STO: Premium, Gold, Silver) - STABLE TRADE OPTION está diseñado para el comercio automático de opciones binarias.  ¡¡¡¡¡LEA CUIDADOSAMENTE!!!!! IMPORTANTE En un terminal cree dos plantillas con diferentes vencimientos, una plantilla para las 18:01, 18:02 con vencimientos de 1 a 15 minutos y una plantilla para las 22:00 con vencimientos de 10 a 20 minutos. Winrate: 71% en los últimos 5 años Gestión del dinero: 0,3% d
FxBears Powers
Rachid Lafhil
3 (2)
️️ Attention:   There is a new update at 22-08-2024. What's new in this update? -* New strategy integration. -* The trade is with the price trend only. -* The success rate of trades has increased by a very large percentage.      No more losses with this indicator, test it for years ago and see if there is losses in one day results. but before testing it please see the explaining video down here.    FxBears Powers is working on all forex pairs, metals, commodities, futures, indices, energies,
Contact us to receive a comprehensive user guide after purchasing. William Delbert Gann, commonly known as W.D. Gann, was an exceptional market analyst renowned for his unique trading style in the early 20th century.  His trading techniques were based on a blend of mathematics, geometry, astrology, and ancient mathematics. Gann believed that stock market movements followed specific patterns and cycles, rather than being random. His methodologies, celebrated for their accuracy and relevance, con
Otros productos de este autor
Touch Spike
Abdulkarim Karazon
Touch Spike es un indicador comercial de índices de auge y caída que proporciona señales de compra y venta en forma de retroceso de barra y toque... La estrategia es realizar operaciones de compra solo en el índice de auge y operaciones de venta solo en el índice de caída, para realizar una operación válida en el índice de auge. Necesita que el indicador esté en un estado de tendencia alcista y sea verde, espere hasta que una vela roja de auge toque la línea verde y luego compre en el mismo
BinarySniperZ
Abdulkarim Karazon
Binary Sniper es un indicador mt4 que proporciona señales de compra y venta para el comercio de opciones binarias. Este indicador tiene un enfoque diferente. Para el comercio de opciones binarias, este indicador no repinta ni retrasa la señal. REGLAS DE ENTRADA: 1. LLAMADA (COMPRAR), cuando una vela roja se cierra con una barra de francotirador binaria de color verde después de que era roja (primer cambio de color). 2. PONER (VENDER), cuando una vela verde se cierra con una barra de francotirad
Supreme HmaSignal
Abdulkarim Karazon
4 (1)
The Supreme HmaSignal indicator is an indicator for trend trading , its main character is the hull moving average colored line , and secondary is buy and sell arrows , arrows are fair but the main focus is on the colored hma , this indicator does not repaint or back paint or delay its signals. if you like this indicator please check my Supreme Trendhisto:   here   , and my Supreme Diamond indicator :   here Parameters:  HMA Period HMA Smoothing HMA Price (close/open) Signal Period (Arrows)
FREE
TMA Stochastic is an indicator based on stochastic oscillator and tma bands indicator , this indicator is based on a reversal strategy . Recommended time frame : 15 and above  Recommended settings : lower values for scalping , higher values for swing trading  WORKS ONLY ON EURUSD , GET THE FULL VERSION :  https://www.mql5.com/en/market/product/108378 ======================================================================= Parameters :  tma history : how many bars back to show tma bands on stochas
FREE
Supreme StochRsi
Abdulkarim Karazon
Rsi indicator and Stochastic Combined into one indicator , the Supreme StochRsi doesnt repaint / Back-paint / delay. can be used as overbought oversold strategy , or trend following on 50 level cross. if you like this indicator please check my Supreme Trendhisto: here , and my Supreme Diamond indicator : here ========================================================================= Parameters : Stochastic K and D value , Stochastic period Rsi Period Rsi price ====================================
FREE
Ambitious Dragon EA
Abdulkarim Karazon
5 (1)
Ambitious Dragon EA es un asesor experto diseñado específicamente para operar en eurusd en un plazo de 1 millón. La lógica detrás de esto se basa en abrir órdenes usando una estrategia mixta, esto significa que el EA usa lógica de cobertura junto con la tasa de ganancias y pérdidas calculada y, por lo tanto, el EA decidirá abrir las operaciones o omitirlas, ya que el EA es una estrategia mixta. EA, puede tener un DD enorme si se usa el archivo de conjunto agresivo y tendrá un DD mejor si se usa
Supreme Direction
Abdulkarim Karazon
4 (1)
Supreme Direction is an indicator based on market volatility , the indicator draws a a two lined channel with 2 colors above and below price , this indicator does not repaint or back-paint and signal is not delayed. how to use : long above purple line , short below golden line. Parameters : channel period ========================================================
FREE
Supreme Stoploss
Abdulkarim Karazon
Supreme Stoploss is an indicator for metatrader 4 that is based on the ATR indicator , it gives stoploss/takeprofit as lines drawn above and below the price , this indicator does not repaint/back paint and is not delayed. can be used to determine the stop loss or take profit of a trade using ATR value multiplied by the number set by user. ====================================================================================================== Parameters : ATR SL period : ATR period identity : leave
FREE
Bands Sniper
Abdulkarim Karazon
5 (1)
Solo 10 copias con el precio actual, después el precio será de 90$. Basado en envolvente y tma con flechas, el indicador Bands Sniper es un indicador multipropósito ya que muestra soporte y resistencia dinámicos y también proporciona señales de entrada como flechas de compra y venta. Las configuraciones predeterminadas se basan en un período de tiempo de 1 hora; comuníquese con nosotros después de la compra para obtener una guía completa. Reglas de entrada: COMPRAR: 1.Vela Cierra d
SuperOsma Arrow
Abdulkarim Karazon
SuperOsma Arrow es un indicador basado en osma de supertendencia que proporciona señales de compra y venta, el indicador no se repinta y viene con un panel que muestra estadísticas de señales. Plazo recomendado: 15 años y más Comprar: la flecha de compra aparece en la barra abierta, configure tp y sl como se muestra en el gráfico Vender: la flecha de venta aparece en la barra abierta, configure tp y sl como se muestra en el gráfico =================================     El panel mu
BinaryMartini
Abdulkarim Karazon
un indicador para el comercio binario basado en 3ma cruzado con macd, proporciona señales de compra y venta en la barra abierta y no se repinta ni retrocede El indicador no se centra en una alta tasa de ganancias, ya que está diseñado para el comercio de martingala, el indicador se centra en el menor número de señales perdedoras consecutivas. Estrategia : El depósito mínimo es de 1000 unidades, comenzamos a operar con 1 unidad (el tamaño de la operación es 1 unidad por cada 1000 de capital)
Statistic Arrow
Abdulkarim Karazon
Basado en una estrategia cruzada de 3 promedios móviles, la flecha estadística brinda señales de compra y venta con tp y sl en puntos dibujados en el gráfico, viene con un panel de prueba posterior que muestra la tasa de ganancias y cuántas operaciones se cerraron, cuántas ganaron, cuántas pérdida, ganancias finales obtenidas, el indicador imprime una flecha junto a tp y sl en BAR OPEN y da una alerta previa. Los parámetros se muestran en la captura de pantalla de configuración y se explican.
Ambitious Donchian EA can be downloaded from comment section but it need the ambitious donchian indicator to work. Ambitious Donchian is a Donchian Channel and XO histogram based indicator that gives buy and sell signals in form of up and down arrows with tp and sl as objects on chart. features : 1. Tp and Sl for each signal , the tp and sl can be selected as based on points or ATR value from indicator settings. 2.backtesting dashboard : the dashboard shows the following according to your i
Supreme Arrow
Abdulkarim Karazon
Supreme Arrow es un indicador de flecha para mt4 que se basa en la estrategia de indicadores rsi y demarker. La estrategia es adecuada para mercados de tendencia, pero también funciona en mercados variados, especialmente si se utiliza para especular. Plazo recomendado: cualquiera Complementos recomendados: 200 SMA El indicador Supreme Arrow no se repinta ni se repinta y la señal no se retrasa
Supreme Channel
Abdulkarim Karazon
Basado en el indicador del canal TV atr, el indicador Supreme Channel es una banda dinámica de soporte y resistencia que le da al operador una pista sobre una posible reversión en la tendencia actual. Plazo recomendado: 15 meses y más Configuración recomendada: Predeterminada, pero el operador puede optar por cambiarla según sea necesario. Parámetros: 1. Longitud del canal 2.Ancho de banda (la distancia entre las dos líneas del canal) 3.Multiplicador (Multiplicador de valor ATR) 4
Supreme Diamond
Abdulkarim Karazon
5 (1)
Supreme Diamond es un indicador de marco de tiempo múltiple basado en una estrategia de negociación de tendencias y reversión, el indicador no se repinta ni se repinta y las señales no se retrasan, el indicador proporciona señales de compra y venta con alerta. El indicador tiene 2 modos de señal que se pueden elegir entre la entrada (use la mejor entrada como diamantes). Si está configurado en verdadero, el indicador filtrará las señales del modo normal y dará la mejor entrada posible como señ
Supreme EmaCross
Abdulkarim Karazon
Supreme EmaCross es un indicador basado en dos promedios móviles exponenciales cruzados, genera flechas de compra y venta basadas en el cruce de ema y alerta sobre la apariencia de la señal, el indicador no repinta ni pinta hacia atrás y las flechas no se retrasan, el indicador tiene un rápido Panel de cambio de período de ema donde el operador puede cambiar los valores de ema sin tener que ir a la configuración del indicador, el panel es móvil. ===============================================
Supreme MaColor
Abdulkarim Karazon
Supreme MaColor is an indicator based on moving average indicator , it gives up and down trend colors and it has different moving averages types and has multi time frame function , this indicator does not repaint/back-paint/delay signal. =================================================================================== Parameters : Timeframe (what time frame to use to draw Supreme Ma) Ma Period  Ma Type Ma Price (close/open...etc) Average Shift (Ma shift) Multi Time frame on/off ===============
Supreme MaChannel
Abdulkarim Karazon
Supreme MaChannel is an indicator based on moving averages , the indicator gives dynamic support and resistance in bands format. Recommended for reversal traders , add it to your reversal strategy. Parameters :  Supreme MA Period : ma periods Supreme MA Price : close/open/high/low..etc Supreme MA Type : Simple/Exponential/Smoothed/Linear Weighted Deviation : bands deviation the distance between the two band lines
Supreme Entry
Abdulkarim Karazon
Supreme Entry is an arrow signal based indicator that give buy and sell signals , the indicator gives buy/sell signals with alert on candle open/close (depends what you set it to be from inputs) . this indicator does not repaint/back-paint and signal is not delayed. Strategy : Open buy same moment buy arrow appear and open sell same moment a sell arrow appear , close on well or on opposite signal . Recommended Time frame : 15 and above this arrow is good as ? : addon to your existing strategy ,
Stoch Arrow
Abdulkarim Karazon
STOCH ARROW is a long short arrow signal type indicator that is based on standard stochastic oscillator this indicator has 3 methods of giving long and short signal that are as follow : 1.whenever stochastic lines cross 2.when a cross happens in overbought and oversold zones (short arrow on overbought zone cross , long arrow on oversold zone cross) 3.when stochastic lines leave overbought and oversold zones (short arrow on leave from overbought zone  , long arrow leave on oversold zone) this ind
Supreme Trend
Abdulkarim Karazon
Supreme Trend is a reversal/continuation type Oscillator type indicator that is based on Moving average and stochastic indicators this indicator can be used in two methods : Reversal Method : short when golden arrow appear after arrows were above upper level (e.g 70) Reversal Method : long when Purple arrow appear after arrows were below lower level (e.g 30) Trend Method : long when arrows cross above 50 level line , short when arrows cross below 50 level line. use higher ma and stochastic peri
TMA Stochastic
Abdulkarim Karazon
TMA Stochastic es un indicador basado en un oscilador estocástico y un indicador de bandas tma, este indicador se basa en una estrategia de reversión. Periodo de tiempo recomendado: 15 años y más Configuraciones recomendadas: valores más bajos para especulación, valores más altos para swing trading ==================================================== ====================== Parámetros: Historial de tma: cuántas barras retroceden para mostrar las bandas de tma en el estocástico Períod
Sure Reversal
Abdulkarim Karazon
SURE REVERSAL is a histogram overbought/oversold type indicator that gives key reversal points that indicates a bull or bear market movment this indicator is fusion between moving average and the rsi indicator ,this indicator is non repainter , and is not delayed . Parameters : Ma period  Ma Method Ma Price Sure Period (Rsi) Sure Price (Rsi) ==============
FireArrow
Abdulkarim Karazon
FireArrow is an arrow signal based indicator that give buy and sell signals with tp and sl levels , the indicator gives buy/sell signals with alert on candle close along side tp and sl levels on chart for each signal this indicator does not repaint/back-paint and signal is not delayed. Strategy : Open buy same moment buy arrow appear and open sell same moment a sell arrow appear , set tp as drawn on chart along side sl. Recommended Time frame : 15 and above this arrow is good as ? : add
MartingaleArrow
Abdulkarim Karazon
Martingale Arrow es un indicador mt4 de tipo flecha diseñado para el comercio de opciones binarias martingala, esta flecha se imprime en la barra abierta/intra barra y da alerta. CÓMO UTILIZAR: abra la operación en el momento en que aparezca la flecha, si la operación ganó, espere la siguiente señal y opere con el mismo lote. Si la operación pierde el doble lote en la siguiente señal y continúa haciéndolo hasta que gane una señal, reinicie y opere con el primer lote comercial. PLAZO RECOMENDADO
StalkeR Arrow
Abdulkarim Karazon
5 (3)
StalkeR Arrow es un indicador de flecha que proporciona señales de compra y venta en la barra abierta/intrabarra, este indicador se basa en patrones de acción del precio y fractales. este indicador proporciona tp y sl para cada señal de compra y venta, tp y sl están en forma de líneas encima y debajo de cada señal, se extienden hasta que se forma una nueva señal Este indicador tiene un panel de backtesting que brinda estadísticas de ganancias/pérdidas de las señales históricas. Este indicador
Renko Star
Abdulkarim Karazon
Renko Star es un indicador de tipo flecha mt4 que está diseñado para intercambiar gráficos renko, este indicador tiene un panel de backtesting que le brinda al operador información útil como winrate y puntos ganados, también proporciona tp y sl en la multiplicación atr x, este indicador da su señal en barra abierta o intra barra y tiene una marca amarilla que marcará el precio exacto donde se dio la señal, la forma de utilizar este indicador es abriendo una compra o venta de acuerdo a la flecha
SuperEntryx
Abdulkarim Karazon
Super Entry es un indicador de tipo flecha todo en uno en el que proporciona señales largas y cortas solo en los niveles tp y sl que se basan en el valor ATR y se pueden cambiar y modificar. Este indicador proporciona un panel de pruebas retrospectivas que muestra la tasa de ganancias y otras estadísticas para dar una idea clara de cuánta precisión se puede esperar. este indicador no se repinta ni se repinta y la señal se enciende con barra abierta sin demora. Parámetros: Configuración: v
El EA Gold Mystery es un robot basado en el comercio de tendencias que utiliza varios indicadores personalizados integrados en su código para determinar las oportunidades de compra y venta. Este EA funciona muy bien con oro y se prueba en un marco de tiempo de 5 millones de oro; sin embargo, se puede usar en otros pares, pero entonces se necesitan pruebas más retrospectivas. El EA utiliza dos métodos para cerrar una señal: 1. TP/SL en la multiplicación del valor ATR, esto hará que ea establ
Filtro:
No hay comentarios
Respuesta al comentario