• Información general
  • Comentarios
  • Discusión

Donchian Channel Indicator

Harness the Power of Donchian Channels for Trend Trading

The Donchian Channel Indicator may your key to precision trading. With Donchian channels, you'll gain insights into market volatility, breakouts, and overbought/oversold conditions.  This winning strategy is named after its developer, Richard Donchian.

How Does the Donchian Strategy Work?

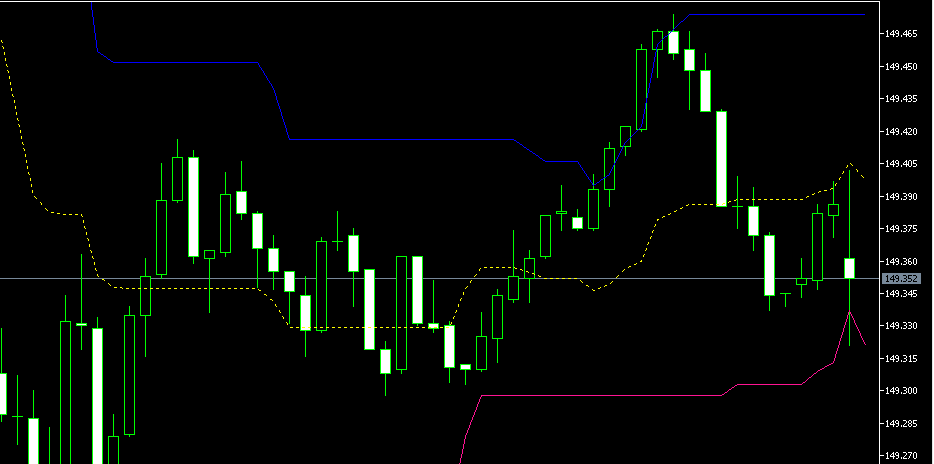
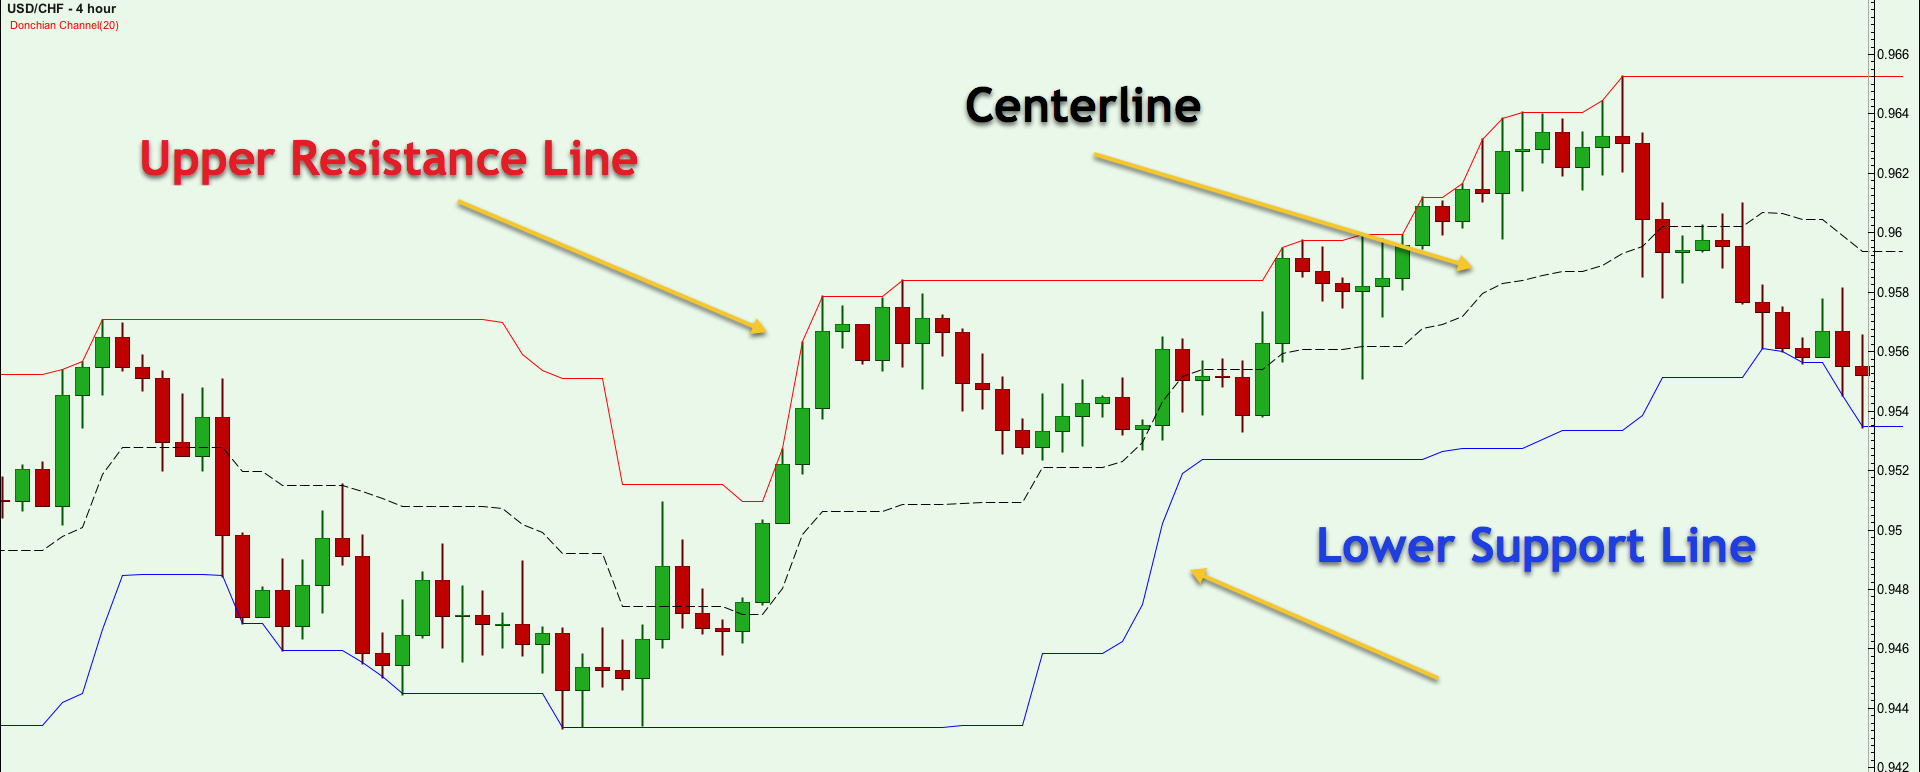
  • The upper band represents the previous period's highest high; 
  • The lower band represents the previous period's lowest Low; 
  • The centre band reflects the current high and low for that trading period as an average.

The Donchian system utilizes adjustable bands, precisely set to the n-period's highest highs and lowest lows over a moving average. But that's just the beginning.

***   The upper and lower bounds of a Donchian channel can form effective support and resistance levels, particularly when used in combination with other technical indicators.

*** Donchian channel analysis awaits to spot the point where a security's price breaks through the upper or lower band, at which point the trader enters into a long or short position.

Donchian channels pair naturally with other moving average indicators, creating a powerful crossover strategy. The Donchian moving average middle line often forms the short-term average in these scenarios.

Key Features:

  • Identify trending opportunities with ease
  • Pinpoint breakouts and potential reversals
  • Gauge overbought/oversold conditions
  • Combine with other technical indicators for enhanced analysis

Simplify your trading with Simple Ideas:

Idea 1: Leverage price action to identify trading opportunities. When the asset's price diverges from the simple moving average line(middle line), seize the moment. A breakout above or below the upper and lower bars can signal a bullish or bearish trend.

Idea 2: Adapt your trade position according to the price direction. Enter the market with a long or short position, capitalizing on the momentum.

Idea 3: Some traders may choose to utilize a stop-loss order in the event of false breakouts or trend reversals. This can assist you in avoiding losing money in a tumultuous market.


I hope this indicator makes your trading life a little bit easier. Wishing you a profitable and enjoyable trading day!


Productos recomendados
Auto Fibonacci
Ali Gokay Duman
5 (2)
This indicator calculates fibonacci levels via moving averages trend and draw these lines. You can change fast and slow Moving Averages settings for customization. Inputs: Fast MA Time Period :  64 Fast MA Shift: 0 Fast MA Method: Smoothed Fast MA Apply To: Median Price Slow MA Time Period: 32 Slow MA Shift: 0 Slow MA Method: Smoothed Slow MA Apply To: Median Price ZigZag: False ZigZag Color: Red ZigZag Type: DashDot ZigZag Width: VeryThin Fibo Settings TrendFibonacci: True FiboTrendColor: Blac
FREE
Five Minute Drive
Kenan Ozkarakas
4.2 (5)
"Five Minute Drive" indicator that is designed to be used in the 5 minute timeframe only. One of its most important advantages is that it shows the general trend in the upper time frames when looking at the 5-minute timeframe. Therefore, when opening positions in the 5 minute timeframe, when it is in line with the trends in the upper timeframes, you are less likely to be upside down. If you can interpret the curvilinear and linear lines drawn by this indicator on the graphic screen with your geo
FREE
Multi-timeframe trend indicator based on the ADX / ADXWilder indicator with Fibonacci levels The indicator shows trend areas using ADX or ADXWilder indicator data from multiple timeframes. The impulse mode of the indicator allows you to catch the beginning of a trend, and several "Screens" with different timeframes allow you to filter out market noise. Fibonacci levels are added to the price chart, which have flexible settings. How the indicator works: if PDI is greater than NDI, then   it`
FREE
Are you tired of drawing trendlines every time you're analyzing charts? Or perhaps you would like more consistency in your technical analysis. Then this is for you. This indicator will draw trend lines automatically when dropped on a chart. How it works Works similar to standard deviation channel found on mt4 and mt5. It has 2 parameters: 1. Starting Bar 2. Number of bars for calculation The   starting bar   is the bar which drawing of the trend lines will begin, while the   number of bars for c
FREE
Multi-timeframe trend indicator, based on the ADX / ADXWilder indicator The indicator shows trend areas using ADX or ADXWilder indicator data from multiple timeframes. The impulse mode of the indicator allows you to catch the beginning of a trend, and several "Screens" with different timeframes allow you to filter out market noise. How the indicator works: if PDI is greater than NDI, then it`s bullish movement; if PDI is less than NDI, then it`s bearish movement; to determine any trend, it
FREE
El estrategia de trading Moving Average Convergence Divergence (MACD) es una herramienta popular de análisis técnico que se utiliza para identificar cambios en el impulso y la dirección de la tendencia. El MACD se calcula restando la media móvil exponencial (EMA) de 26 períodos de la EMA de 12 períodos. Luego se traza una EMA de 9 períodos, llamada "línea de señal", sobre el MACD para actuar como un disparador de señales de compra y venta. El MACD se considera en territorio alcista cuando la lín
FREE
Follow The Line MT5
Oliver Gideon Amofa Appiah
4.42 (31)
This indicator obeys the popular maxim that: "THE TREND IS YOUR FRIEND" It paints a GREEN line for BUY and also paints a RED line for SELL. (you can change the colors). It gives alarms and alerts of all kinds. IT DOES NOT REPAINT and can be used for all currency pairs and timeframes. Yes, as easy and simple as that. Even a newbie can use it to make great and reliable trades. NB: For best results, get my other premium indicators for more powerful and reliable signals. Get them here: https://www.m
FREE
LT Force
Thiago Duarte
5 (6)
For those who like trend the Force will be a very useful indicator. This is because it is based on the famouse ADX, which measure the strenght of a trend, but without its 3 confusing lines. Force has its very simple interpretation: if the histogram is above zero level the trend is up, otherwise it is down. You can use it to find divergences too, which is very profitable. Thanks to Andre Sens for the version 1.1 idea. If you have any doubt or suggestion, please, contact me. Enjoy! This is a fre
FREE
Donchian Clouds
Samuel Manoel De Souza
The Indicator indicator draws 2 clouds based on Donchian Channels indicator values. The upper cloud is formed by the upper lines values and the lower cloud by the lowers lines values. The indicator allows to change the Channels parameters and the clouds colors the period of the base line and the multiplier of each Donchian Channels instance. The indicator holds 5 buffer index as follow: [0] - Outer values of the upper cloud [1]  - Inner values of the upper cloud [2]  - Base/Center line values [3
FREE
Renko Chart
Marcin Konieczny
4.08 (12)
This indicator allows to display Renko charts in the indicator window. Renko charts show only price movements that are bigger than the specified box size. It helps to eliminate noise and allows to focus on main trends. Time is not a factor here. Only price movements are taken into account. That's why Renko chart is not synchronized with the main chart it is attached to. Indicator works in two modes: CLOSE - only close prices are taken into account while building the chart HIGH_LOW - only high/
FREE
This indicator is a zero-lag indicator and displays  strength of trend change . True Trend  Oscillator Pro works best in combination with True Trend Moving Average Pro that displays exact trend as is. Oscillator value is exact price change in given direction of the trend. True Trend Moving Average Pro: https://www.mql5.com/en/market/product/103586 If you set PERIOD input parameter to 1 this indicator becomes a sharpshooter for binary options. Developers can use True Trend Oscillator in E
FREE
RenkoFromRealTicks DEMO
Stanislav Korotky
1 (1)
This non-trading expert utilizes so called   custom symbols   feature to build renko charts based on history of real ticks of selected standard symbol. RenkoFromRealTicks generates custom symbol quotes, thus you may open many charts to apply different EAs and indicators to the renko. It also transmits real ticks to update renko charts in real time. This is a functionally limited demo version of  RenkoFromRealTicks . RenkoFromRealTicks utility can not work in the tester because it uses CustomSym
FREE
Pure View
Siarhei Vashchylka
5 (1)
The " Pure View " indicator is designed to quickly display and hide indicators on the chart. Description 1. Currently Pure View works with Stochastic, MACD, RSI indicators 2. Displaying and hiding indicators occurs using hot keys 3. The key combination Shift + C will display or hide the "Stochastic" indicator on the chart 4. The key combination Shift + V will display or hide the "RSI" indicator on the chart 5. The key combination Shift + B will display or hide the "MACD" indicator on the chart
FREE
LT Rainbow Trend
Thiago Duarte
5 (1)
Do you, like me, like to trade with the trend? Then this indicator will help you! Rainbow Trend is a trend indicator, which uses several Moving Averages on the chart. It measures different trend strenght zones for different periods: very long term, long term, mid term, short term and very short term. Each zone has its color, and it is possible to have sound alert when the prices leaves a zone and enters another. Its configuration is very simple. If you find any bug or have any suggestions, co
Second Level Candles And Alligator Indicators 每12秒产生一个K线,而且自带Alligator指标,对超短线选手交易非常有帮助。程序启动时可能不成功,是因为MT5 MqlTick 数据加载少的原因。可以通过修改显示的数据参数避免,比如display=100,程序正常之后再将参数调大 display=300 。如果数据不正常,也可以采用重新加载的方式解决。 如果您对这个指标有任何建议,请联系作者。  Second Level Candles And Alligator Indicators  produced a candle per 12 seconds,include Alligator, it's helpful to Short-Term Trading。You'd better reload the indicator every start MT5 or change display parameter to reslove data bug. Please attach author when  you had some su
FREE
Free automatic Fibonacci is an indicator that automatically plots a Fibonacci retracement based on the number of bars you select on the BarsToScan setting in the indicator. The Fibonacci is automatically updated in real time as new highest and lowest values appears amongst the selected bars. You can select which level values to be displayed in the indicator settings. You can also select the color of the levels thus enabling the trader to be able to attach the indicator several times with differe
FREE
PZ Oscillator MT5
PZ TRADING SLU
3.8 (10)
Pz Oscillator es un sensible indicador que ofrece mucha información útil y detecta automáticamente las divergencias . Se puede utilizar esta herramienta como confirmación de la ejecución de la operación y para identificar la dirección y la fuerza de la tendencia. El indicador ha sido desarrollado como complemento a una serie de nuestras herramientas de trading. Dirección de la tendencia El oscilador dibuja dos medias móviles mostrando la dirección de la tendencia. Si la media móvil rápida está
FREE
Bollinger Bands Max Free MT5
John Louis Fernando Diamante
5 (1)
A flexible BB indicator You're no longer limited to the built in default of using BB off a SMA method, now you can choose from: SMA - SMMA - EMA - LWMA - ADAPTIVE - FRACTAL ADAPTIVE - DEMA - TEMA - VARIABLE INDEX DYNAMIC You now also have 2 standard deviation levels. A more featured version is available with 5 deviation levels, color gradients to lines and filling as well as candles, with full alerts too: Bollinger Bands Max MT5 Options: - MTF - 9 choices of MA to base the BB off -  2 adjust
FREE
Bar Color Trend
Germano Chagas
4.5 (10)
Combining the best of Price Action , Directional Movement , and Divergence/Convergence analysis, Candle Color Trend is a easy and reliable way to identify trend direction. The indicator automatically paints the candles according to the assumption that an uptrend is defined by prices that form a series of higher highs and higher lows. In contrast, a downtrend is defined by prices that form a series of lower highs and lower lows. Additionally, ADX Wilder indicator is used to measure trend weakness
FREE
MACD Colored ZeroLag
Farzin Sadeghi Bonjar
4.14 (7)
It is the MQL5 version of zero lag MACD that was available for MT4 here: https://www.mql5.com/en/code/9993 Also there was a colored version of it here but it had some problems: https://www.mql5.com/en/code/8703 I fixed the MT4 version which has 95 lines of code. It took me 5 days to write the MT5 version.(reading the logs and testing multiple times and finding out the difference of MT5 and MT4!) My first MQL5 version of this indicator had 400 lines of code but I optimized my own code again and n
FREE
Tabajara V5
Flavio Javier Jarabeck
4.88 (42)
Metatrader 5 version of the famous Andre Machado's Tabajara indicator. If you don't know Andre Machado's Technical Analysis work you don't need this indicator... For those who need it and for those several friend traders who asked this porting from other platforms, here it is... FEATURES 8-period Moving Average 20-period Moving Average 50-period Moving Average 200-period Moving Average Colored candles according to the inflexion of the 20-period MA SETTINGS You can change the Period of all M
FREE
Zigzag Pro MT5
Kaijun Wang
5 (4)
本指标 基于 Zigzag 基础上... 增加了: 1.增加了箭头指示,使图表更鲜明 2.增加了价格显示,使大家更清楚的看清价格. 3.增加了报警等设置,可以支持邮件发送 原指标特性: 1.基本的波段指标构型. 2.最近的2个ZIGZAG点不具有稳定性,随着行情而改变,(就是网友所说的未来函数) 3.原指标适合分析历史拐点,波段特性,对于价格波动有一定的指导性. Zigzag的使用方法一 丈量一段行情的起点和终点 (1)用ZigZag标注的折点作为起点和终点之后,行情的走势方向就被确立了(空头趋势); (2)根据道氏理论的逻辑,行情会按照波峰浪谷的锯齿形运行,行情确立之后会走回撤行情,回撤的过程中ZigZag会再次形成折点,就是回撤点; (3)在回撤点选择机会进场,等待行情再次启动,止损可以放到回撤的高点。 一套交易系统基本的框架就建立起来了。 Zigzag的使用方法二 作为画趋势线的连接点 趋势线是很常见的技术指标,在技术分析中被广泛地使用。 但一直以来趋势线在实战中都存在一个BUG,那就是难以保证划线的一致性。 在图表上有很多的高低点,到底该连接哪一个呢?不同的书上画趋势线的方
FREE
This is a buyer and seller aggression indicator that analyzes the shape of each candle and project this data in a histogram form. There are 4 histograms in one. On the front we have two: Upper - Buyer force. Lower - Seller force. At the background we also have two histogram, both with same color. They measure the combined strenght of buyers and sellers. This histograms can be turned off in Input Parameters. It is also possible to have the real or tick volume to help on this force measurement. IN
FREE
Donchian Pro
Paulo Henrique Faquineli Garcia
5 (2)
The Donchian Channel Channels are among the most popular tools of technical analysis, as they visually convey to the analyst the limits within which most price movement tends to occur. Channel users know that valuable information can be obtained at any time, whether prices are in the central region of a band or close to one of the border lines. One of the best known techniques to explore these concepts is Bollinger Bands. However, John Bollinger was not the only one to research the applicatio
FREE
The   Heikin Ashi indicator   is our version of the Heikin Ashi chart. Unlike competitor products, this indicator offers extensive options for calculating Heikin Ashi candles. In addition, it can be displayed as a classic or smoothed version. The indicator can calculate Heikin Ashi with moving average by four methods: SMA  - Simple Moving Average SMMA  - Smoothed Moving Average EMA  - Exponential Moving Average LWMA  - Linear Weighted Moving Average Main features The indicator shows Heikin
FREE
PFKBreakOut
Stanislav Korotky
This indicator displays breakouts on Point-And-Figure-like or Kagi-like custom symbol charts, generated by special expert advisers, such as PointFigureKagiCharts . This indicator is applicable only for custom instruments generated in appropriate way (with time-invariant bars which are multiples of a predefined box size). It makes no sense to apply it to other charts. The breakouts in up or down direction are marked by arrows. The breakout price is found at crossing of one of imaginary lines of
FREE
Paula Bollinger Bands Strategy
Francisco Gomes Da Silva
4 (2)
Bollinger bands out/in strategy A strategy created by Joe Ross, and very useful for finding trades when the market is overloaded. Indicator You don't need to find where there are entries on the chart, this indicator shows them for you. The entrance The trade is confirmed when the price closes outside the bollinger bands on a candle and the candle after the price closes inside the bands. comment I want to improve this indicator, so you can help me sending me your reviews and comments, thanks :).
FREE
Divergence Force
Alessandro Riggi
4 (1)
Divergence Force Indicador de Divergencia Descripción Divergence Force  es un indicador diseñado para identificar las divergencias entre el precio de un activo y el MACD (Moving Average Convergence Divergence). Este indicador traza automáticamente las líneas de tendencia en los máximos y mínimos del precio y del MACD, destacando las oportunidades potenciales de trading. Características Principales Identificación Automática de Divergencias : El indicador detecta automáticamente las divergencias a
FREE
Bollinger Bands B
Flavio Javier Jarabeck
5 (3)
John Bollinger created this indicator in 2010 as a way to read the original indicator (Bollinger Bands) in a more "technical" way, shown as an oscillator. The typical range of the Bollinger Bands %B is 0 - 0.5 - 1.0, where "0" represents the lower band, the "0.5" the middle band, and "1" the upper band. The line on the indicator represents the Closing prices. As simple as that. SETTINGS Bollinger Bands period of analysis Standard Deviation multiplier Shift Price type to be analyzed If you
FREE
Automatic Trendlines
Pasi Hakamaki
4.65 (51)
El indicador dibuja líneas de tendencia en el gráfico. Este indicador tiene seis entradas. El usuario puede especificar etiquetas alternativas para ambas líneas. Si se utilizan varias instancias del indicador, las etiquetas deben ser diferentes. El usuario puede establecer el ancho y el color de las líneas y la profundidad, lo que especifica qué picos significativos deben usarse. Por ejemplo, Depth = 10 establece líneas de tendencia utilizando los picos y valles actuales que tienen al menos 10 b
FREE
Los compradores de este producto también adquieren
Atomic Analyst MT5
Issam Kassas
4.79 (19)
En primer lugar, vale la pena enfatizar que este Indicador de Trading no repinta, no redibuja y no se retrasa, lo que lo hace ideal tanto para el trading manual como para el automatizado. Manual del usuario: configuraciones, entradas y estrategia. El Analista Atómico es un Indicador de Acción del Precio PA que utiliza la fuerza y el impulso del precio para encontrar una mejor ventaja en el mercado. Equipado con filtros avanzados que ayudan a eliminar ruidos y señales falsas, y aumentan el poten
Primero que todo, vale la pena enfatizar que este Sistema de Trading es un Indicador No Repintado, No Redibujado y No Retrasado, lo que lo hace ideal tanto para el trading manual como para el automatizado. Curso en línea, manual y descarga de ajustes preestablecidos. El "Sistema de Trading Inteligente MT5" es una solución completa de trading diseñada para traders nuevos y experimentados. Combina más de 10 indicadores premium y presenta más de 7 estrategias de trading robustas, lo que lo convie
Gold Stuff mt5
Vasiliy Strukov
4.9 (183)
Gold Stuff mt5: un indicador de tendencia diseñado específicamente para el oro, también se puede usar en cualquier instrumento financiero. El indicador no se vuelve a dibujar ni se retrasa. El marco de tiempo recomendado es H1. IMPORTANTE! Póngase en contacto conmigo inmediatamente después de la compra para obtener instrucciones y bonificación!   Puede obtener una copia gratuita de nuestro indicador Strong Support y Trend Scanner, por favor envíe un mensaje privado. ¡a mí! PARÁMETROS Draw
TPSpro RFI Levels MT5
Roman Podpora
4.67 (9)
Reversal First Impulse levels (RFI)      INSTRUCTIONS        RUS       -       ENG              R ecommended to use with an indicator   -   TPSpro  TREND PRO -  Version MT4                 A key element in trading is zones or levels from which decisions to buy or sell a trading instrument are made. Despite attempts by major players to conceal their presence in the market, they inevitably leave traces. Our task was to learn how to identify these traces and interpret them correctly. Main functi
TPSproTREND PrO MT5
Roman Podpora
4.89 (9)
TPSpro TREND PRO  - is a trend indicator that automatically analyzes the market and provides information about the trend and each of its changes, as well as giving signals for entering trades without redrawing! The indicator uses each candle, analyzing them separately. referring to different impulses - up or down impulse. Exact entry points into transactions for currencies, crypto, metals, stocks, indices!  Version MT4               DETAILED DESCRIPTION               R ecommended to use with an
Trend Screener Pro MT5
STE S.S.COMPANY
4.88 (67)
Desbloquee el poder del comercio de tendencias con el indicador Trend Screener: ¡su solución definitiva para el comercio de tendencias impulsada por lógica difusa y un sistema multidivisa!Mejore su comercio de tendencias con Trend Screener, el revolucionario indicador de tendencias impulsado por lógica difusa. Es un poderoso indicador de seguimiento de tendencias que combina más de 13 herramientas y funciones premium y 3 estrategias comerciales, lo que lo convierte en una opción versátil para co
Quantum Trend Sniper
Bogdan Ion Puscasu
4.92 (48)
Introduciendo       Indicador Quantum Trend Sniper   , el innovador indicador MQL5 que está transformando la forma en que identificas y negocias los cambios de tendencia. Desarrollado por un equipo de comerciantes experimentados con experiencia comercial de más de 13 años,       Indicador de francotirador de tendencia cuántica       está diseñado para impulsar su viaje comercial a nuevas alturas con su forma innovadora de identificar cambios de tendencia con una precisión extremadamente alta.
Atbot
Zaha Feiz
4.94 (16)
AtBot: Cómo funciona y cómo usarlo ### Cómo funciona El indicador "AtBot" para la plataforma MT5 genera señales de compra y venta utilizando una combinación de herramientas de análisis técnico. Integra la Media Móvil Simple (SMA), la Media Móvil Exponencial (EMA) y el índice de Rango Verdadero Promedio (ATR) para identificar oportunidades de trading. Además, puede utilizar velas Heikin Ashi para mejorar la precisión de las señales. Deja una reseña después de la compra y recibe un regalo especia
FX Power MT5 NG
Daniel Stein
5 (6)
Obtenga su actualización diaria del mercado con detalles y capturas de pantalla a través de nuestro Morning Briefing aquí en mql5 y en Telegram ! FX Power MT5 NG es la nueva generación de nuestro popular medidor de fuerza de divisas, FX Power. ¿Y qué ofrece este medidor de fuerza de nueva generación? Todo lo que le encantaba del FX Power original PLUS Análisis de fuerza de ORO/XAU Resultados de cálculo aún más precisos Períodos de análisis configurables individualmente Límite de cálculo persona
Ante todo, vale la pena enfatizar que esta Herramienta de Trading es un Indicador No Repintado, No Redibujado y No Retrasado, lo que la hace ideal para el trading profesional. Curso en línea, manual del usuario y demostración. El Indicador de Conceptos de Acción del Precio Inteligente es una herramienta muy potente tanto para traders nuevos como experimentados. Combina más de 20 indicadores útiles en uno solo, combinando ideas avanzadas de trading como el Análisis del Trader del Círculo Inte
IX Power MT5
Daniel Stein
4.17 (6)
IX Power   lleva por fin la insuperable precisión de FX Power a los símbolos que no son de Forex. Determina con exactitud la intensidad de las tendencias a corto, medio y largo plazo de tus índices, acciones, materias primas, ETF e incluso criptodivisas favoritas. Puede   analizar todo lo   que su terminal le ofrece. Pruébalo y experimenta cómo   tu timing mejora significativamente   a la hora de operar. Características principales de IX Power Resultados de cálculo 100% precisos y sin rep
Este tablero muestra los últimos   patrones armónicos   disponibles para los símbolos seleccionados, por lo que ahorrará tiempo y será más eficiente /   versión MT4 . Indicador gratuito:   Basic Harmonic Pattern Columnas del indicador Symbol:   aparecerán los símbolos seleccionados Trend :   alcista o bajista Pattern :   tipo de patrón (gartley, mariposa, murciélago, cangrejo, tiburón, cifrado o ABCD) Entry :   precio de entrada SL:   precio de stop loss TP1:   1er precio de toma de benefici
Este es un genial indicador para MT5 que ofrece señales precisas para entrar en una transacción sin redibujar. Se puede aplicar a cualquier activo financiero: fórex, criptomonedas, metales, acciones, índices. Nos dará valoraciones bastante precisas y nos dirá cuándo es mejor abrir y cerra una transacción. Eche un vistazo  al vídeo  (6:22), ¡contiene un ejemplo de procesamiento de una sola señal que ha amortizado el indicador! La mayoría de los tráders mejoran sus resultados comerciales durante l
Ahora $ 147 (aumentando a $ 499 después de algunas actualizaciones) - Cuentas ilimitadas (PC o Mac) Manual de usuario de RelicusRoad + Videos de capacitación + Acceso al grupo privado de Discord + Estado VIP UNA NUEVA MANERA DE VER EL MERCADO RelicusRoad es el indicador comercial más poderoso del mundo para divisas, futuros, criptomonedas, acciones e índices, y brinda a los comerciantes toda la información y las herramientas que necesitan para mantenerse rentables. Brindamos análisis téc
ICT, SMC, SMART MONEY CONCEPTS, SMART MONEY, Smart Money Concept, Support and Resistance, Trend Analysis, Price Action, Market Structure, Order Blocks, BOS/CHoCH,   Breaker Blocks ,  Momentum Shift,   Supply&Demand Zone/Order Blocks , Strong Imbalance,   HH/LL/HL/LH,    Fair Value Gap, FVG,  Premium  &   Discount   Zones, Fibonacci Retracement, OTE, Buy Side Liquidity, Sell Side Liquidity, BSL/SSL Taken, Equal Highs & Lows, MTF Dashboard, Multiple Time Frame, BigBar, HTF OB, HTF Market Structure
Easy By Sell is a market indicator for opening and closing positions. It becomes easy to track market entries with alerts. It indicates trend reversal points when a price reaches extreme values ​​and the most favorable time to enter the market. it is as effective as a Fibonacci to find a level but it uses different tools such as an algorithm based on ATR indicators and Stochastic Oscillator. You can modify these two parameters as you wish to adapt the settings to the desired period. My othe
Blahtech Supply Demand MT5
Blahtech Limited
4.54 (13)
Was: $299  Now: $99   Supply Demand uses previous price action to identify potential imbalances between buyers and sellers. The key is to identify the better odds zones, not just the untouched ones. Blahtech Supply Demand indicator delivers functionality previously unavailable on any trading platform. This 4-in-1 indicator not only highlights the higher probability zones using a multi-criteria strength engine, but also combines it with multi-timeframe trend analysis, previously confirmed swings
Advanced Supply Demand MT5
Bernhard Schweigert
4.53 (15)
¡Actualmente con 33% de descuento! ¡La mejor solución para cualquier tráder principiante o experto! Este indicador es una herramienta comercial única, de alta calidad y asequible, porque incorpora una serie de características patentadas y una nueva fórmula. Con esta actualización, podrá mostrar zonas de doble marco temporal. No solo podrá mostrar un marco temporal más alto, sino también mostrar ambos, el marco temporal del gráfico MÁS el marco temporal más alto: MOSTRANDO ZONAS ANIDADAS. A todos
Introduction to X3 Chart Pattern Scanner X3 Cherart Pattern Scanner is the non-repainting and non-lagging indicator detecting X3 chart patterns including Harmonic pattern, Elliott Wave pattern, X3 patterns, and Japanese Candlestick patterns. Historical patterns match with signal patterns. Hence, you can readily develop the solid trading strategy in your chart. More importantly, this superb pattern scanner can detect the optimal pattern of its kind. In addition, you can switch on and off individu
AW Trend Predictor MT5
AW Trading Software Limited
4.78 (58)
La combinación de niveles de tendencia y ruptura en un sistema. Un algoritmo de indicador avanzado filtra el ruido del mercado, determina la tendencia, los puntos de entrada y los posibles niveles de salida. Las señales indicadoras se registran en un módulo estadístico, que le permite seleccionar las herramientas más adecuadas, mostrando la efectividad del historial de señales. El indicador calcula las marcas Take Profit y Stop Loss. Manual e instrucciones ->   AQUÍ   / Versión MT4 ->   AQUÍ Có
FX Trend MT5
Daniel Stein
4.68 (37)
¿Quieres convertirte en un trader de 5 estrellas constantemente rentable? 1. Lee la descripción básica de nuestro sencillo trading sistema y y su mayor actualización de estrategia en 2020 2. Envíe una captura de pantalla de su compra para obtener su invitación personal a nuestro exclusivo chat de trading Tendencia Forex Muestra la dirección de la tendencia, la duración, la intensidad y la calificación de la tendencia resultante para todos los marcos temporales en tiempo real. De un solo vist
Introduciendo       Quantum Breakout PRO   , el innovador indicador MQL5 que está transformando la forma en que comercia con Breakout Zones. Desarrollado por un equipo de comerciantes experimentados con experiencia comercial de más de 13 años,       Desglose cuántico PRO       está diseñado para impulsar su viaje comercial a nuevas alturas con su innovadora y dinámica estrategia de zona de ruptura. El indicador de ruptura cuántica le dará flechas de señal en las zonas de ruptura con 5 zonas
Auto Order Block with break of structure based on ICT and Smart Money Concepts (SMC) Futures Break of Structure ( BoS )             Order block ( OB )            Higher time frame Order block / Point of Interest ( POI )    shown on current chart           Fair value Gap ( FVG ) / Imbalance   -  MTF      ( Multi Time Frame )    HH/LL/HL/LH  -  MTF      ( Multi Time Frame )  Choch  MTF      ( Multi Time Frame )  Volume Imbalance     ,  MTF          vIMB Gap’s Power of 3 Equal High
AT Forex Indicator MT5
Marzena Maria Szmit
5 (4)
The AT Forex Indicator MT5 is a sophisticated trading tool designed to provide traders with a comprehensive analysis of multiple currency pairs. This powerful indicator simplifies the complex nature of the forex market, making it accessible for both novice and experienced traders. AT Forex Indicator uses advanced algorithms to detect trends, patterns and is an essential tool for traders aiming to enhance their forex trading performance. With its robust features, ease of use, and reliable signal
Matrix Arrow Indicator MT5
Juvenille Emperor Limited
5 (14)
Matrix Arrow Indicator MT5   es una tendencia única 10 en 1 que sigue un indicador   100% sin repintado   de marcos temporales múltiples que se puede usar en todos los símbolos/instrumentos:   divisas ,   materias primas ,   criptomonedas ,   índices ,   acciones .  Matrix Arrow Indicator MT5  determinará la tendencia actual en sus primeras etapas, recopilando información y datos de hasta 10 indicadores estándar, que son: Índice de movimiento direccional promedio (ADX) Índice de canales de prod
Gold TMAF MTF - es el mejor indicador técnico bursátil. El algoritmo del indicador analiza el movimiento del precio de un activo y refleja la volatilidad y las posibles zonas de entrada. Las mejores señales del indicador: - Para VENTA = límite superior rojo de TMA2 por encima del límite superior rojo de TMA1 + indicador fractal rojo por encima + flecha amarilla de señal SR en la misma dirección. - Para COMPRA = límite inferior azul de TMA2 por debajo del límite inferior azul de TMA1 + i
Automated Trendlines MT5
Georgios Kalomoiropoulos
Las líneas de tendencia son la herramienta más esencial del análisis técnico en el comercio de divisas. Desafortunadamente, la mayoría de los comerciantes no los dibujan correctamente. El indicador de líneas de tendencia automatizadas es una herramienta profesional para comerciantes serios que lo ayuda a visualizar el movimiento de tendencia de los mercados. Hay dos tipos de Trendlines Bullish Trendlines y Bearish Trendlines. En la tendencia alcista, la línea de tendencia de Forex se dib
Elliott Wave Trend was designed for the scientific wave counting. This tool focuses to get rid of the vagueness of the classic Elliott Wave Counting using the guideline from the template and pattern approach. In doing so, firstly Elliott Wave Trend offers the template for your wave counting. Secondly, it offers Wave Structural Score to assist to identify accurate wave formation. It offers both impulse wave Structural Score and corrective wave Structure Score. Structural Score is the rating to sh
Gartley Hunter Multi
Siarhei Vashchylka
5 (8)
Gartley Hunter Multi - An indicator for searching for harmonic patterns simultaneously on dozens of trading instruments and on all possible timeframes. Manual (Be sure to read before purchasing) | Version for MT4 Advantages 1. Patterns: Gartley, Butterfly, Shark, Crab. Bat, Alternate Bat, Deep Crab, Cypher 2. Simultaneous search for patterns on dozens of trading instruments and on all possible timeframes 3. Search for patterns of all possible sizes. From the smallest to the largest 4. A
Golden Spikes Premium
Kwaku Bondzie Ghartey
Golden Spikes Detector Overview: The Golden Spikes Premium is a groundbreaking trading indicator meticulously crafted for the Boom and Crash indices on the Deriv market. Tailored to meet the needs of discerning traders, this powerful tool operates exclusively on the one-minute timeframe, providing timely and precise signals to maximize your trading potential. The Golden Spikes Detector stands out in its ability to deliver accurate signals, ensuring that you capitalize on market opportunities wit
Otros productos de este autor
Trade Assistant Panel
Md Sakhawat Hossain
4 (1)
Trade Assistant Panel: Your Optimal Trading Ally "The Trade Assistant Panel" is a graphical tool for traders aiming to simplify and enhance their trading experience. It streamlines order execution and management, allowing you to focus on market analysis and decision-making. With just a few clicks, you can initiate various order types, ensuring that you always have full control over your trading strategy: Buy Orders Sell Orders Buy Stop Orders Buy Limit Orders Sell Stop Orders Sell Limit Orders Y
FREE
Smart Trade and Order Manager: An Essential Tool for Precision Trading Smart Trade and Order Manager is your trusted trading assistant, meticulously designed to simplify and streamline your trading operations. It empowers traders by enabling swift order execution and effortless order management, allowing you to dedicate your valuable time to in-depth market analysis and decision-making. With just a few clicks, you can initiate various order types, ensuring you are always in control of your tradi
FREE
This powerful Indicator can automatically identify supply and demand zones and send you alerts, email and push notification on mobile whenever a new zone is created or when the price enters a specific zone. This indicator integrates with any timeframe and chart or currency pair, ensuring its versatility across your trading endeavors. Supply & Demand Zones Finder(SDZF) indicator seamlessly identifies proven supply and demand zones, areas where price has consistently found support or resistanc
Tired of information overload when analyzing forex currency strength? Introducing "All Currency Strength Live", the ultimate dashboard indicator for MetaTrader 5 that simplifies your trading life. This innovative tool provides a clear, concise overview of the strength of all major currencies, empowering you to make informed trading decisions with ease. With "All Currency Strength Live,"  you gain access to real-time insights into both price and volume strength across all major currencies. No mor
Filtro:
No hay comentarios
Respuesta al comentario