• Información general
  • Comentarios
  • Discusión (1)

MaCD DA

Что такое MACD? 

Обычный MACD – это осциллятор хотя его часто называют трендовым индикатором, или даже «трендовым осциллятором». Происходит это потому, что MACD строится на основе показаний двух скользящих средних.

Чем отличается MACD DA?


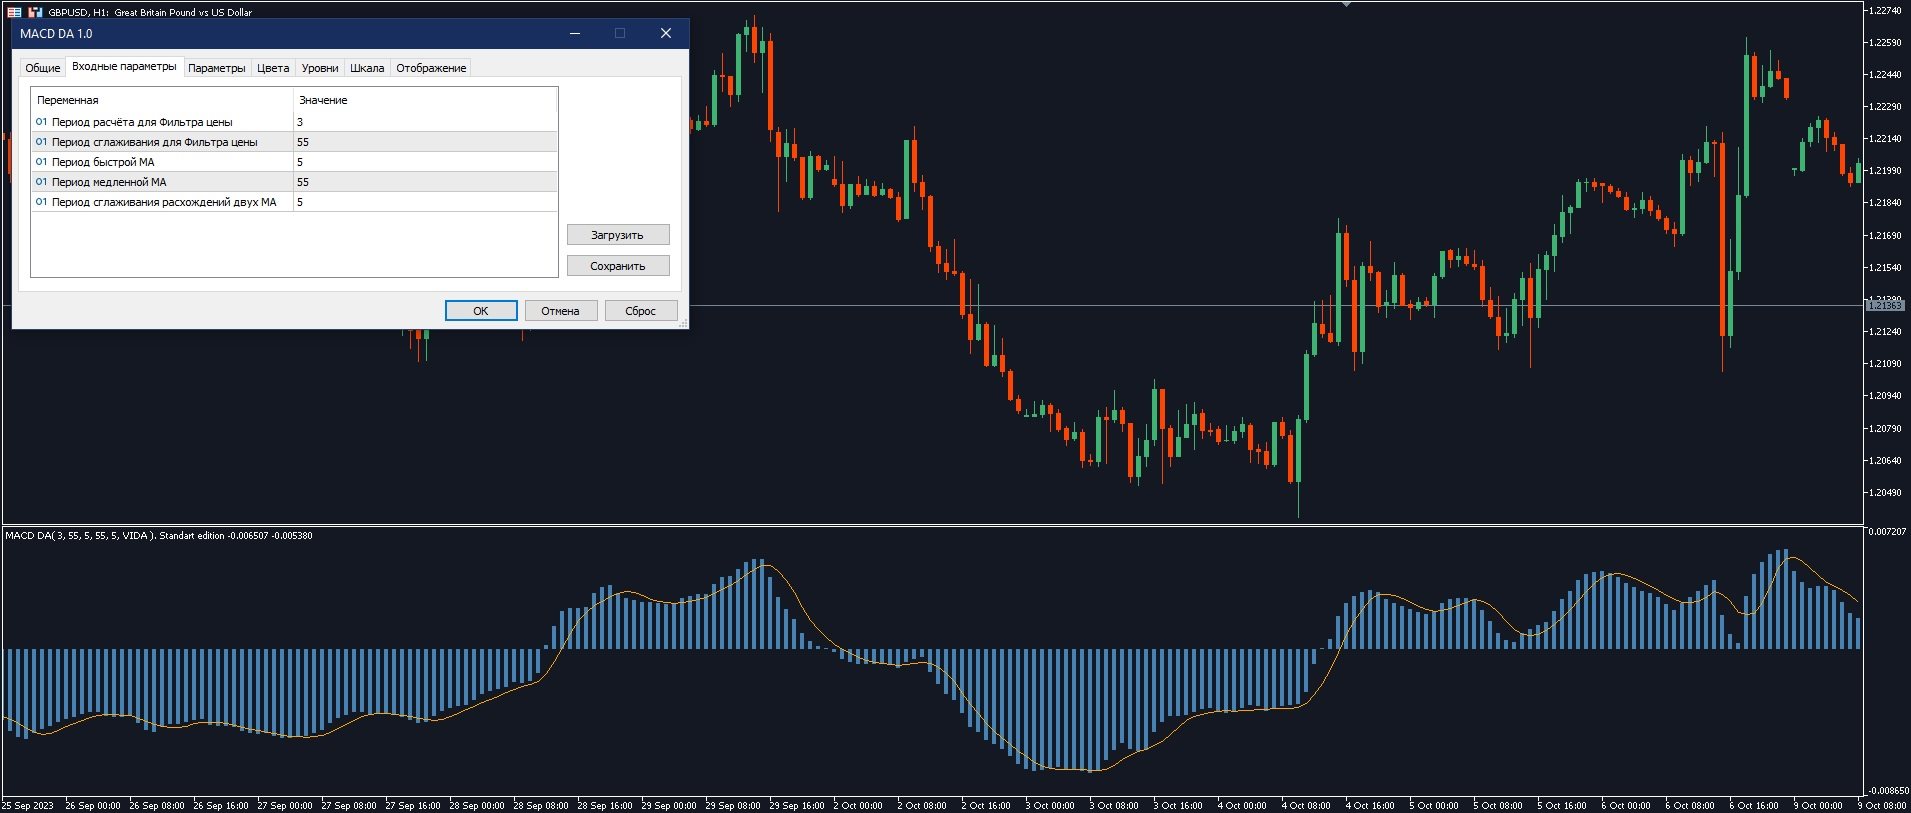
В MACD DA используется специальный ценовой фильтр. Только после фильтрации строится индикатор. Гистограмма отображает степень расхождения двух скользящих средних: если одна удаляется от другой, то растут и столбики гистограммы, если сближаются, тогда столбцы уменьшаются. Таким образом, при сильном движении столбцы гистограммы MACD DA будут длинными, при флете – короткими. 


Если гистограмма строится выше нулевой линии, это значит, что быстрая скользящая средняя поднимается над медленной, постепенно удаляясь – то есть, тренд восходящий. Если столбцы выстраиваются от нулевой отметки вниз – бы- страя скользящая находится ниже медленной, тренд нисходя- щий.
 
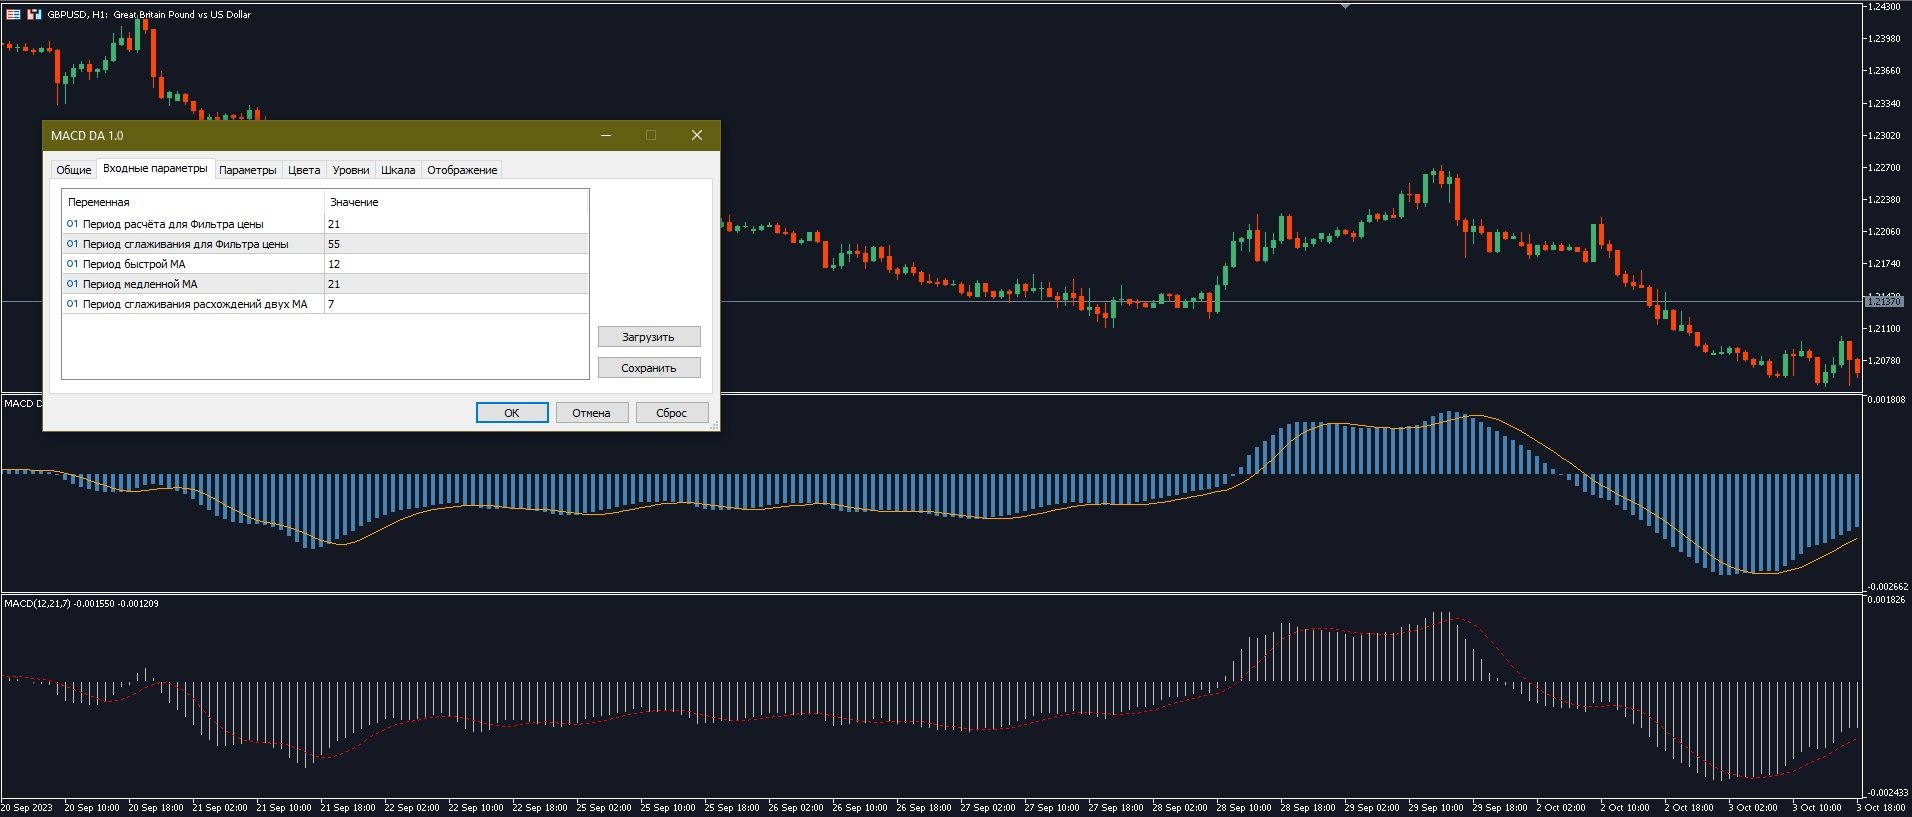
Вспомогательная линия, периодически пересекающаяся 

с гистограммой в окне индикатора – это скользящая средняя, построенная уже на показаниях гистограммы MACD DA, а не графика цены. Эта линия (MACD Smooth) строится для получе- ния от индикатора дополнительных сигналов. 


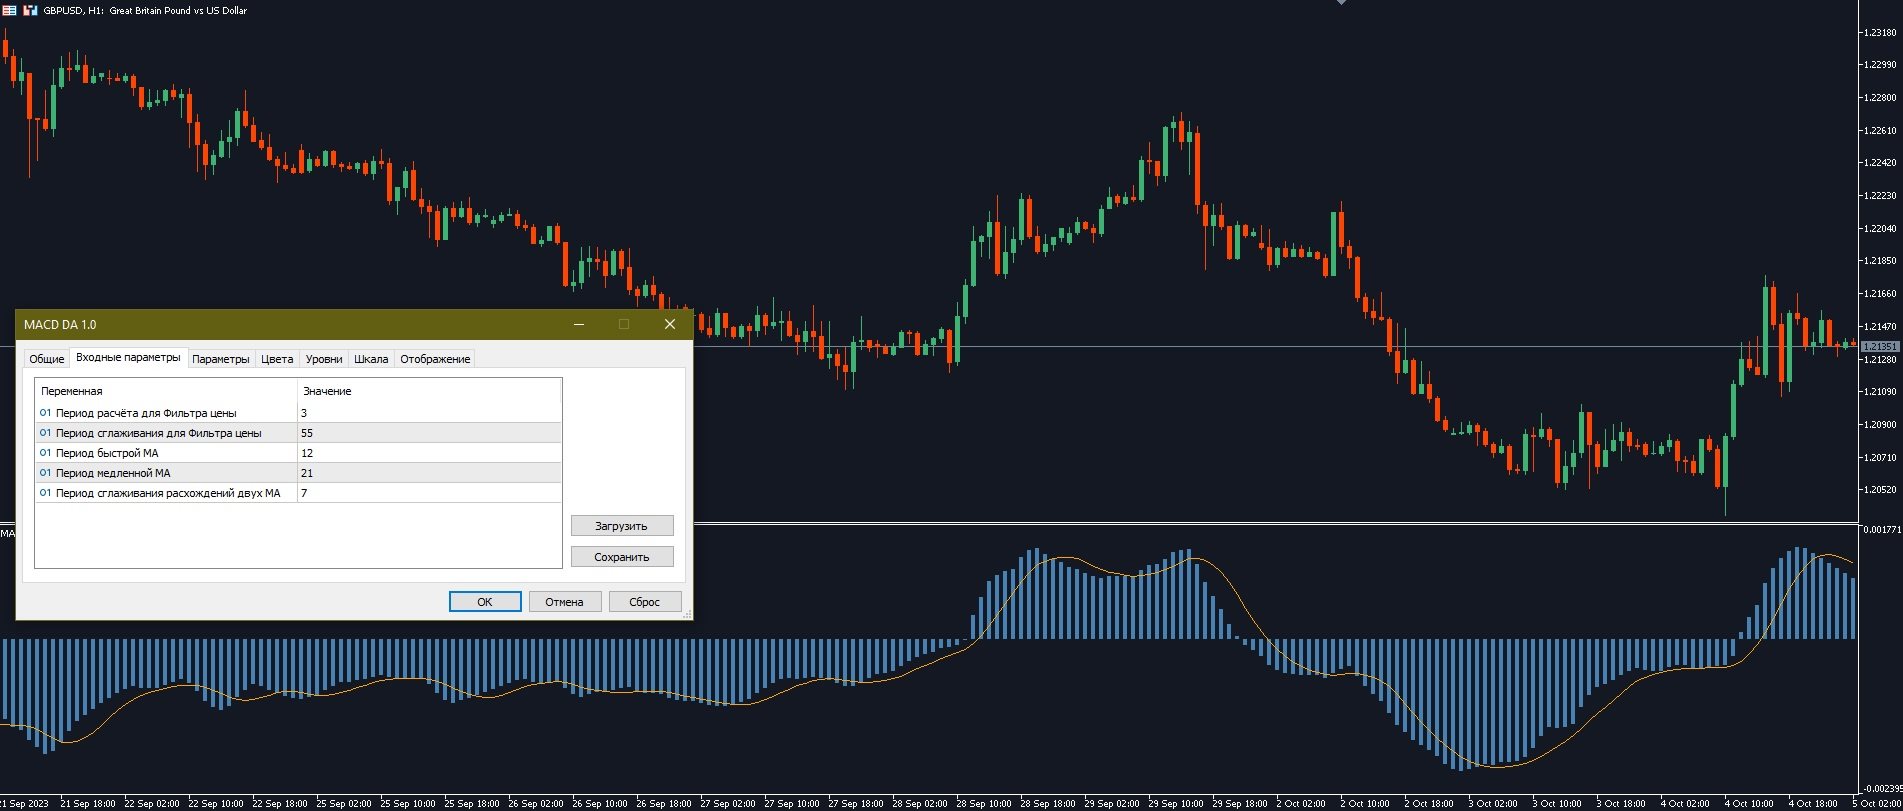
Настройки индикатора

  • Период сглаживания для фильтра цены - это количество баров, участвующих в сглаживании текущего значения индикатора
  • Период расчёта для фильтра цены - это количество баров, участвующих в фильтрации те- кущего значения индикатора
  • Период быстрой MA - это количество баров, участвующих в расчете быстрой скользящей средней
  • Период медленной MA - это количество баров, участвующих в расчете медлен- ной скользящей средней
  • Период сглаживания расхождений двух MA  - это количество баров, участвующих в расчете сигнальной линии


Productos recomendados
Bollinger Bands Max Free MT5
John Louis Fernando Diamante
5 (1)
A flexible BB indicator You're no longer limited to the built in default of using BB off a SMA method, now you can choose from: SMA - SMMA - EMA - LWMA - ADAPTIVE - FRACTAL ADAPTIVE - DEMA - TEMA - VARIABLE INDEX DYNAMIC You now also have 2 standard deviation levels. A more featured version is available with 5 deviation levels, color gradients to lines and filling as well as candles, with full alerts too: Bollinger Bands Max MT5 Options: - MTF - 9 choices of MA to base the BB off -  2 adjust
FREE
Please backtest with the exact balance of your live account before applying to real money. ==> If account balance is too low it may not trade at all! For MT4 version please contact via private message. martingale version is available here . Strategy description - Detect trend based on EMA18-EMA50-SMA200 alignment in three time frames: M15, H1, H4 - Trade in trend direction and exit when above alignment is broken. - The bot is tuned to trade XAUUSD(Gold). - The bot output is break even in rangi
FREE
Market Cycle and Trading Sessions
Maximiliano Frisione Figueroa
Indicador de Ciclo de Mercado y Sesiones de Trading Presentamos nuestro Indicador de Ciclo de Mercado y Sesiones de Trading, una herramienta diseñada para brindarte una visión completa del mercado financiero como nunca antes.  Observa el pulso del mercado con nuestro exclusivo indicador. Obtén una comprensión profunda de las fases del mercado, desde la acumulación hasta la distribución, para tomar decisiones informadas, estratégicas y con alta probabilidad. ¿Qué hace nuestro indicador? 1
FREE
Grid Averaging Pro  is a combination of Grid Trading and Cost Averaging with sophisticated algorithm and build-in Hedging to protect your account drawdown. Once your initial trade moves into negative territory, the recovery mechanism will kick in and place consecutive market orders in the same direction, all of which will be closed with a combined profit or approximately break even. Product Links Fully  Description in English  :  [USER GUIDE ENGLISH] - GRID AVERAGING PRO (MT4/MT5) Fully  Desc
Harness the Power of Donchian Channels for Trend Trading The Donchian Channel Indicator may your key to precision trading. With Donchian channels, you'll gain insights into market volatility, breakouts, and overbought/oversold conditions.  This winning strategy is named after its developer, Richard Donchian. How Does the Donchian Strategy Work? The upper band represents the previous period's highest high;  The lower band represents the previous period's lowest Low;  The centre band refle
FREE
PVA Color Candle
Ricardo Almeida Branco
Several techniques use volume as an important point in the trade. Whether to indicate strength, exhaustion, pullback weakness, among others. In chief I quote Richard Wyckoff's theory, which said about the importance of looking price and volume. However, there are several possibilities to filter what is volume that should be noticed. PVRSA/PVA users use an indicator with specific colors, which assist in identifying the volume and type of movement that the price has made. Will the high
Outro
Manuel Espinosa
" Outro " es un experto en trading automatizado " multi símbolo " que requiere que el trader realice pruebas en el par de su elección y modifique las entradas según su conveniencia. Este Asesor Experto ha sido diseñado con entradas no optimizadas, y utiliza un sistema Martingala para la gestión de riesgos. Es muy importante leer la   publicación del blog   antes de comenzar. Entra al grupo privado. Outro utiliza dos indicadores principales, Índice de Fuerza Relativa y el Oscilador estocástico ,
FREE
Stratos Bora mt5
Michela Russo
4.88 (69)
Stratos Bora is a trading robot  for the trading on forex. Designed to harness the power of the   Ichimoku Kinko Hyo   indicator, it offers 12 strategies to cater to every trader's style. Whether you're a seasoned trader or just starting out, Stratos Bora provides a seamless trading experience, ensuring you're always at the forefront of market opportunities. Important Information Revealed Leave a review and contact me via mql5 message to receive additional set files ! D o you want a   powerfu
FREE
ADTGroupOscillator
Avydel Talbo Doctolero
Description of ADTGroup_Oscillator.mq5 Indicator The ADTGroup_Oscillator.mq5 indicator is a custom technical analysis tool created by avydel. It is designed to provide insights into market trends and potential trading opportunities. Here is an overview of its key features and functionality: - **Indicator Type:** This oscillator is designed to be displayed in a separate window on the trading platform. - **Indicator Plots:** It utilizes one buffer for plotting data. - **Plot Style:** The indi
FREE
Ge Double Ema Macd
Garikoitz Errasti Randez
3.5 (4)
This EA is a robot based on two EMAs and an standard MACD. No martingale or grid strategies. All positions have their own stop-losses. Trading strategy: This robot uses fast and slow EMAs to check the trend of the currency, once the trend is known, the standard MACD will trigger the correct order. Placing the best take profit and stop loss depending on the strengh of the trend. The Expert Advisor is designed for best performance in EURUSD currency pair at a 15m timeframe. Both slow EMA and fast
FREE
Bollinger Bandit
Andre Philipp Hollenbach
The EA Bollinger Bandit is a sophisticated and adaptable trading tool designed to deliver reliable profitability across all timeframes, from M1 to D1. Utilizing the renowned Bollinger Bands indicator, coupled with advanced risk management and secure data storage features, this expert advisor is an essential resource for traders aiming for excellence. Key Features: Versatile Timeframe Trading : Operates effectively on all timeframes, from the swift M1 to the more extended D1, accommodating a w
Smooth Macd Pro
Francisco De Biaso Neto
É um indicador oscilador baseado no "MACD" convencional porém com suavização . Através desse indicador você será capaz de operar sem os ruídos produzidos pelo indicador "MACD" convencional. Em quais ativos o indicador funciona: Em qualquer ativo do mercado, tanto em forex, como B3 ou binárias.   Qual é o novo parâmetro: Smooth Period ou período de suavização, que representa o período que será suavizado no "MACD".
Trend Analyzer MT5 is a top-tier trend analysis indicator. It gives you a complete overview over current trend of multiple instruments over various time frames. It uses sophisticated statistical approach in order to determine the trend with the highest precision possible. Thanks to the Trend Analyzer MT5 you will know on which instruments you should focus on. Channel Group:   Click Here Features: Top-tier trend analysis One chart setup  Multiple time frames Multiple instruments Interactive da
FREE
MultiIndy Hybrid Trend
Miss Preeyanut Budsarakham
The EA MultiIndy Hybrid Trend used to a trading system that combines 11 indicators 1. BOLLINGER BAND 2.RSI 3.MA 4.AO 5.MACD 6.CCI 7.MOMENTUM 8.FRACTAL 9.PARABOLIC SAR 10.STD 11.ATR and then AI to find the probability of each indicator as its weight value. Common use of martingale Then backtest twenty years to become this automated trading system. EA can send alerts through the program line, can adjust the risk. or turn off the martingale according to user requirements or can trade any currency
Balancer EA
Amir Hossein Moharreri
Balancer EA  is a sophisticated grid trading tool designed to maximize profits by simultaneously opening both buy and sell positions. Or even greater control, you can also utilize the manual panel to fine-tune your trading strategy. However, it is important to use this EA with caution and only risk an amount you are comfortable with. We encourage you to backtest the EA and experiment with the settings to find the ones that work best for you. Recommended     symbols : Backtest on any symbol of yo
PFKBreakOut
Stanislav Korotky
This indicator displays breakouts on Point-And-Figure-like or Kagi-like custom symbol charts, generated by special expert advisers, such as PointFigureKagiCharts . This indicator is applicable only for custom instruments generated in appropriate way (with time-invariant bars which are multiples of a predefined box size). It makes no sense to apply it to other charts. The breakouts in up or down direction are marked by arrows. The breakout price is found at crossing of one of imaginary lines of
FREE
ichimoku indicator with alert; audible alert, email alert, push alert you can enable or disable the settings as you wish When there is a crossing of tenkansen and kijun you will get an alert When there is a cross between Senkouspan A and Senkouspan B you will get an alert Affordable sound settings possibility to modify the parameters of the ichimoku indicator
Noize Absorption Index - is the manual trading system that measures the difference of pressure between bears forces and bulls forces. Green line - is a noize free index that showing curent situation. Zero value of index shows totally choppy/flat market.Values above zero level shows how powerfull bullish wave is and values below zero measures bearish forces.Up arrow appears on bearish market when it's ready to reverse, dn arrow appears on weak bullish market, as a result of reverse expectation.
El indicador ROMAN5 Time Breakout traza automáticamente los bloques de la ruptura del soporte o resistencia. Permite al usuario elegir la dirección de la operación. Esta utilidad también tiene incorporada la función del aviso sonoro cuando aparece una nueva señal. Aparte, está disponible la función de avisos vía e-mail. Su dirección del e-mail, así como los parámetros del servidor SMTP tienen que estar indicados en los ajustes del terminal MetaTrader 5 (la pestaña "Correo electrónico"). Flecha a
FREE
TPSproTREND PrO MT5
Roman Podpora
4.89 (9)
TPSpro TREND PRO  - is a trend indicator that automatically analyzes the market and provides information about the trend and each of its changes, as well as giving signals for entering trades without redrawing! The indicator uses each candle, analyzing them separately. referring to different impulses - up or down impulse. Exact entry points into transactions for currencies, crypto, metals, stocks, indices!  Version MT4               DETAILED DESCRIPTION               R ecommended to use with an
Ichimoku Map (instant look at the markets) - built on the basis of the legendary Ichimoku Kinko Hyo indicator. The task of the Ichimoku Map is to provide information about the market strength on the selected time periods and instruments, from the point of view of the Ichimoku indicator. The indicator displays 7 degrees of buy signal strength and 7 degrees of sell signal strength. The stronger the trend, the brighter the signal rectangle in the table. The table can be dragged with the mouse. T
CAP Channel Trading MT5
MEETALGO LLC
3.96 (53)
The   CAP Channel Trading   is a volatility-based indicator that makes use of the “advanced envelope theory”. These envelopes consist of two outer lines. Envelope theory states that the market price will generally fall between the boundaries of the envelope (or channel). If prices move outside the envelope, it is a trading signal or trading opportunity. Benefits of the Channel Trading Indicator CAP Channel Trading works with any asset It can be applied to any financial assets: forex, cryptoc
FREE
Super Bollinger EA is an exclusive expert advisor that uses Bollinger Bands as indicator. It´s possible to configure the EA to trade as a low frequency or high frequency one - Scalping expert advisor. A Stochastic Oscillator filter is implemented to have some specific trades on Bollinger Bands. Takeprofit and Stoploss are calculated according to Bollinger Bands width or even with fixed TP and SL ( in points ). A trail and trade out system can also be configured and optimized. A number of orders
Stormer RSI 2
Ricardo Rodrigues Lucca
This strategy was learned from Stormer to be used on B3. Basically, 15 minutes before closing the market, it will check RSI and decided if it will open an position. This strategy do not define a stop loss. If the take profit reach the entry price it will close at market the position. The same happens if the maximal number of days is reached. It is created to brazilian people, so all configuration are in portuguese. Sorry Activations allowed have been set to 50.
Golden Gate - торговый советник использующий в своей торговой логике подходы стратегии Лари Вильямса, Джона Болинджера и  Дж. Уэллс Уайлдера в виде разработанных ими индикаторов.  Советник показал хорошие результаты тестирования стратегии на истории и при реальной торговле, в советнике можно менять значения данных индикаторов и выставлять самостоятельно размеры стоп лосса и тейк профита.  Как реально торгует данный советник и чего стоит ожидать при покупке данного советника - данный советник зак
Consolida Medias
OTAVIO AGUIAR CAMPOS Aguiar
O indicador imprime a linha da média longa quando as médias media e curta estão confinadas dentro dos limites de 1 ATR (average tru range) da média longa. Após períodos de congestão os preços se movimentam fortemente em uma direção. Este indicador não fornece pontos de entrada, apenas mostra que as médias estão bastante próximas. Parâmetros: Periodmalongo: Período da média longa. Periodmamedio: Período da segunda média. Periodmamedio2:Período da terceira média. Periodmacurto: Período da média cu
FREE
El Capturador de Tendencias: La Estrategia del Capturador de Tendencias con Indicador de Alerta es una herramienta versátil de análisis técnico que ayuda a los traders a identificar las tendencias del mercado y los posibles puntos de entrada y salida. Presenta una Estrategia dinámica del Capturador de Tendencias, adaptándose a las condiciones del mercado para una clara representación visual de la dirección de la tendencia. Los traders pueden personalizar los parámetros para que se ajusten a s
FREE
Bergland Gold MT5
Matthias Bessler
2.33 (3)
This fully automated trading system is part of the Bergland signal. It features a highly efficient trading logic, and a money management system. Reasonable calculated stop loss and take profit levels. It is easy to install and do not require a special setfile. XAUUSD, M15 Bergland Gold You can rent the Bergland signal here. If you like my product, please write a review.
Taurus MT5
Daniel Stein
5 (1)
Taurus simboliza la cima de los esfuerzos dedicados a perfeccionar la ya eficaz estrategia de reversión a la media, aprovechando nuestros exclusivos datos de volumen de negociación real. Negocia cada símbolo utilizando su mejor configuración única, proporcionando una relación riesgo/recompensa excepcional y una experiencia de negociación equilibrada y sin estrés para sus usuarios. Datos clave Estrategia de reversión media basada en datos únicos de volumen real Gestión seria del riesgo sin rejil
Trend Envelopes indicator is calculated based on a % of price change. That % is then used to determine if there is a new trend or trend remains the same. This version is using Standard Deviation for the price change calculation instead and is adding prices smoothing prior to be used in calculations. The smoothing can be done using one of the 4 average types: *   Simple Moving Average *   Exponential Moving Average *   Smoothed Moving Average *   Linear Weighted Moving Average Als
FREE
Los compradores de este producto también adquieren
Atomic Analyst MT5
Issam Kassas
4.56 (18)
En primer lugar, vale la pena enfatizar que este Indicador de Trading no repinta, no redibuja y no se retrasa, lo que lo hace ideal tanto para el trading manual como para el automatizado. Manual del usuario: configuraciones, entradas y estrategia. El Analista Atómico es un Indicador de Acción del Precio PA que utiliza la fuerza y el impulso del precio para encontrar una mejor ventaja en el mercado. Equipado con filtros avanzados que ayudan a eliminar ruidos y señales falsas, y aumentan el poten
Atbot
Zaha Feiz
4.97 (29)
AtBot: Cómo funciona y cómo usarlo ### Cómo funciona El indicador "AtBot" para la plataforma MT5 genera señales de compra y venta utilizando una combinación de herramientas de análisis técnico. Integra la Media Móvil Simple (SMA), la Media Móvil Exponencial (EMA) y el índice de Rango Verdadero Promedio (ATR) para identificar oportunidades de trading. Además, puede utilizar velas Heikin Ashi para mejorar la precisión de las señales. Deja una reseña después de la compra y recibe un regalo especia
Primero que todo, vale la pena enfatizar que este Sistema de Trading es un Indicador No Repintado, No Redibujado y No Retrasado, lo que lo hace ideal tanto para el trading manual como para el automatizado. Curso en línea, manual y descarga de ajustes preestablecidos. El "Sistema de Trading Inteligente MT5" es una solución completa de trading diseñada para traders nuevos y experimentados. Combina más de 10 indicadores premium y presenta más de 7 estrategias de trading robustas, lo que lo convie
Gold Stuff mt5
Vasiliy Strukov
4.92 (160)
Gold Stuff mt5: un indicador de tendencia diseñado específicamente para el oro, también se puede usar en cualquier instrumento financiero. El indicador no se vuelve a dibujar ni se retrasa. El marco de tiempo recomendado es H1. IMPORTANTE! Póngase en contacto conmigo inmediatamente después de la compra para obtener instrucciones y bonificación!   Puede obtener una copia gratuita de nuestro indicador Strong Support y Trend Scanner, por favor envíe un mensaje privado. ¡a mí! PARÁMETROS Draw
TPSpro RFI Levels MT5
Roman Podpora
4.67 (9)
反转第一脉冲水平 (RFI)     指示     俄羅斯     -        ESP   Recomendamos utilizar con   el indicador -   TPSpro 趋势专业版 -   MT5版本 Un elemento clave importante en el comercio son las zonas o niveles a partir de los cuales se toman decisiones para comprar o vender un instrumento comercial. A pesar de los intentos de los grandes actores de ocultar su presencia en el mercado, inevitablemente dejan rastros. Nuestra tarea era aprender a encontrar estos rastros e interpretarlos correctamente. Funciones principales:
Trend Screener Pro MT5
STE S.S.COMPANY
4.87 (61)
Desbloquee el poder del comercio de tendencias con el indicador Trend Screener: ¡su solución definitiva para el comercio de tendencias impulsada por lógica difusa y un sistema multidivisa!Mejore su comercio de tendencias con Trend Screener, el revolucionario indicador de tendencias impulsado por lógica difusa. Es un poderoso indicador de seguimiento de tendencias que combina más de 13 herramientas y funciones premium y 3 estrategias comerciales, lo que lo convierte en una opción versátil para co
Quantum Trend Sniper
Bogdan Ion Puscasu
4.79 (48)
Introduciendo       Indicador Quantum Trend Sniper   , el innovador indicador MQL5 que está transformando la forma en que identificas y negocias los cambios de tendencia. Desarrollado por un equipo de comerciantes experimentados con experiencia comercial de más de 13 años,       Indicador de francotirador de tendencia cuántica       está diseñado para impulsar su viaje comercial a nuevas alturas con su forma innovadora de identificar cambios de tendencia con una precisión extremadamente alta.
Advanced Supply Demand MT5
Bernhard Schweigert
4.5 (14)
¡Actualmente con 33% de descuento! ¡La mejor solución para cualquier tráder principiante o experto! Este indicador es una herramienta comercial única, de alta calidad y asequible, porque incorpora una serie de características patentadas y una nueva fórmula. Con esta actualización, podrá mostrar zonas de doble marco temporal. No solo podrá mostrar un marco temporal más alto, sino también mostrar ambos, el marco temporal del gráfico MÁS el marco temporal más alto: MOSTRANDO ZONAS ANIDADAS. A todos
FX Volume MT5
Daniel Stein
4.93 (14)
Obtenga su actualización diaria del mercado con detalles y capturas de pantalla a través de nuestro Morning Briefing aquí en mql5 y en Telegram ! FX Volume es el PRIMER y ÚNICO indicador de volumen que proporciona una visión REAL del sentimiento del mercado desde el punto de vista de un bróker. Proporciona una visión impresionante de cómo los participantes institucionales del mercado, como los brokers, están posicionados en el mercado Forex, mucho más rápido que los informes COT. Ver esta info
Este es un genial indicador para MT5 que ofrece señales precisas para entrar en una transacción sin redibujar. Se puede aplicar a cualquier activo financiero: fórex, criptomonedas, metales, acciones, índices. Nos dará valoraciones bastante precisas y nos dirá cuándo es mejor abrir y cerra una transacción. Eche un vistazo  al vídeo  (6:22), ¡contiene un ejemplo de procesamiento de una sola señal que ha amortizado el indicador! La mayoría de los tráders mejoran sus resultados comerciales durante l
FX Power MT5 NG
Daniel Stein
5 (5)
Obtenga su actualización diaria del mercado con detalles y capturas de pantalla a través de nuestro Morning Briefing aquí en mql5 y en Telegram ! FX Power MT5 NG es la nueva generación de nuestro popular medidor de fuerza de divisas, FX Power. ¿Y qué ofrece este medidor de fuerza de nueva generación? Todo lo que le encantaba del FX Power original PLUS Análisis de fuerza de ORO/XAU Resultados de cálculo aún más precisos Períodos de análisis configurables individualmente Límite de cálculo persona
Ante todo, vale la pena enfatizar que esta Herramienta de Trading es un Indicador No Repintado, No Redibujado y No Retrasado, lo que la hace ideal para el trading profesional. Curso en línea, manual del usuario y demostración. El Indicador de Conceptos de Acción del Precio Inteligente es una herramienta muy potente tanto para traders nuevos como experimentados. Combina más de 20 indicadores útiles en uno solo, combinando ideas avanzadas de trading como el Análisis del Trader del Círculo Inte
Conviértase en un Breaker Trader y obtenga beneficios de los cambios en la estructura del mercado a medida que se invierte el precio. El indicador de ruptura de bloque de órdenes identifica cuándo una tendencia o movimiento de precio se acerca al agotamiento y está listo para revertirse. Le alerta sobre cambios en la estructura del mercado que generalmente ocurren cuando una reversión o un retroceso importante están a punto de suceder. El indicador utiliza un cálculo patentado que identific
IX Power MT5
Daniel Stein
4.17 (6)
IX Power   lleva por fin la insuperable precisión de FX Power a los símbolos que no son de Forex. Determina con exactitud la intensidad de las tendencias a corto, medio y largo plazo de tus índices, acciones, materias primas, ETF e incluso criptodivisas favoritas. Puede   analizar todo lo   que su terminal le ofrece. Pruébalo y experimenta cómo   tu timing mejora significativamente   a la hora de operar. Características principales de IX Power Resultados de cálculo 100% precisos y sin rep
Black Dragon indicator mt5
Ramil Minniakhmetov
4.81 (52)
El indicador de detección de tendencias complementará cualquier estrategia y también se puede utilizar como una herramienta independiente. Ventajas Fácil de usar, no sobrecarga el gráfico con información innecesaria; Puede usarse como filtro para cualquier estrategia; Tiene niveles integrados de soporte y resistencia dinámicos, que se pueden usar tanto para obtener ganancias como para establecer límites de pérdidas; El indicador no cambia de color después de que se cierra la vela;  Funciona
ICT, SMC, SMART MONEY CONCEPTS, SMART MONEY, Smart Money Concept, Support and Resistance, Trend Analysis, Price Action, Market Structure, Order Blocks, BOS/CHoCH,   Breaker Blocks ,  Momentum Shift,   Supply&Demand Zone/Order Blocks , Strong Imbalance,   HH/LL/HL/LH,    Fair Value Gap, FVG,  Premium  &   Discount   Zones, Fibonacci Retracement, OTE, Buy Side Liquidity, Sell Side Liquidity, BSL/SSL Taken, Equal Highs & Lows, MTF Dashboard, Multiple Time Frame, BigBar, HTF OB, HTF Market Structure
How to use Pair Trading Station Pair Trading Station is recommended for H1 time frame and you can use it for any currency pairs. To generate buy and sell signal, follow few steps below to apply Pair Trading Station to your MetaTrader terminal. When you load Pair Trading Station on your chart, Pair Trading station will assess available historical data in your MetaTrader platforms for each currency pair. On your chart, the amount of historical data available will be displayed for each currency pai
** All Symbols x All Timeframes scan just by pressing scanner button ** ***Contact me after purchase to send you instructions and add you in "123 scanner group" for sharing or seeing experiences with other users. After 17 years of experience in the markets and programming, Winner indicator is ready. I would like to share with you! Introduction The 123 Pattern Scanner indicator with a special enhanced algorithm is a very repetitive common pattern finder with a high success rate . Interestingly,
Trend Hunter MT5
Andrey Tatarinov
5 (1)
Trend Hunter es un indicador de tendencias para trabajar en los mercados Forex, criptomonedas y CFD. Una característica especial del indicador es que sigue con confianza la tendencia, sin cambiar la señal cuando el precio perfora ligeramente la línea de tendencia. El indicador no se vuelve a dibujar; aparece una señal para ingresar al mercado después del cierre de la barra. Al avanzar a lo largo de una tendencia, el indicador muestra puntos de entrada adicionales en la dirección de la tendenc
Difícil de encontrar y escasa en frecuencia, las divergencias son uno de los escenarios comerciales más confiables. Este indicador busca y escanea las divergencias regulares y ocultas automáticamente usando su oscilador favorito. [ Guía de instalación | Guía de actualización | Solución de problemas | FAQ | Todos los productos ] Fácil de comerciar Encuentra divergencias regulares y ocultas Admite muchos osciladores bien conocidos Implementa señales comerciales basadas en rupturas Muestra n
Easy By Sell is a market indicator for opening and closing positions. It becomes easy to track market entries with alerts. It indicates trend reversal points when a price reaches extreme values ​​and the most favorable time to enter the market. it is as effective as a Fibonacci to find a level but it uses different tools such as an algorithm based on ATR indicators and Stochastic Oscillator. You can modify these two parameters as you wish to adapt the settings to the desired period. My othe
Este tablero muestra los últimos   patrones armónicos   disponibles para los símbolos seleccionados, por lo que ahorrará tiempo y será más eficiente /   versión MT4 . Indicador gratuito:   Basic Harmonic Pattern Columnas del indicador Symbol:   aparecerán los símbolos seleccionados Trend :   alcista o bajista Pattern :   tipo de patrón (gartley, mariposa, murciélago, cangrejo, tiburón, cifrado o ABCD) Entry :   precio de entrada SL:   precio de stop loss TP1:   1er precio de toma de benefici
¿Cansado de trazar líneas de soporte y resistencia? La resistencia de soporte es un indicador de marco de tiempo múltiple que detecta y traza automáticamente los soportes y las líneas de resistencia en el gráfico con un giro muy interesante: a medida que los niveles de precios se prueban con el tiempo y aumenta su importancia, las líneas se vuelven más gruesas y oscuras. [ Guía de instalación | Guía de actualización | Solución de problemas | FAQ | Todos los productos ] Mejora tu análisis técnic
PZ Day Trading MT5
PZ TRADING SLU
2.83 (6)
Este indicador detecta reversiones de precios en forma de zig-zag, utilizando solo análisis de acción de precios y un canal donchian. Ha sido diseñado específicamente para el comercio a corto plazo, sin repintar ni pintar en absoluto. Es una herramienta fantástica para comerciantes astutos con el objetivo de aumentar el tiempo de sus operaciones. [ Guía de instalación | Guía de actualización | Solución de problemas | FAQ | Todos los productos ] Increíblemente fácil de comerciar Proporciona
Native Channels
BeeXXI Corporation
5 (1)
This indicator recognizes all support and resistance levels. A number of unique high-performance techniques have been applied, which made the existence of this indicator possible. All formed channels are naturally visible: horizontal linear linear parabolic cubic (Polynomial 3 degrees - Wave) This is due to a bundle of approximating channels. The formed channels form "standing waves" in a hierarchical sequence. Thus, all support and resistance levels are visible. All parameter management is
Support And Resistance Screener está en un indicador de nivel para MetaTrader que proporciona múltiples herramientas dentro de un indicador. Las herramientas disponibles son: 1. Cribador de estructura de mercado. 2. Zona de retroceso alcista. 3. Zona de retroceso bajista. 4. Puntos pivotes diarios 5. Puntos de pivote semanales 6. Puntos Pivotes mensuales 7. Fuerte soporte y resistencia basado en patrón armónico y volumen. 8. Zonas de nivel de banco. OFERTA POR TIEMPO LIMITADO: El indicador de so
Sweet VWAP Anchored MT5
Francisco Gomes Da Silva
5 (4)
Economiza tiempo y toma decisiones más certeras con las VWAPs ancladas Si deseas probar el poder de esta herramienta, puedes descargar el indicador gratuito de VWAPs ancladas para MT5 . Además de trabajar de forma independiente, este indicador también es una extensión para la versión gratuita Sweet VWAP. Esto se debe a que, al hacer clic en la versión gratuita, la VWAP que ves en el puntero del ratón se fijará. Y para una mejor comprensión, lo que estará fijado allí es este indicador, con todas
Blahtech Supply Demand MT5
Blahtech Limited
4.54 (13)
Was: $299  Now: $99   Supply Demand uses previous price action to identify potential imbalances between buyers and sellers. The key is to identify the better odds zones, not just the untouched ones. Blahtech Supply Demand indicator delivers functionality previously unavailable on any trading platform. This 4-in-1 indicator not only highlights the higher probability zones using a multi-criteria strength engine, but also combines it with multi-timeframe trend analysis, previously confirmed swings
Was: $249  Now: $99   Market Profile defines a number of day types that can help the trader to determine market behaviour. A key feature is the Value Area, representing the range of price action where 70% of trading took place. Understanding the Value Area can give traders valuable insight into market direction and establish the higher odds trade. It is an excellent addition to any system you may be using. Inspired by Jim Dalton’s book “Mind Over Markets”, this indicator is designed to suit the
Gold Trend 5
Sergei Linskii
5 (1)
Tendencia del oro : se trata de un buen indicador técnico bursátil. El algoritmo del indicador analiza el movimiento del precio de un activo y refleja la volatilidad y las posibles zonas de entrada. Las mejores señales del indicador: - Para VENTA = histograma rojo + puntero rojo CORTO + flecha amarilla de señal en la misma dirección. - Para COMPRA = histograma azul + puntero azul LARGO + flecha de señal aqua en la misma dirección. Ventajas del indicador: 1. El indicador produce seña
Otros productos de este autor
Heiken Ashi DA
Vitaly Dodonov
4 (1)
Что такое Heiken Ashi?    Heiken Ashi — это метод построения графиков, который можно использовать для прогнозирования будущего движения цены. Он похож на традиционные свечные графики. Однако в отличие от обычного свечного графика, график Heiken Ashi пытается отфильтровать часть рыночного шума для лучшего определения трендовых движений на рынке. Как рассчитать Heiken Ashi? Heiken Ashi использует формулу COHL, которая означает «Закрытие, Открытие, Максимум, Минимум». Это четыре компонента, кото
FREE
Что такое Awesome Oscillator?   Создателем данного индикатора является Билл Вильямс. Этот трейдер разработал собственную торговую систему. Её основой служит постулат: «Рынок движется хаотично. Какие-либо закономерности этого движения вывести довольно сложно, так как многое зависит от психологических факторов.» Поэтому Вильямс разработал собственные инструменты для анализа рынка. Одним из таких инструментов и является индикатор АО. Это осциллятор, который дает возможность выявить силу текущего
FREE
Что такое Stochastic?  Осциллятор стохастик (Stochastic) – это индикатор импульса, который сравнивает конкретную цену закрытия инструмента с его диапазоном максимумов и минимумов за определенное количество периодов.    Основная идея индикатора заключается в том, что импульс предшествует цене, поэтому стохастический осциллятор может давать сигналы о фактическом движении цены непосредственно перед тем, как оно произойдет.   Stochastic является осциллятором с привязкой к диапазону от 0 до 100 (по
FREE
Что такое CCI индикатор?    Стандартный Индикатор CCI (Commodity Channel Index) – это осциллятор, который измеряет силу, стоящую за тем или иным движением цены. Он помогает определить, кто находятся у руля: быки или медведи.  Как и многие осцилляторы импульса, CCI работает, сравнивая текущую цену с предыдущими показателями, и на основе этого сравнения он решает, насколько сильное движение цены вверх/вниз.  Как рассчитать CCI? Метод расчета стандартного индикатора представляет собой оригинальн
FREE
OsMA DA
Vitaly Dodonov
5 (1)
Что такое OsMA DA?   Индикатор OsMA DA – это осциллятор, который построен на показаниях другого осциллятора – MACD. OsMA DA показывает расхождение между сигнальной линией MACD и его гистограммой. Момент пересечения гистограммы и линии – это нулевая отметка OsMA.   Если гистограмма MACD поднимается выше линии, то гистограмма самого OsMA DA поднимается выше нулевой отметки. В обратной ситуации OsMA DA демонстрирует отрицательные значения.   OsMA DA более узконаправленный индикатор, чем MACD. OsMA
FREE
Rsi DA
Vitaly Dodonov
5 (2)
Что такое RSI?  Индикатор RSI (Relative Strength Index, индекс относительной силы) — это индикатор, который измеряет соотношение восходящих и нисходящих движений. Расчет ведётся таким образом, что индекс выражается в диапазоне от 0 до 100. Как понять RSI? Если значение RSI находится равно 70 и больше, считается, что инструмент находится в состоянии перекупленности (ситуация, когда цены выросли выше, нежели того ожидал рынок). Значение RSI на уровне 30 и ниже считается сигналом о том, что инст
FREE
Momentum DA
Vitaly Dodonov
Что такое Momentum DA?  Индикатор Momentum DA- это инструмент техническго анализа, который измеряет скорость, с которой меняются цены активов за определенный период времени.  Является модификацией обчного Momentum.   Основная идея этого индикатора заключается в том, чтобы помочь трейдерам определить возможные точки разворота ценового тренда, определяя моменты ускорения или замедления роста или падения цен.    Он основан на предположении, что быстрое увеличение цены будет вероятно сопровождаться
FREE
Зачем нужен этот индикатор? Думаю вы замечали каким «хаотичным» может быть дви- жение цены. Бывают периоды, когда цена движется направле- но, почти без коррекций. В такие периоды трендовые страте- гии работают очень хорошо.  Но  как только направленное движение заканчивается, торговая стратегия перестаёт работать. Появляется очень  много ложных сигналов, что приводит к большому количеству отрицательных сделок.  Тогда возникла мысль: «А что если создать индикатор,  который смог бы заменить ценов
FREE
How often have you had to open deals or place pending orders, and then sit at the monitor and wait for the price to behave further? After all, you can miss the right moment and a profitable deal could easily become unprofitable. And all this is due to the fact that they did not tighten the stop loss, did not set a take profit. Or the price movement was so strong and fast that you missed the moment when the pending order was triggered. And then your entire trading plan was disrupted. Orders Inter
Filtro:
No hay comentarios
Respuesta al comentario