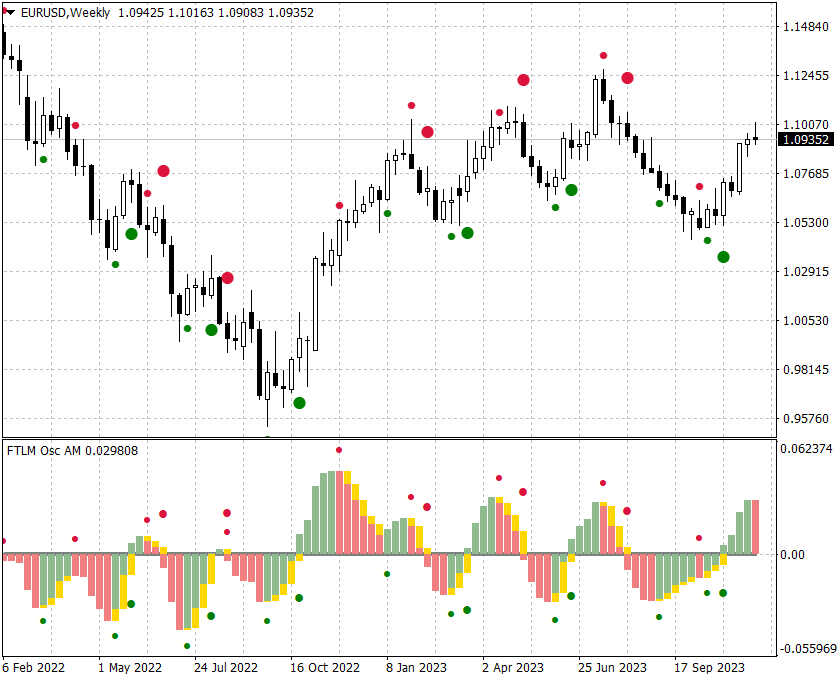
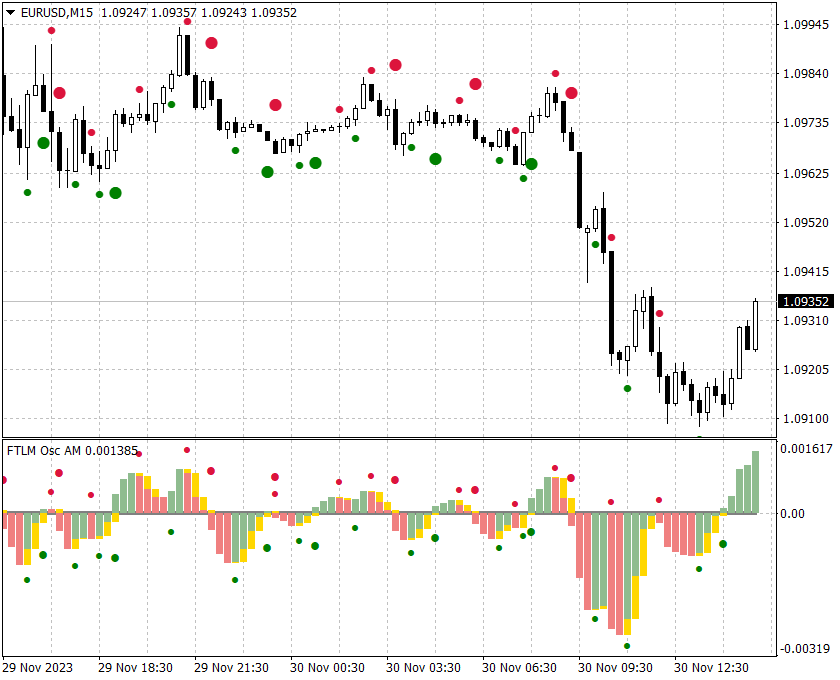
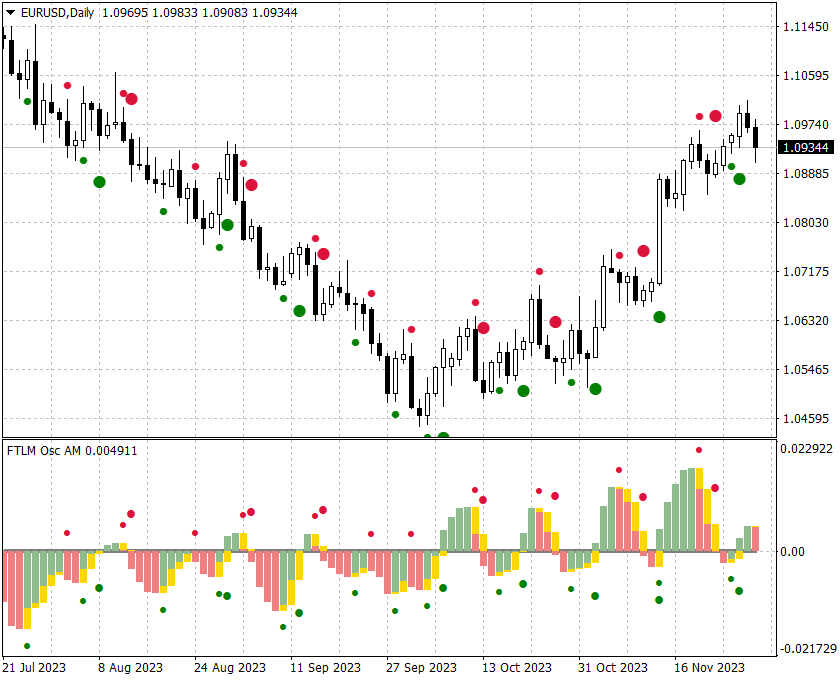
• Información general
  • Comentarios
  • Discusión
  • Novedades

FTLM Osc AM

Technical analysis indicator described in the article by Vladimir Kravchuk:

"Digital indicators in the technical analysis of financial markets".

In the proposed version, the indicator provides two types of signals:

1. Zero crossing;

2. Change of direction.

To use it effectively, it is necessary to take into account the long-term trend and open a position only in its direction.

It is recommended to use signal confirmation.

A signal is considered confirmed if the current price has overcome the maximum (for a buy signal) or minimum (for a sell signal) value of the bar on which the signal was sent.


Productos recomendados
RBCI Osc AM
Andriy Matviyevs'kyy
Technical analysis indicator described in the article by Vladimir Kravchuk: " Digital indicators in the technical analysis of financial markets ". In the proposed version, the indicator provides two types of signals: 1. Zero crossing; 2. Change of direction. To use it effectively, it is necessary to take into account the long-term trend and open a position only in its direction. It is recommended to use signal confirmation. A signal is considered confirmed if the current price has overcome the
FREE
STLM Osc AM
Andriy Matviyevs'kyy
Technical analysis indicator described in the article by Vladimir Kravchuk: " Digital indicators in the technical analysis of financial markets ". In the proposed version, the indicator provides two types of signals: 1. Zero crossing; 2. Change of direction. To use it effectively, it is necessary to take into account the long-term trend and open a position only in its direction. It is recommended to use signal confirmation. A signal is considered confirmed if the current price has overcome the
FREE
Volume Confirm Trend Zone is the indicator for filtering sideways and confirm trend to help your system trading. Indicator can use every currency pairs, every time frame, and every broker. You can see trend zone when color to change in volume indicator. Features When the color changes to the blue: Buy Zone is a strong trend. When the color changes to the red: Sell Zone is a strong trend.
Perfil del mercado Forex (FMP para abreviar) Si prefiere ver esto en un gráfico en vivo en lugar de leer la descripción, puede descargar instantáneamente una demostración gratuita aquí. Que esto no es: FMP no es la pantalla clásica de TPO codificada por letras, no muestra el cálculo general del perfil de datos del gráfico y no segmenta el gráfico en períodos ni los calcula. Que hace : Lo más importante es que el indicador FMP procesará los datos que residen entre el borde izquierdo del
FREE
Rira Renko
Vitor Palmeira Abbehusen
RENKO on Time Chart This indicator is an enhanced Renko, so you can watch the Renko bricks on the chart to understand price movement more clearly the other improvement is automated box size according to ATR (Average True Range) period you can set the ATR number as you want and the box size of Renko changes automatically based on price movement Inputs Mode: Box size is the input to specify the size of the Renko box you want to print on the chart. This input lets you choose the fixed b
This indicator alerts you when/before new candle bar formed. In other words,this indicator alerts you every 1/5/30/60/240 minutes. This indicator is especially useful for traders who trade when new bars formed. *This indicator don't work propery in strategy tester.Use Free Version to check functionality in live trading. Input Parameters Alert_Or_Sound =Sound ----- Choose alert or sound or both to notify you when new bar is coming. Enable_1mBarAlert ----- Enable alert for 1 min bar dif
Comparison
Andriy Sydoruk
The Comparison indicator can be used as an independent trading system. It is based on the idea that some currency pairs follow each other. The indicator allows you to simultaneously display another chart on the chart of one currency pair, which allows you to anticipate some movements and quite accurately determine the beginning of trends. The principle of trading by indicator signals is also simple: a currency pair, the chart of which is above, should be sold, and the one below, should be bou
A technical indicator that displays information about the trading volume in the form of a histogram of distribution by price levels. It is used as an independent indicator that helps to evaluate the current objective situation of the instrument, as well as in the format of integration with other methods of analysis, to confirm or filter when making trading decisions. Key Features: Interactive profile update, real-time work Five modes of histogram calculation The possibility of separating the vo
Scalping Snake Pro es un indicador de especulación único que muestra al comerciante los momentos de reversión de precios y no vuelve a dibujar. Este indicador, a diferencia de muchos otros en Internet, no redibuja sus valores. Dibuja señales en la primera barra, lo que le permite no retrasarse en la apertura de tratos. Este indicador envía notificaciones al comerciante por teléfono y correo electrónico cuando aparece una señal. Obtienes toda esta funcionalidad por solo $147. ¿Cómo operar con
DF Osc AM
Andriy Matviyevs'kyy
DF Osc AM - this is an indicator that marks the moments when the price direction changes.  The indicator uses adaptive digital filters for analysis. Digital filters are (simplified) a way to smooth data. Unlike traditional moving averages, a digital filter will be more effective in most cases. The indicator does not redraw, the signal is generated after the candle is completed. It is optimal to use the indicator signals as signals to open a trade when the price overcomes the maximum or minimum o
FREE
Trend Strength Meter
Sukunthakan Ngernbamrung
Simple Trading System Update !!! Follow this link to see our 2024 Strategy !!!   ( Download the EAs scanner ) INTRODUCTION : The strength meter is an trading tool that is used to identify trending and consolidating markets based on the percentage rate.  HOW TO USE IT : You can use this indicator with Deal Trading Trend >> Click Here << To use this trading tool to identify trending and consolidating markets (the most important part)
FREE
Chart Local Time
Rider Capital Group
4.68 (19)
Display your Local Time on your charts Display your local time   instead of (or along with) MT4 server time. Display crosshair   which highlights current candle time. Automatically adjusts based on chart zoom (zooming in or out). Displays on every timeframe (M1 – Month), and auto-adjusts as chart timeframe is changed. Handles special ½ hour time zones , such as India.  Renders   fast   (no lag) as you scroll charts. Customize the font family, font size, background color, and crossh
A "Volume Profile" is an advanced charting indicator that displays total volume traded at every price level over a user specified time period. The main components of the volume profile are POC ( Point Of Control - the price level, at which the maximum number of contracts were executed during a selected period), VAH ( Value Area High - the highest price in the Value Area) and VAL ( Value Area Low - the lowest price in the Value Area). When we settled on the original indicator, we spent a lot o
Introduction It is common practice for professional trades to hide their stop loss / take profit from their brokers. Either from keeping their strategy to the themselves or from the fear that their broker works against them. Using this indicator, the stop loss / take profit points will be drawn on the product chart using the bid price. So, you can see exactly when the price is hit and close it manually.  Usage Once attached to the chart, the indicator scans the open orders to attach lines fo
Sto Signal AM
Andriy Matviyevs'kyy
5 (1)
This indicator displays Stochastic osc signals on the price chart and allows the user to receive notifications of such signals. The Stochastic indicator is a classic and proven indicator of the technical analysis of the markets. Despite its age, it is still relevant today. Depending on the settings, the indicator allows you to work effectively on various TFs and any markets. Signals are given on fully formed bars and are not redrawn. Custom Parameters: Stochastic_Price (0-1) - The applied pric
FREE
Smooth price for Monarch MT4
Konstantin Gruzdev
3.67 (3)
The Smooth Price technical indicator is used for plotting a smoothed line as close to the price of the financial instrument as possible, and serves to eliminate its noise components. The indicator is part of the Monarch trading system, but here it is presented as an independent technical analysis tool. The indicator is based on the cluster digital filter , which, unlike the ClusterSMA , is applied directly to the price time series. Smooth Price does not redraw (except the very last, zero bar) an
Indicador de scalping de Forex que no vuelve a dibujar sus flechas. Funciona mejor en los plazos M5, M15, M30, H1. La configuración predeterminada es para el marco de tiempo M5. La siguiente imagen muestra un ejemplo de trabajo en el gráfico H1 con el valor del parámetro "período = 0,35". Puede descargar la versión demo y probarla usted mismo. Ahora usamos las señales de este indicador en casi todas nuestras estrategias de scalping. Según nuestros cálculos, la precisión de sus señales es de alr
The indicator allows you to trade binary options. The recommended time frame is М1 and the expiration time is 1,2,3 minutes. The indicator suitable for auto and manual trading. A possible signal is specified as a arrows above/under a candle. You should wait until the candle closes! Arrows are not re-painted Trade sessions: TOKYO section (Half-end) Currency pairs: USD/JPY Working time frame: M1 Expiration time: 1,2,3 minutes. The indicator also shows good results when using the martingale strateg
FREE
Blahtech Market Profile
Blahtech Limited
4.61 (18)
Was: $249  Now: $99   Market Profile defines a number of day types that can help the trader to determine market behaviour. A key feature is the Value Area, representing the range of price action where 70% of trading took place. Understanding the Value Area can give traders valuable insight into market direction and establish the higher odds trade. It is an excellent addition to any system you may be using. Blahtech Limited presents their Market Profile indicator for the MetaTrader community. Ins
SimSim Tournament Currency Strength Table   This is a multi-currency indicator; it shows the relative strength of the currency and 28 major currency pairs. There are many similar indicators on the market, but let there be one more. In this indicator, unlike others, you can specify weighting factors for each timeframe. Weighting factors. Why are they? Each trader prefers to work with a specific time frame, which is the main one for him, and the signals from him are most important. Examples of
PZ Trend Trading
PZ TRADING SLU
4.8 (5)
Trend Trading es un indicador diseñado para sacar el máximo provecho posible de las tendencias que tienen lugar en el mercado, mediante el cronometraje de retrocesos y rupturas. Encuentra oportunidades comerciales al analizar qué está haciendo el precio durante las tendencias establecidas. [ Guía de instalación | Guía de actualización | Solución de problemas | FAQ | Todos los productos ] Opere en los mercados financieros con confianza y eficiencia Aproveche las tendencias establecidas sin s
Indicator for binary options arrow is easy to use and does not require configuration works on all currency pairs, cryptocurrencies buy signal blue up arrow sell signal red down arrow tips do not trade during news and 15-30 minutes before their release, as the market is too volatile and there is a lot of noise it is worth entering trades one or two candles from the current period (recommended for 1 candle) timeframe up to m 15 recommended money management fixed lot or fixed percentage of the depo
Keltner Trend Pro - Unleash the Power of Price Action! Are you ready to transform your trading approach? Meet Keltner Trend Pro, an Expert Advisor meticulously crafted to harness the dynamic movements of the market using the renowned Keltner Channel and Average True Range (ATR) indicators. Limited-time Special Opportunity: Seize the moment! Be among the first 10 (Purchasing 0/10) to seize this unique opportunity, and not only will you acquire a top-tier trading algorithm but also enjoy an exclu
FREE
VR Grid
Vladimir Pastushak
4.57 (7)
El indicador VR Grid está diseñado para crear una cuadrícula gráfica con configuraciones definidas por el usuario. A diferencia de la cuadrícula estándar , VR Grid se utiliza para construir niveles circulares . Dependiendo de la elección del usuario, el paso entre los niveles de ronda puede ser arbitrario. Además, a diferencia de otros indicadores y utilidades, VR Grid mantiene la posición de la grilla incluso cuando cambia el período de tiempo o se reinicia el terminal. Las configuraciones, arc
FREE
Daily Average Retracement Dashboard is an indicator that allows you to monitor multiple currency pairs at one time. This indicator is mainly for strategies that trade price retracement based on Resistance 3/4 or Support 3/4. After applying this indicator to the chart window, it will hide the chart and display the currency pairs in a table form. There are several data shown on the table that will help trader know when to analyze the currency and do trade using retracement. The indicator will only
FREE
Forex Gump
Andrey Kozak
2.83 (6)
Forex Gump is a fully finished semi-automatic trading system. In the form of arrows, signals are displayed on the screen for opening and closing deals. All you need is to follow the instructions of the indicator. When the indicator shows a blue arrow, you need to open a buy order. When the indicator shows a red arrow, you need to open a sell order. Close orders when the indicator draws a yellow cross. In order to get the most effective result, we recommend using the timeframes H1, H4, D1. There
Smart Liquidity Profile
Suvashish Halder
4 (4)
The Smart Liquidity Profile is color-coded based on the importance of the traded activity at specific price levels, allowing traders to identify significant price levels such as support and resistance levels, supply and demand zones, liquidity gaps, consolidation zones, Buy-Side/Sell-Side Liquidity and so on.  Smart Liquidity Profile allows users to choose from a number of different time periods including 'Auto,' 'Fixed Range,' 'Swing High,' 'Swing Low,' 'Session,' 'Day,' 'Week,' 'Month,' 'Quar
RSX Signal 2 AM
Andriy Matviyevs'kyy
The indicator displays the signals of the RSX oscillator on the price chart. (To display these signals in a separate window, along with the oscillator, another indicator is used -  RSX Osc 4 AM ). It is optimal to use the indicator signals as signals to open a trade when the price overcomes the maximum or minimum of the bar at which the signal was given. An opposite signal cancels the previous signal. Settings: Data period for indicator calculation - data period for indicator calculation; Data
FREE
Heiken Ashi candle chart is an improved version of The Japanese candle chart, which can effectively filter the market "noise" of the Japanese candle chart. It is favored by many traders for its simplicity and intuition. For trend traders, the HA candle chart is a magic tool. Unlike the traditional Japanese candle chart, Heikenashi does not reflect the opening price, high price, low price and closing price of the market. Instead, Heikenashi calculates the value of a single K line in the dominant
Indicador Forex HTF DeMarker para MT4 Este indicador es una herramienta útil utilizada por los operadores técnicos para encontrar puntos de entrada y salida. HTF significa: Marco de tiempo más alto. La línea del oscilador DeMarker indica la posición actual del precio en relación con los máximos y mínimos anteriores DeMarker proporciona las señales de divergencia regulares más eficientes entre otros osciladores La zona de Sobrecompra es cuando el DeMarker está por encima de 0,7 y la de SobreVe
Los compradores de este producto también adquieren
Gann Made Easy
Oleg Rodin
4.92 (77)
Gann Made Easy es un sistema de comercio de Forex profesional y fácil de usar que se basa en los mejores principios de comercio utilizando la teoría del Sr. W. D. Gann. El indicador proporciona señales precisas de COMPRA y VENTA, incluidos los niveles de Stop Loss y Take Profit. Puede comerciar incluso sobre la marcha utilizando notificaciones PUSH. ¡Por favor, póngase en contacto conmigo después de la compra! ¡Compartiré mis consejos comerciales con usted y excelentes indicadores de bonificació
TPSpro RFI Levels
Roman Podpora
4.85 (20)
Reversal First Impulse levels (RFI)    INSTRUCTIONS        RUS       -       ENG              R ecommended to use with an indicator   -   TREND PRO -  Version MT5 A key element in trading is zones or levels from which decisions to buy or sell a trading instrument are made. Despite attempts by major players to conceal their presence in the market, they inevitably leave traces. Our task was to learn how to identify these traces and interpret them correctly. Main functions: Displaying active zones
Atomic Analyst
Issam Kassas
5 (3)
En primer lugar, vale la pena enfatizar que este Indicador de Trading no repinta, no redibuja y no se retrasa, lo que lo hace ideal tanto para el trading manual como para el automatizado. Manual del usuario: configuraciones, entradas y estrategia. El Analista Atómico es un Indicador de Acción del Precio PA que utiliza la fuerza y el impulso del precio para encontrar una mejor ventaja en el mercado. Equipado con filtros avanzados que ayudan a eliminar ruidos y señales falsas, y aumentan el poten
Gold Stuff
Vasiliy Strukov
4.89 (261)
Gold Stuff: un indicador de tendencia diseñado específicamente para el oro, también se puede usar en cualquier instrumento financiero. El indicador no se vuelve a dibujar ni se retrasa. El marco de tiempo recomendado es H1. Este indicador está escrito por EA Gold Stuff Advisor, puede encontrarlo en mi perfil.  Puede obtener una copia gratuita de nuestro indicador Strong Support y Trend Scanner, por favor envíe un mensaje privado. ¡a mí! IMPORTANTE! Póngase en contacto conmigo inmediatamente d
TPSproTREND PrO
Roman Podpora
4.78 (18)
TPSpro TRENDPRO  - is a trend indicator that automatically analyzes the market and provides information about the trend and each of its changes, as well as giving signals for entering trades without redrawing! The indicator uses each candle, analyzing them separately. referring to different impulses - up or down impulse. Exact entry points into transactions for currencies, crypto, metals, stocks, indices!  -  Version MT5               DETAILED DESCRIPTION                R ecommended to use with
Trend Punch
Mohamed Hassan
5 (14)
Manual guide:   Click here WEEKEND SALE PROMO:   $65 ONLY!  -- Next price is  $120 .  This indicator is unstoppable when combined with our other indicator called  Support & Resistance . After purchase, send us a message and you will get it   for  FREE as a BONUS! I like to use Trend Punch on XAUUSD on the M1 timeframe & higher ones!  Introducing Trend Punch , the revolutionary forex trend indicator that will transform the way you trade! Trend Punch is uniquely designed to provide
Enigmera
Ivan Stefanov
5 (3)
ENIGMERA: El núcleo del mercado https://www.enigmera.com Introducción Este indicador y sistema de negociación es un enfoque extraordinario de los mercados financieros. ENIGMERA utiliza los ciclos fractales para calcular con precisión los niveles de soporte y resistencia. Muestra la auténtica fase de acumulación y proporciona dirección y objetivos.  Un sistema que funciona tanto si estamos en una tendencia como en una corrección.  ¿Cómo funciona? ENIGMERA consta de tres líneas: la línea de s
ACTUALMENTE 26% DE DESCUENTO ¡La mejor solución para cualquier operador novato o experto! Este indicador es una herramienta única, de alta calidad y asequible porque hemos incorporado una serie de características propias y una nueva fórmula. ¡Con sólo UN gráfico puede leer la Fuerza de la Divisa para 28 pares de Divisas! Imagínese cómo mejorará su operativa porque podrá señalar el punto exacto de activación de una nueva tendencia o de una oportunidad de scalping. Manual del usuario: haga
Scalper Inside PRO
Alexey Minkov
4.74 (58)
An exclusive indicator that utilizes an innovative algorithm to swiftly and accurately determine the market trend. The indicator automatically calculates opening, closing, and profit levels, providing detailed trading statistics. With these features, you can choose the most appropriate trading instrument for the current market conditions. Additionally, you can easily integrate your own arrow indicators into Scalper Inside Pro to quickly evaluate their statistics and profitability. Scalper Inside
Conviértase en un Breaker Trader y obtenga beneficios de los cambios en la estructura del mercado a medida que se invierte el precio. El indicador de ruptura de bloque de órdenes identifica cuándo una tendencia o movimiento de precio se acerca al agotamiento y está listo para revertirse. Le alerta sobre cambios en la estructura del mercado que generalmente ocurren cuando una reversión o un retroceso importante están a punto de suceder. El indicador utiliza un cálculo patentado que identific
Advanced Supply Demand
Bernhard Schweigert
4.92 (313)
¡Actualmente con 33% de descuento! ¡La mejor solución para cualquier tráder principiante o experto! Este indicador es una herramienta comercial única, de alta calidad y asequible, porque incorpora una serie de características patentadas y una nueva fórmula. Con esta actualización, podrá mostrar zonas de doble marco temporal. No solo podrá mostrar un marco temporal más alto, sino también mostrar ambos, el marco temporal del gráfico MÁS el marco temporal más alto: MOSTRANDO ZONAS ANIDADAS. A todos
¡Actualmente 20% OFF ! ¡La mejor solución para cualquier novato o trader experto! Este software funciona con 28 pares de divisas. Se basa en 2 de nuestros principales indicadores (Advanced Currency Strength 28 y Advanced Currency Impulse). Proporciona una gran visión general de todo el mercado de divisas. Muestra los valores de Advanced Currency Strength, la velocidad de movimiento de las divisas y las señales para 28 pares de divisas en todos los (9) marcos temporales. Imagine cómo mejorar
Legacy of Gann
Pavel Zamoshnikov
4.83 (12)
The indicator very accurately determines the levels of the possible end of the trend and profit fixing. The method of determining levels is based on the ideas of W.D.Gann, using an algorithm developed by his follower Kirill Borovsky. Extremely high reliability of reaching levels (according to K. Borovsky  - 80-90%) Indispensable for any trading strategy – every trader needs to determine the exit point from the market! Precisely determines targets on any timeframes and any instruments (forex, met
FX Volume
Daniel Stein
4.6 (35)
Obtenga su actualización diaria del mercado con detalles y capturas de pantalla a través de nuestro Morning Briefing aquí en mql5 y en Telegram ! FX Volume es el PRIMER y ÚNICO indicador de volumen que proporciona una visión REAL del sentimiento del mercado desde el punto de vista de un bróker. Proporciona una visión impresionante de cómo los participantes institucionales del mercado, como los brokers, están posicionados en el mercado Forex, mucho más rápido que los informes COT. Ver esta info
FX Power MT4 NG
Daniel Stein
5 (11)
Obtenga su actualización diaria del mercado con detalles y capturas de pantalla a través de nuestro Morning Briefing aquí en mql5 y en Telegram ! FX Power MT4 NG es la nueva generación de nuestro popular medidor de fuerza de divisas, FX Power. ¿Y qué ofrece este medidor de fuerza de nueva generación? Todo lo que le encantaba del FX Power original PLUS Análisis de fuerza de ORO/XAU Resultados de cálculo aún más precisos Períodos de análisis configurables individualmente Límite de cálculo persona
Ante todo, vale la pena enfatizar que esta Herramienta de Trading es un Indicador No Repintado, No Redibujado y No Retrasado, lo que la hace ideal para el trading profesional. Curso en línea, manual del usuario y demostración. El Indicador de Conceptos de Acción del Precio Inteligente es una herramienta muy potente tanto para traders nuevos como experimentados. Combina más de 20 indicadores útiles en uno solo, combinando ideas avanzadas de trading como el Análisis del Trader del Círculo Interio
Trend Screener
STE S.S.COMPANY
4.83 (88)
Indicador de tendencia, solución única e innovadora para el comercio y filtrado de tendencias con todas las funciones de tendencias importantes integradas en una sola herramienta. Es un indicador 100% sin repintar de marcos temporales y monedas múltiples que se puede usar en todos los símbolos/instrumentos: divisas, materias primas, criptomonedas, índices y acciones. Trend Screener es un indicador de seguimiento de tendencia eficiente que proporciona señales de tendencia de flecha con puntos en
M1 Arrow
Oleg Rodin
5 (14)
Una estrategia intradía basada en dos principios fundamentales del mercado. El algoritmo se basa en el análisis de volúmenes y ondas de precios utilizando filtros adicionales. El algoritmo inteligente del indicador da una señal solo cuando dos factores de mercado se combinan en uno. El indicador calcula ondas de cierto rango en el gráfico M1 utilizando los datos del marco de tiempo más alto. Y para confirmar la onda, el indicador utiliza el análisis por volumen. Este indicador es un sistema come
TrendMaestro
Stefano Frisetti
5 (3)
note: this indicator is for METATRADER4, if you want the version for METATRADER5 this is the link:  https://www.mql5.com/it/market/product/108106 TRENDMAESTRO ver 2.4 TRENDMAESTRO recognizes a new TREND in the bud, he never makes mistakes. The certainty of identifying a new TREND is priceless. DESCRIPTION TRENDMAESTRO identifies a new TREND in the bud, this indicator examines the volatility, volumes and momentum to identify the moment in which there is an explosion of one or more of these data a
GOLD Impulse with Alert
Bernhard Schweigert
4.56 (9)
Este indicador es una super combinación de nuestros 2 productos Advanced Currency IMPULSE with ALERT  +   Currency Strength Exotics . ¡Funciona para todos los marcos de tiempo y muestra gráficamente el impulso de fuerza o debilidad para las 8 divisas principales más un Símbolo! Este Indicador está especializado en mostrar la aceleración de la fuerza de la divisa para cualquier símbolo como Oro, Pares Exóticos, Materias Primas, Índices o Futuros. Es el primero de su clase, cualquier símbol
TakePropips Donchian Trend Pro
Eric John Pajarillaga Aldana
4.82 (17)
¡TakePropips Donchian Trend Pro   (MT4) es una herramienta poderosa y efectiva que detecta automáticamente la dirección de la tendencia utilizando el Canal Donchian y le proporciona señales comerciales de entrada y salida! Este indicador multifunción incluye un escáner de tendencias, señales comerciales, panel estadístico, filtro, sesiones comerciales y panel de historial de alertas. ¡Está diseñado para proporcionarle señales comerciales y ahorrarle horas analizando los gráficos! Puede descargar
¡Descubra el secreto para el comercio de Forex exitoso con nuestro indicador MT4 personalizado! ¿Alguna vez se ha preguntado cómo lograr el éxito en el mercado de Forex, obteniendo ganancias constantemente al tiempo que minimiza el riesgo? ¡Aquí está la respuesta que ha estado buscando! Permítanos presentar nuestro indicador MT4 patentado que revolucionará su enfoque para el comercio. Versatilidad única Nuestro indicador está especialmente diseñado para usuarios que prefieren las formacio
El sistema PRO Renko es un sistema de trading de alta precisión especialmente diseñado para operar gráficos RENKO. Se trata de un sistema universal que se puede aplicar a diversos instrumentos de negociación. El sistema neutraliza eficazmente el llamado ruido de mercado, lo que le brinda acceso a señales de reversión precisas. El indicador es muy fácil de usar y solo tiene un parámetro responsable de la generación de señales. Puede adaptar fácilmente la herramienta a cualquier instrumento com
ACTUALMENTE 31% DE DESCUENTO Este indicador es una herramienta de transacción única, de alta calidad y asequible porque hemos incorporado una serie de características propias y una fórmula secreta. Con solo un gráfico, da Alertas para los 28 pares de divisas. ¡Imagina cómo mejorarás porque puedes identificar el punto de activación exacto de una nueva tendencia u oportunidad de crecimiento! Basado en nuevos algoritmos subyacentes , hace que sea aún más fácil identificar y confirmar operaciones po
Introduciendo       Indicador Quantum Trend Sniper   , el innovador indicador MQL5 que está transformando la forma en que identificas y negocias los cambios de tendencia. Desarrollado por un equipo de comerciantes experimentados con experiencia comercial de más de 13 años,       Indicador de francotirador de tendencia cuántica       está diseñado para impulsar su viaje comercial a nuevas alturas con su forma innovadora de identificar cambios de tendencia con una precisión extremadamente alta.
Por supuesto, aquí tienes la traducción al español: Presentamos el Indicador de Astronomía para MT4: Tu Compañero Celestial Definitivo en el Trading ¿Estás listo para elevar tu experiencia de trading a alturas celestiales? No busques más allá de nuestro revolucionario Indicador de Astronomía para MT4. Esta innovadora herramienta trasciende los indicadores de trading tradicionales, aprovechando el poder de algoritmos complejos para proporcionarte una visión astronómica sin igual y cálculos de pre
Currency Strength Exotics
Bernhard Schweigert
4.88 (33)
¡ACTUALMENTE 20% DE DESCUENTO ! ¡La mejor solución para cualquier operador novato o experto! Este indicador está especializado en mostrar la fuerza de la divisa para cualquier símbolo como Pares Exóticos, Materias Primas, Índices o Futuros. Es el primero de su clase, cualquier símbolo se puede añadir a la 9 ª línea para mostrar la verdadera fuerza de la moneda de Oro, Plata, Petróleo, DAX, US30, MXN, TRY, CNH etc. Se trata de una herramienta de trading única, de alta calidad y asequible por
Currency Strength Wizard es un indicador muy poderoso que le proporciona una solución todo en uno para operar con éxito. El indicador calcula el poder de este o aquel par de divisas utilizando los datos de todas las monedas en múltiples marcos de tiempo. Estos datos se representan en forma de índice de moneda fácil de usar y líneas eléctricas de moneda que puede usar para ver el poder de esta o aquella moneda. Todo lo que necesita es adjuntar el indicador al gráfico que desea operar y el indicad
ICT, SMC, SMART MONEY CONCEPTS, SMART MONEY, Smart Money Concept, Support and Resistance, Trend Analysis, Price Action, Market Structure, Order Blocks, BOS/CHoCH,   Breaker Blocks ,  Momentum Shift,   Supply&Demand Zone/Order Blocks , Strong Imbalance, HH/LL/HL/LH,    Fair Value Gap, FVG,  Premium  &   Discount   Zones, Fibonacci Retracement, OTE, Buy Side Liquidity, Sell Side Liquidity, BSL/SSL Taken, Equal Highs & Lows, MTF Dashboard, Multiple Time Frame, BigBar, HTF OB, HTF Market Structure, 
ECM Channel MT4
Paulo Rocha
5 (1)
ECM Elite Channel is a volatility-based indicator, developed with a specific time algorithm, which consists of finding possible corrections in the market. This indicator shows two outer lines, an inner line (retracement line) and an arrow sign, where the channel theory is to help identify overbought and oversold conditions in the market. The market price will generally fall between the boundaries of the channel. If prices touch or move outside the channel, it's a trading opportunity. The
Otros productos de este autor
MFI Signal AM
Andriy Matviyevs'kyy
5 (3)
This indicator displays the signals based on the values of the classic Money Flow Index (MFI) indicator on the price chart. The volume is considered during the calculation of the MFI values. The MFI can be used for determining the overbought or oversold areas on the chart. Reaching these levels means that the market can soon turn around, but it does not give signal, as in a strong trend the market can stay in the overbought or oversold state for quite a long time. As with most oscillators, the s
FREE
ADX Line AM
Andriy Matviyevs'kyy
4.67 (3)
The indicator analyzes ADX and ATR data to define the current trend and allow traders to gain maximum profit from strong price movements. The indicator is intuitively clear: line direction change - trend direction change. Change of the line color warns of a coming direction change. Extended version of this indicator - Line on Osc . Customized parameters: Ind_Period (>1) - ADX calculation period; Sensitivity (>1) - ATR sensitivity. Alerts - show a dialog box containing user data; Send_Mail - send
FREE
ADX Signal AM
Andriy Matviyevs'kyy
4.75 (4)
The indicator is an interpretation of the Average Directional Movement Index (ADX) allowing you to determine if there is a price trend. It was developed by Welles Wilder and described in his book "New concepts in technical trading systems". The indicator shows signals on the price chart when +DI и -DI intersect and when an ADX value rises or falls relative to the +DI и -DI positional relationship. The indicator's buy signals work just like a support level, while the sell signals work like a resi
FREE
SuperTrend AM
Andriy Matviyevs'kyy
5 (1)
SuperTrend AM is an indicator that allows you to open a position at the very beginning of a significant price movement. The second most important quality of the indicator is the ability to follow the trend as long as possible in order to obtain all potential profits while minimizing potential losses. This indicator does not repaint or not recalculate. A version of this indicator with advanced settings and signal notifications is  SuperTrend 3 AM . Signal of the indicator: red arrow appearing a
FREE
ADX Trigger AM
Andriy Matviyevs'kyy
5 (1)
The indicator is an interpretation of the Average Directional Movement Index (ADX) allowing you to determine if there is a price trend. It was developed by Welles Wilder and described in his book "New concepts in technical trading systems". The indicator determines entry points and uses crossing of ADX +/- lines and growth or fall of the main ADX line. When the indicator crosses the zero line, the trend is changed. If the oscillator's value is 1 - the price grows, the trend remains; If the oscil
FREE
CCI Signal AM
Andriy Matviyevs'kyy
This indicator displays the signals based on the values of the classic CCI indicator on the price chart. The CCI can be used for determining the overbought or oversold areas on the chart. Reaching these levels means that the market can soon turn around, but it does not give signal, as in a strong trend the market can stay in the overbought or oversold state for quite a long time. As with most oscillators, the signals are generated when leaving these areas. This indicator allows to display three
FREE
FATL cci AM
Andriy Matviyevs'kyy
The product combines the best features of the standard CCI oscillator with the adaptive digital filter. The indicator allows entering and exiting the market at the very beginning and end of a trend. The indicator generates high-probability signals while retaining high sensitivity. The indicator does not repaint on fully formed bars. Options: Ind_Price - price used for the indicator calculation; Ind_Period - indicator period. Application rules: A big red dot - a strong bearish trend, if the price
FREE
ADX Candles AM
Andriy Matviyevs'kyy
This indicator colors candles in accordance with the projected price movement. The analysis is based on the values of the classic ADX. If the DMI+ line is above the DMI- line - the candlestick is painted in color that signals a price growth; If the DMI+ line is below the DMI- line - the candlestick is painted in color that signals a price fall. The indicator does not redraw on completed candlesticks. The forming candlestick can change its color depending on the current data. Thus, it is recommen
FREE
Step RSI AM
Andriy Matviyevs'kyy
5 (2)
This indicator is an interpretation of the values of the classic indicator - RSI. A filter is used to smooth the sharp fluctuations of the indicator values, eliminating the weak changes and focusing the trader's attention on strong fluctuations of values. The indicator is not redrawn on completed bars. For greater efficiency of this indicator, it should be used in conjunction with the indicators that identify the trend direction, as well as support/resistance levels. Signals: Histogram crossing
FREE
EasyTrend AM
Andriy Matviyevs'kyy
5 (1)
EasyTrend AM is an indicator that allows you to open a position at the very beginning of a significant price movement. The second most important quality of the indicator is the ability to follow the trend as long as possible in order to obtain all potential profits while minimizing potential losses. This indicator does not repaint or not recalculate. A version of this indicator with advanced settings and signal notifications is EasyTrend 3 AM . Signal of the indicator: red arrow appearing abov
FREE
Zone Trade AM
Andriy Matviyevs'kyy
The indicator is based on the elements of Bill Williams' trading system. Sell signals are formed when MACD and OsMA values are falling simultaneously (Bill Williams calls these indicators АО and АС in his book), while buy signals appear when both indicators are rising. Thick and thin colored histograms match MACD and OsMA values. If the histogram is greater than 0, the indicator value is rising. Otherwise, it is falling. Positions should be opened when the price exceeds the bar's high or low, at
FREE
FATL Momentum AM
Andriy Matviyevs'kyy
This technical indicator is a Momentum indicators built using a fast adaptive digital filter - FATL. In a simplified sense, an adaptive digital filter is a moving average with effective smoothing. Using a digital filter allows you to smooth out sharp fluctuations with minimal signal delay. Using the indicator: It should be taken into account that the values ​​of the indicator on the zero bar (which has not finished forming yet) may change, so decisions should be made after the end of the bar for
FREE
HyperSignal AM
Andriy Matviyevs'kyy
The  indicator generates signals for opening positions. The principle of operation is to compare the current average price with a range of average prices over a longer period. The signals are confirmed when the price exceeds the High/Low of the bar where the indicator generated the signal.  Maintenance of an open position is carried out on a smaller TF. Indicator signals to open an opposite position on a smaller TF are a signal to close the deal. This indicator does not repaint or not recalculat
FREE
WPR Signal AM
Andriy Matviyevs'kyy
This indicator displays the signals based on the values of the classic WPR indicator. The WPR indicator can be used for determining the overbought or oversold areas on the chart. Reaching these levels means that the market can soon turn around, but it does not give signal, as in a strong trend the market can stay in the overbought or oversold state for quite a long time. As with most oscillators, the signals are generated when leaving these areas. This indicator allows to display three types of
FREE
RSI Signal AM
Andriy Matviyevs'kyy
This indicator displays the signals based on the values of the classic RSI indicator on the price chart. The RSI can be used for determining the overbought or oversold areas on the chart. Reaching these levels means that the market can soon turn around, but it does not give signal, as in a strong trend the market can stay in the overbought or oversold state for quite a long time. As with most oscillators, the signals are generated when leaving these areas. This indicator allows to display three
FREE
Impulsive Trade AM
Andriy Matviyevs'kyy
This indicator displays elements of the trading system described by Alexander Elder. This indicator uses the idea of opening sell deals in the period of MACD (or OsMA) falling below zero and opening buy deals when the indicator values rise above zero, in case this fall or rise coincide with the Moving Average direction. The thick and thin histograms correspond to the values of MACD and OsMA. If a histogram is above 0, the indicator value is greater than 0. If it is below, the indicator value is
FREE
DeM Signal AM
Andriy Matviyevs'kyy
This indicator displays the moment when the DeMarker oscillator crosses its smoothed value. If the DeMarker oscillator crosses its smoothed value, it is a signal of a trend change. The signal is given after the end of the formation of the candle. The signal is confirmed when the price crosses the high/low of the bar on which the signal was given. The indicator does not redraw. Custom Parameters: DeM_Period (>1) - DeMarker indicator period; MA_Period - period for smoothing DeMarker indicator va
FREE
TTF Candles AM
Andriy Matviyevs'kyy
5 (1)
This indicator displays the moment when the TTF oscillator crosses the zero value, and the moment when the TTF oscillator crosses its smoothed value. Crossing the zero value by the TTF oscillator is a buy/sell signal. If the TTF oscillator crosses its smoothed value, it is a signal of a trend change. The signal is given after the end of the formation of the candle. The signal is confirmed when the price crosses the high/low of the bar on which the signal was given. The indicator does not redraw.
FREE
ZT Signal AM
Andriy Matviyevs'kyy
The indicator displays elements of the trading system, name trading in the zone, described by Bill Williams. Sell signals are formed when MACD and OsMA values are falling simultaneously (Bill Williams calls these indicators АО and АС in his book), while buy signals appear when both indicators are rising. The indicator has no configurable parameters. (Indicator variant in which MACD and OsMA parameters can be changed - ZT Signal 2 AM ). The indicator signals are confirmed when the price exceeds t
FREE
Laguerre Osc 2 AM
Andriy Matviyevs'kyy
The presented indicator uses the Laguerre filter to build an oscillator. The indicator has the possibility of double additional smoothing, which can be useful for small values ​​of the Gamma parameter. The indicator gives three types of signals: Exit of the oscillator from the overbought / oversold zone; The oscillator crossing the middle of the value between the overbought/oversold zones; The oscillator enters the overbought/oversold zone. On fully formed candles, the indicator does not redraw.
FREE
BarLineBreak AM
Andriy Matviyevs'kyy
4 (1)
The indicator detects the current trend using the following definition: A trend is a market situation when each subsequent peak is higher/lower than the previous one, as well as each subsequent bottom is higher/lower than the previous one. Exceeding all previous peaks/bottoms on the specified amount of bars by the current peak/bottom is considered to be a beginning of a new trend. The indicator paints bars according to an identified trend. The indicator does not repaint. Settings: Lines_Bre
FREE
Stop Bar AM
Andriy Matviyevs'kyy
The indicator accurately identifies a short-term trend both on trend and flat markets. The confirmation of the signal is the overcoming by the price of the high/low of the bar on which the signal was given. Signals are given on fully formed bars and are not redrawn. Calculations are based on the system of Moving Averages. The indicator is highly sensitive. Use it together with other technical analysis indicators. Settings: Sensitivity - amount of bars for the indicator calculation (1 or higher
FREE
TTF Line AM
Andriy Matviyevs'kyy
The indicator analyzes TTF and ATR data to define the current trend and allow traders to gain maximum profit from strong price movements. The indicator is intuitively clear: line direction change - trend direction change. Change of the line color warns of a coming direction change. Customized parameters: Ind_Period (>1) - TTF calculation period; Sensitivity (>1) - ATR sensitivity. Alerts - show a dialog box containing user data; Send_Mail - sends an email using an address specified on the Em
FREE
FATL Line AM
Andriy Matviyevs'kyy
The presented indicator is a moving average based on the fast digital filter (FATL) data. Using the indicator is similar to using a standard moving average: For small values ​​of the period of the moving average (1-10): Buying/selling is carried out at the moment of changing the direction of the moving average (after the price has overcome the high/low of the bar on which the change of direction occurred). For large values ​​of the period of the moving average: Buying / selling is carried out de
FREE
TTF Osc AM
Andriy Matviyevs'kyy
This indicator displays the moment when the TTF oscillator crosses the zero value, and the moment when the TTF oscillator crosses its smoothed value. Crossing the zero value by the TTF oscillator is a buy/sell signal. If the TTF oscillator crosses its smoothed value, it is a signal of a trend change. The signal is given after the end of the formation of the candle. The signal is confirmed when the price crosses the high/low of the bar on which the signal was given. The indicator does not redraw.
FREE
FATL Alligator AM
Andriy Matviyevs'kyy
This indicator is a combination of classic trend indicator and signals of the fast digital filter. The indicator has no configurable parameters. The signals are displayed on completed bars and are not redrawn. It shows high efficiency on periods greater than 1 hour. The usage principle is intuitive - trade in the direction shown by the fan of moving averages. Enter once the price exceeds the High/Low of the bar where the signal was formed. Exit on the opposite conditions.
FREE
SATL Alligator AM
Andriy Matviyevs'kyy
This indicator is a combination of classic trend indicator and signals of the slow digital filter. The indicator has no configurable parameters. The signals are displayed on completed bars and are not redrawn. It shows high efficiency on periods less than 1 hour. The usage principle is intuitive - trade in the direction shown by the fan of moving averages. Enter once the price exceeds the High/Low of the bar where the signal was formed. Exit on the opposite conditions.
FREE
FATL Arrows AM
Andriy Matviyevs'kyy
This indicator generates signals when the close price values ​​go beyond the channel built using the FATL fast digital filter. Application is extremely simple: The up arrow is a buy signal. Down arrow - sell signal. The signal must be confirmed by the price breaking the high/low of the bar on which the signal was given. The indicator is effective for trend trading. Thus, to open a position, it is necessary to take into account the trend of a higher period. Signals against the trend of a higher p
RSX Signal AM
Andriy Matviyevs'kyy
The indicator displays the signals of the RSX oscillator. The main type of signal is given when the oscillator exceeds the 0 value. If the "Sensitivity" parameter increases above zero, the main signal will also be given when overbought/oversold levels are overcome, defined as zero plus sensitivity and zero minus sensitivity. An additional signal is given when the direction of the oscillator line changes. It is optimal to use the indicator signals as signals to open a trade when the price overcom
Fine Trade AM
Andriy Matviyevs'kyy
5 (1)
Not all price changes can be used for trading, as small price fluctuations do not allow you to make a profit. The presented indicator with high efficiency gives signals about the moments of a significant change in the direction of price movement. The indicator is intuitive and easy to use. The indicator signal is generated after the completion of the bar, where the indicator changes its position relative to zero. Never repaints signal. The indicator signals must be confirmed by the price exceedi
Filtro:
No hay comentarios
Respuesta al comentario
Versión 26.3 2023.11.30
Updated.
Versión 26.2 2023.10.31
Updated.
Versión 26.1 2023.10.27
Updated.