ASPCT Boom Crash Pandora
- Indicadores
- Petr Zharuk
- Versión: 2.1
- Actualizado: 16 julio 2024
- Activaciones: 20
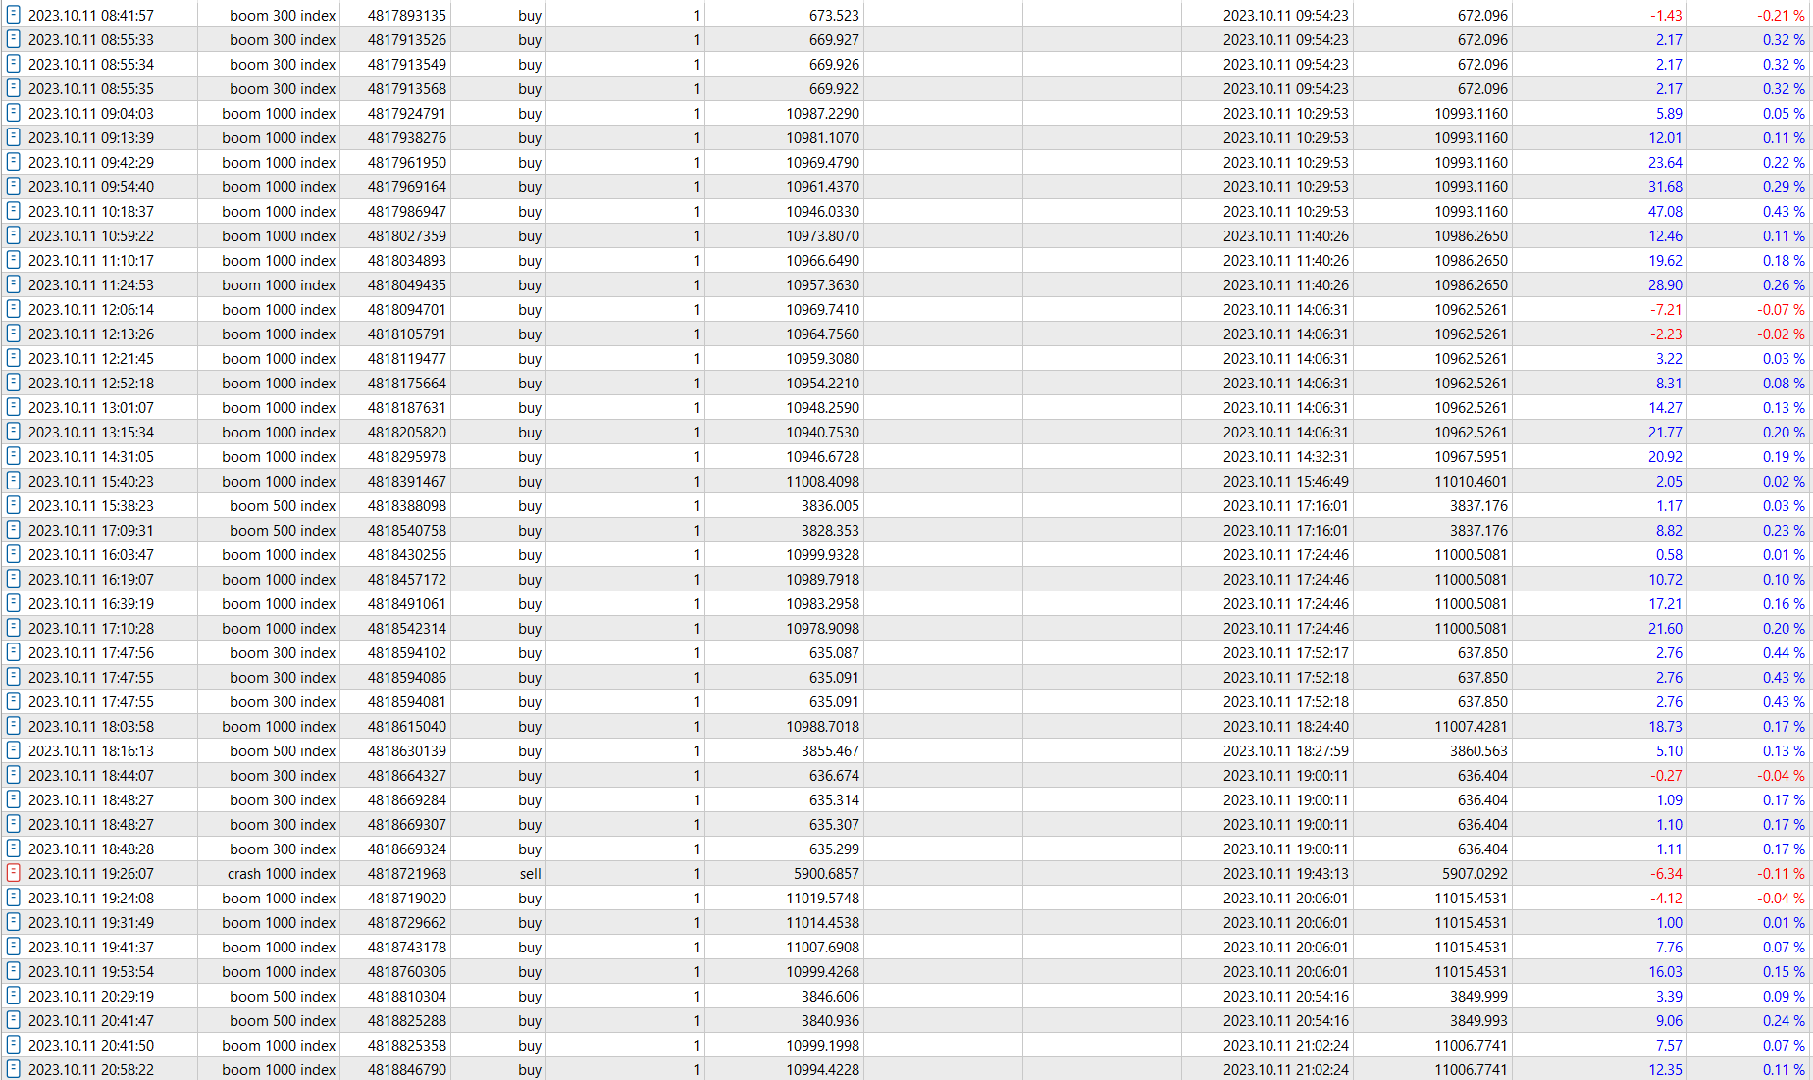
Scalping Tool for Deriv
Description: This trading indicator is designed for traders specializing in scalping. It provides signals for trading in the direction of short-term price movements. The indicator is optimized for use on the M1 timeframe and supports Boom and Crash indices (300, 500, 1000).
The indicator will be sold in a limited quantity.
Features:
- Trading direction: towards short-term price movements.
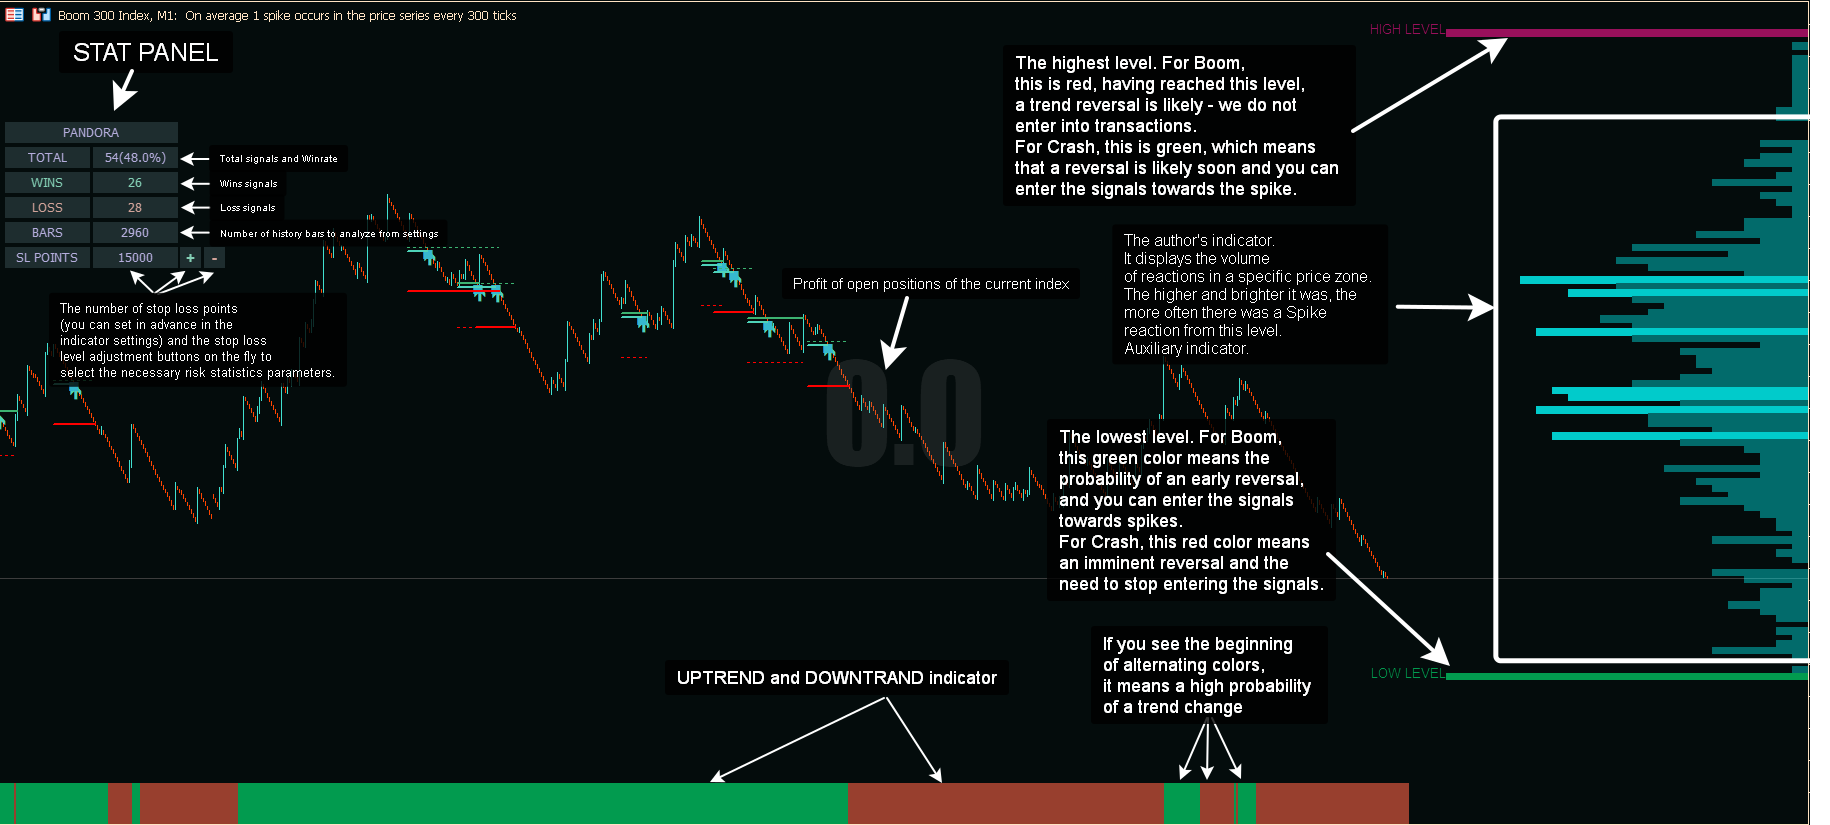
- Filters and indicators:
- Reaction volume indicator: displays activity zones.
- Trend indicator: analyzes price movement direction.
- Maximum and minimum price levels: for evaluating potential entry points.
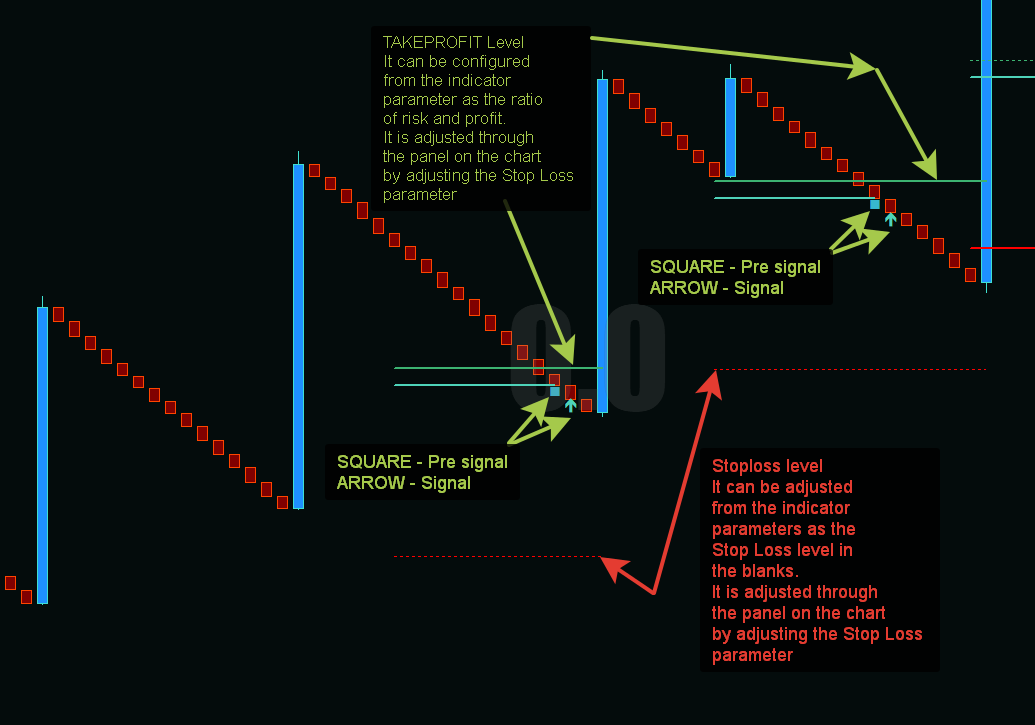
- Alert system:
- Preliminary notification before the signal.
- Entry point indication on the next candle.
- Risk management:
- Display of recommended stop-loss levels.
- Trading recommendations:
- Ability to adjust stop-loss parameters.
- Option to use a grid of orders.
- Control panel:
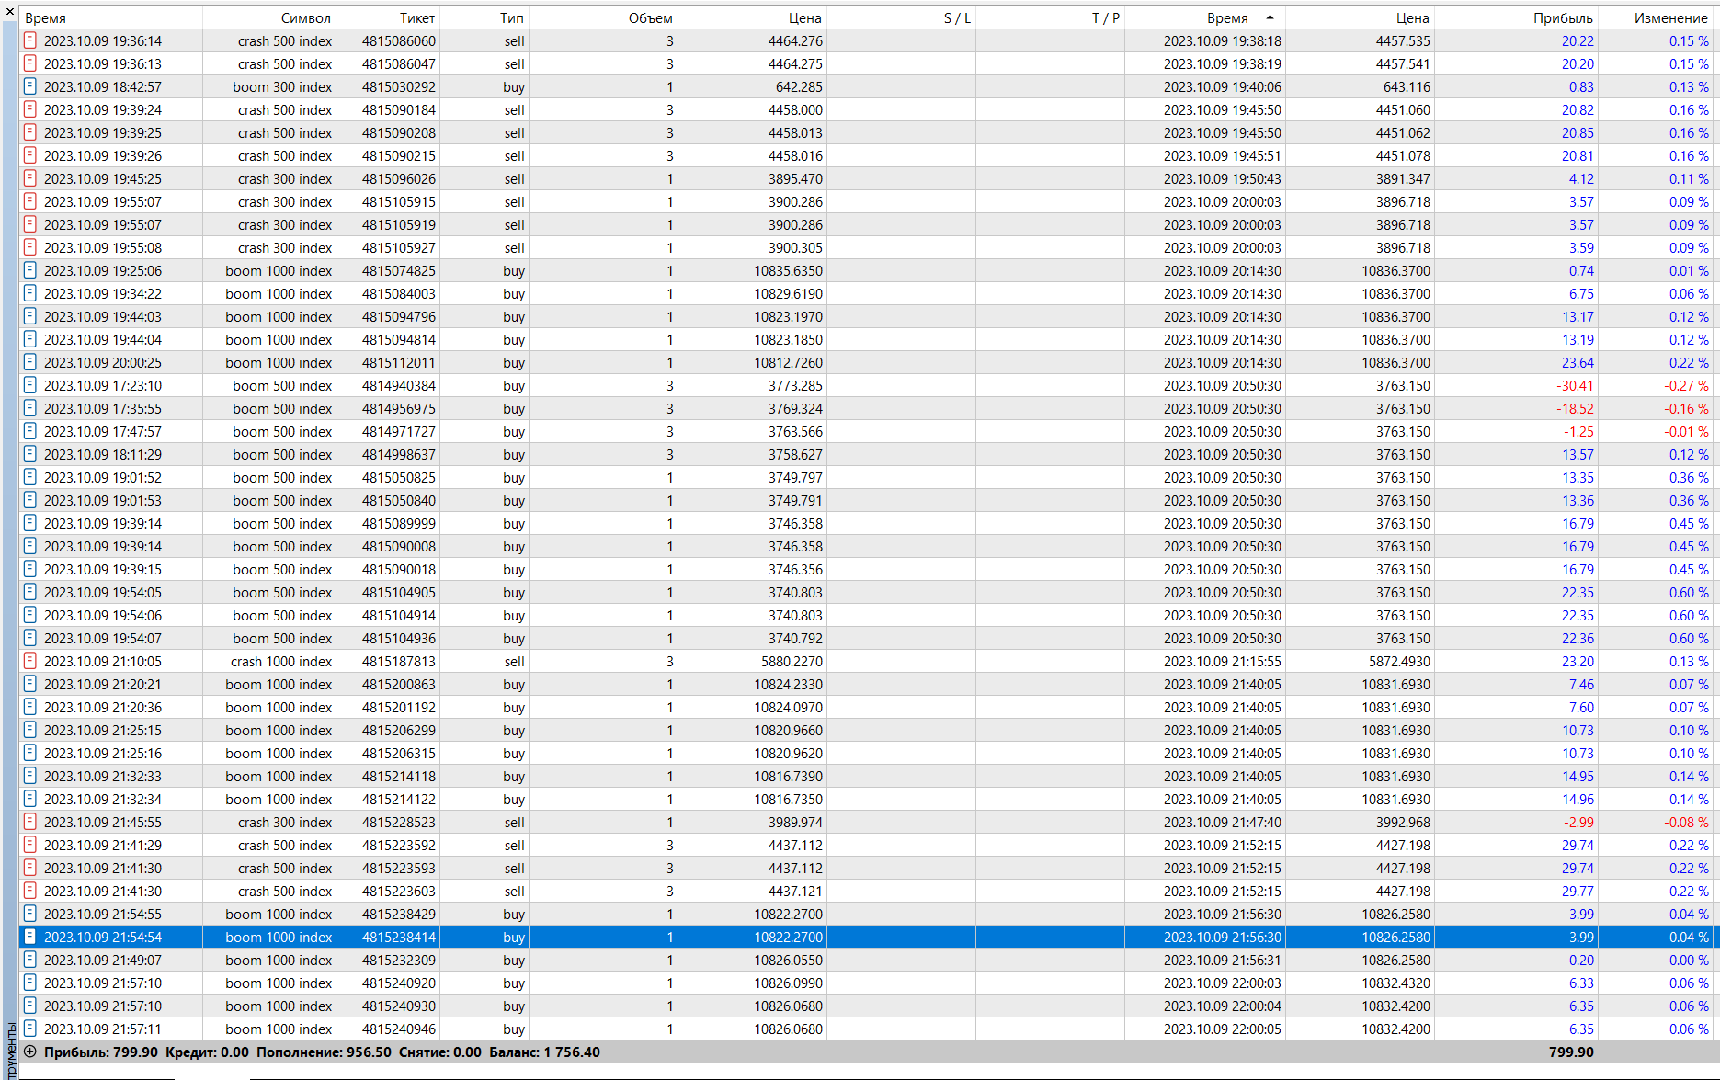
- Statistics for the selected period.
- Tracking of market entries, successful and unsuccessful trades.
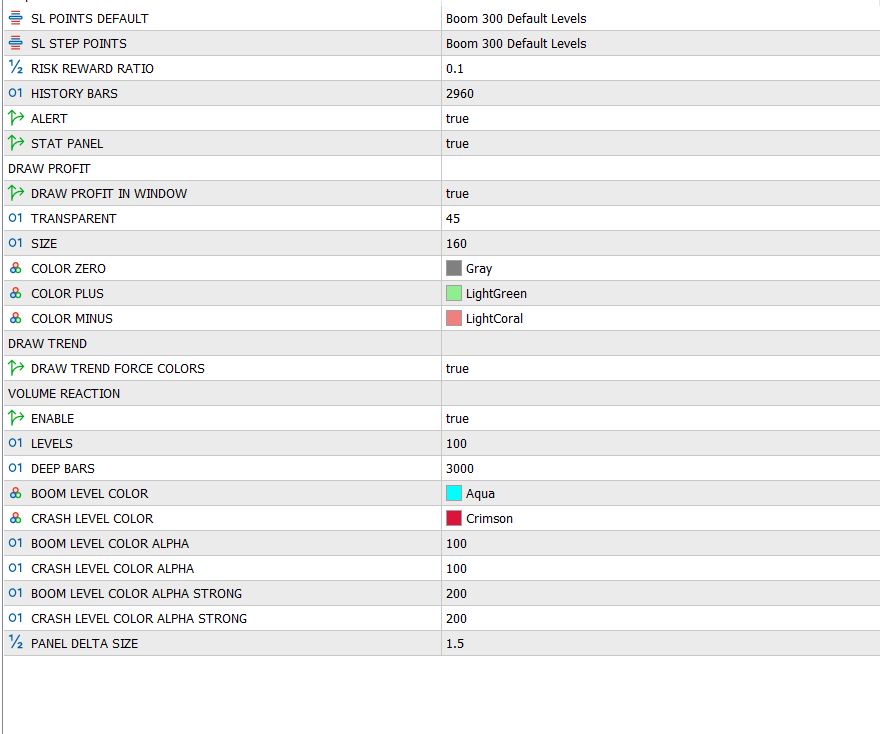
- Stop-loss parameter settings.
- Risk-to-potential profit ratio adjustment.
- Statistics:
- Tracking of profit target and stop-loss achievements.
- Management:
- Ability to adjust the stop-loss multiplier.
Operating principle: The indicator displays a preliminary signal and entry point on the next candle. Additional indicators provide information for deeper market situation analysis.
Important notes:
- Changing stop-loss parameters can significantly affect trading results.
- It is recommended to adjust stop-loss parameters before starting to use the indicator.
Risk warning: It is strongly recommended to test this product in a strategy tester before purchasing and using it on a real account. Trading in financial markets involves the risk of losing invested funds.
Conclusion: This tool can be useful for traders interested in scalping. It is important to remember the necessity of thorough testing and proper risk management when using any trading tools.


As described, easy to use and very complete