Flag Pattern Scanner MT4
- Indicadores
- Elif Kaya
- Versión: 2.26
- Actualizado: 6 marzo 2025
- Activaciones: 20
- Lifetime update free
- Real price is 80$ - 40% Discount (It is 49$ now)
Contact me for instruction, any questions!
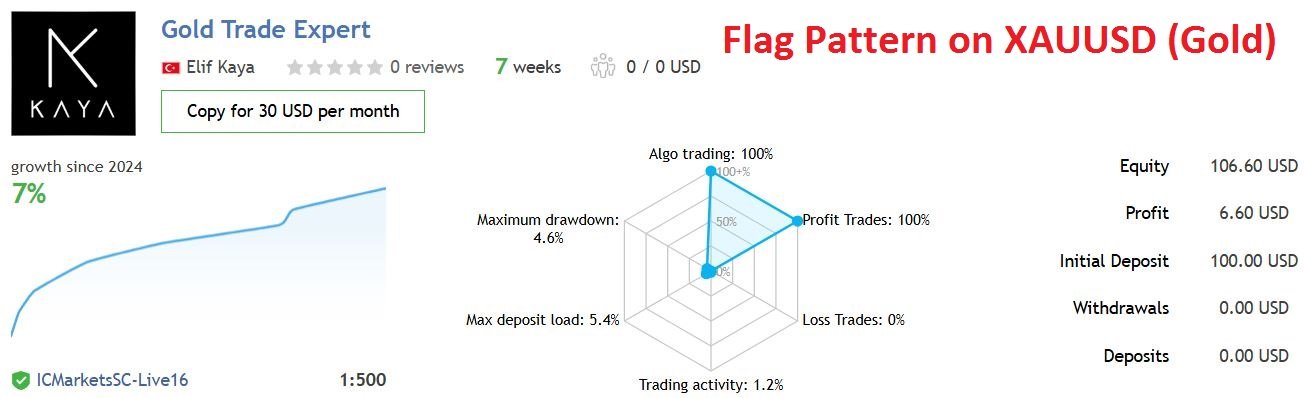
Related Product: Gold Expert , Professor EA
- Non-repaint
Introduction
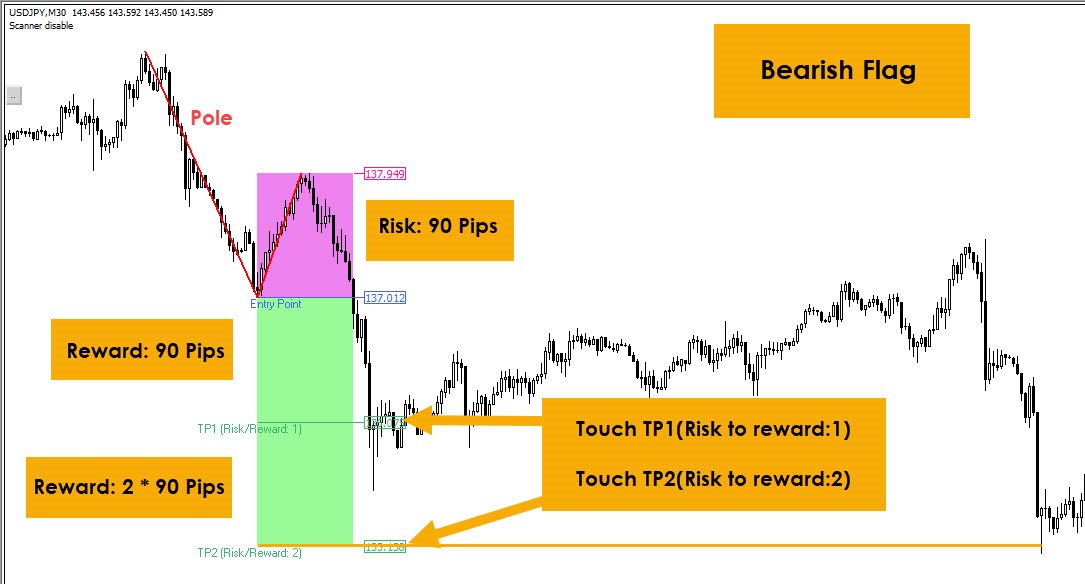
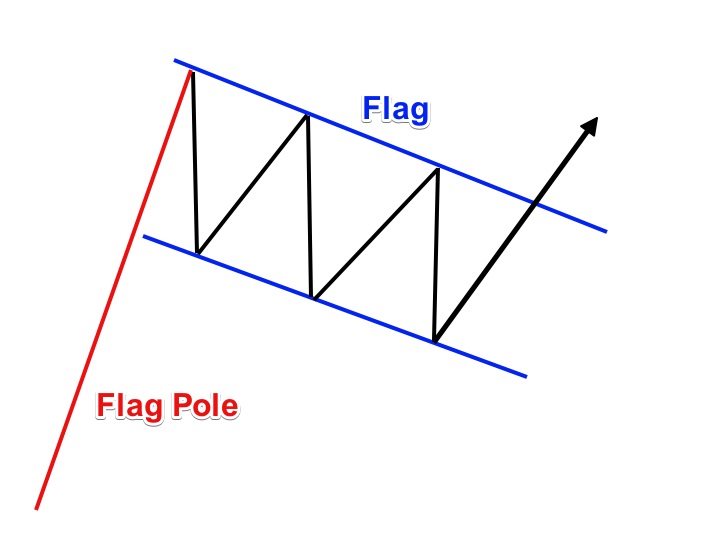
Flag patterns are an important tool for technical traders in the stock market. When interpreting a flag pattern, it is important to wait for the pattern to pick a direction before entering a trade, as flags are generally considered to be a period of consolidation where the price of a security is caught in a range after a sharp move. It is essential to note that flags can occur in both bullish and bearish markets and can appear in various shapes, as mentioned previously. Therefore, it is crucial to analyze the pattern’s direction, shape, and volume before making a trading decision based on a flag pattern.
A flag can be used as an entry pattern for the continuation of an established trend. The formation usually occurs after a strong trending move. The pattern usually forms at the midpoint of a full swing and shows the start of moving. Bullish flags can form after an uptrend, bearish flags can form after a downtrend.
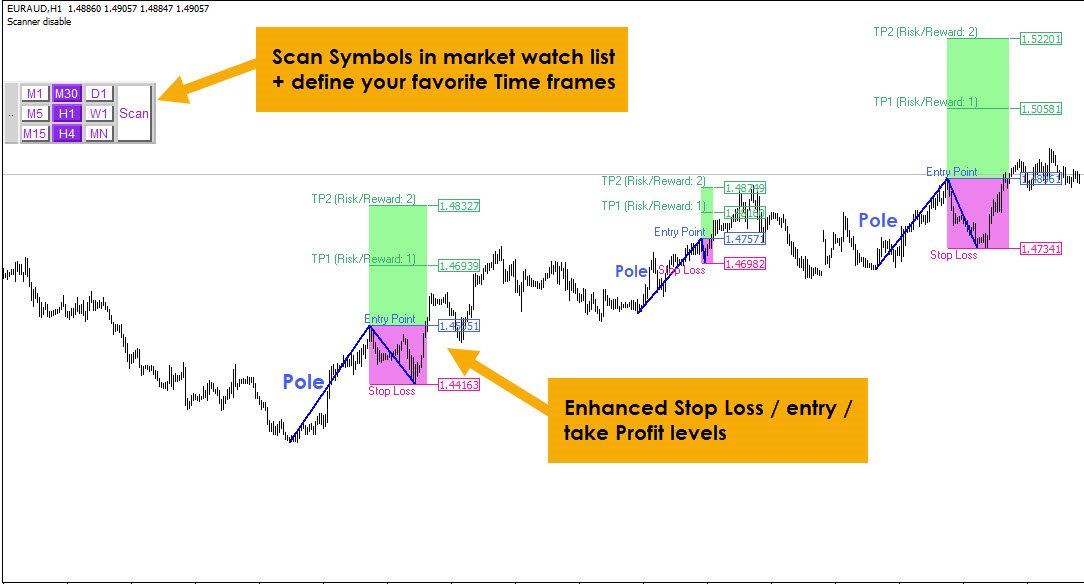
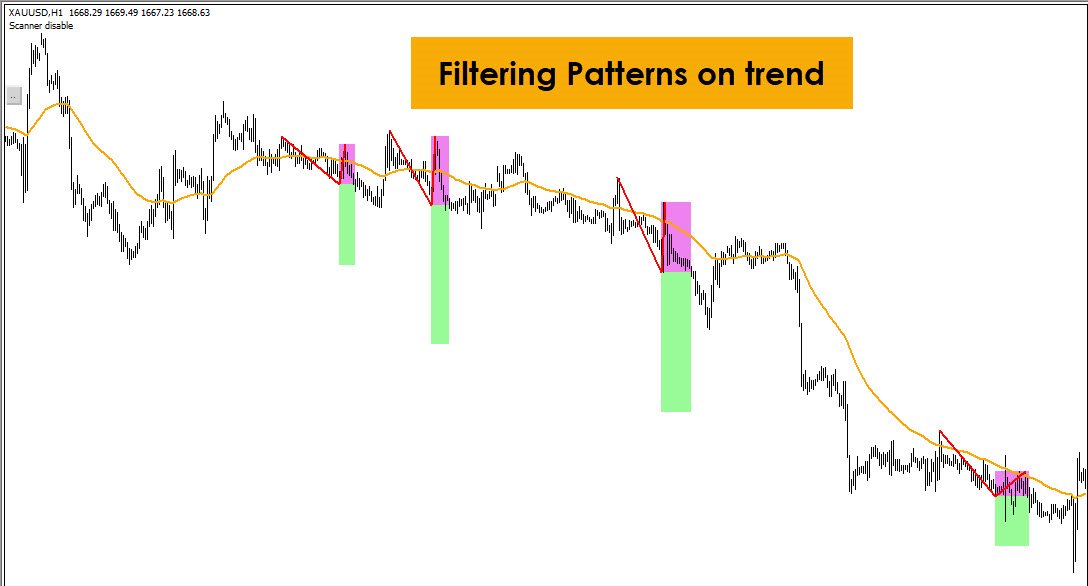
Flag Pattern Scanner Indicator
Scan, Fibonacci calculations and pattern recognition are completely done by Flag Pattern Scanner indicator; All you do is "press the scan button". It sends alert and push notification on your mobile.
How To Work


I like this scanner. Very good