MQLuxe B1
- Asesores Expertos
- Mohammad Farokhzad
- Versión: 1.2
- Actualizado: 9 octubre 2023
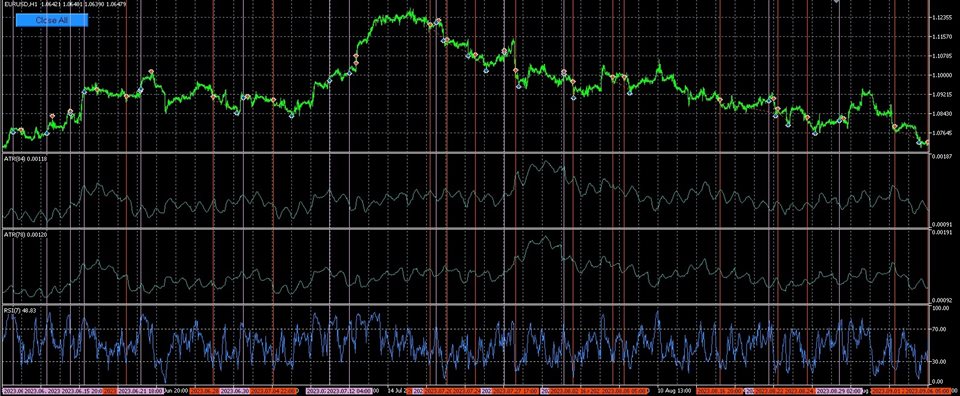
*** ATR --------------------------------- RSI ***
MQLuxe B1 is a special MT5 Robot that is a fully automated trading system that doesn't require any special skills from you. Just fire up this EA and rest. You don't need to set up anything, EA will do everything for you. EA is adapted to work on small deposits.
Combining the Average True Range (ATR) indicator with the Relative Strength Index (RSI) can create a robust trading strategy in the Forex market. This combination can help you identify potential trend reversals or confirm existing trends. Here's a basic strategy that combines these two indicators:
Indicators:
-
Average True Range (ATR): This indicator measures market volatility. It tells you how much an asset typically moves within a given time frame.
-
Relative Strength Index (RSI): This oscillator measures the speed and change of price movements. It oscillates between 0 and 100, with values above 70 indicating overbought conditions and values below 30 indicating oversold conditions.
Strategy: The strategy involves identifying potential trend reversals or trend confirmation by using both the ATR and RSI indicators.
Trend Confirmation:
- When the ATR is rising, it suggests an increase in volatility, which can be an indicator of a strengthening trend.
- Use the RSI to confirm the trend direction. For an uptrend, the RSI should be above 50, and for a downtrend, the RSI should be below 50.
- Enter a trade in the direction of the trend when both conditions are met.
Trend Reversal:
- Look for a high ATR value, indicating a spike in volatility.
- Check the RSI for overbought (RSI > 70) or oversold (RSI < 30) conditions.
- If the ATR is high and the RSI is overbought, consider entering a short position (betting on a potential reversal from overbought).
- If the ATR is high and the RSI is oversold, consider entering a long position (betting on a potential reversal from oversold).
Exit Strategies:
- Use a trailing stop or a fixed stop-loss to manage risk and protect your capital.
- Consider taking profits when the ATR starts to decline, indicating reduced volatility, or when the RSI signals potential overbought/oversold conditions in the opposite direction.
Risk Management:
- Proper risk management is crucial. Only risk a small percentage of your trading capital on each trade.
- Adjust the position size based on the distance between your entry point and stop-loss level, taking into account the ATR.
Remember that no strategy is foolproof, and you should backtest and demo trade this strategy extensively before using it with real money. Additionally, keep an eye on fundamental and news events that can impact the Forex market, as these can override technical signals.
Set up an adviser according to the instructions !!!
Important information :
- please read this pages and see the youtube videos.
- For the first 2 weeks, trade on a demo account or a cent account (to choose the best trading conditions for yourself)
- Install a trading advisor on a VPS
Recommended pairs for trading EURUSD
Recommended Timeframe H1
Recommended SafetyLevel : 10
Input Parameters
- Safety level : 1-10
This part is so important because less Safety Level equal more Profit with more risk
This part is so important because more Safety Level equal less Profit with less risk
This parameters is important and you can see the results in this pages test's Pictures. I test in two time frame M5, H1 and tree safety level 1, 5, 10
PROFITABILITY AND RISK
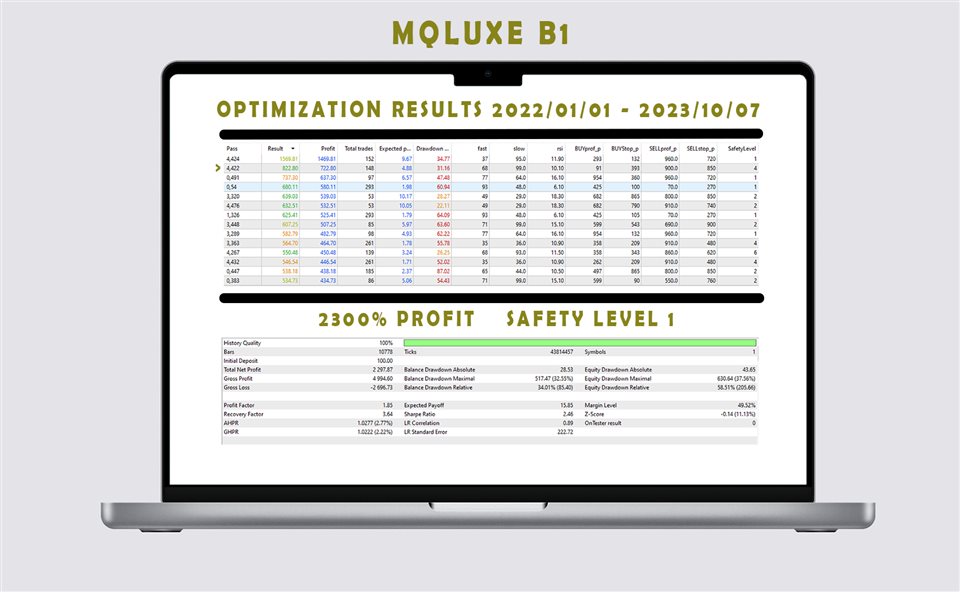
-Optimization result of 01.01.2023 - 07.10.2023
- The expected estimated profitability according to the last 10 month in EURUSD backtest data is about 1000%
Results of optimization in 1H Time frame:
| Pass | Result | Profit | Expected Payoff | Profit Factor | Recovery Factor | Sharpe Ratio | Custom | EquityDD % | Trades | fast | slow | rsi | Buy_lot | stop loss pips | BUYprof_p | Sell_lot | stop loss pips | SELLprof_p | |
| 6239 | 1330.25 | 1230.25 | 9.39122 | 2.21866 | 5.73811 | 3.05124 | 0 | 29.59 | 131 | 200.2 | 165.2 | 6.8 | 0.031 | 165 | 395 | 0.099 | 470 | 455 | |
| 5831 | 1304.74 | 1204.74 | 15.24987 | 2.65400 | 5.53725 | 3.98529 | 0 | 32.56 | 79 | 37 | 122 | 9.2 | 0.099 | 155 | 400 | 0.099 | 465 | 430 | |
| 6225 | 1299.66 | 1199.66 | 11.99660 | 2.42984 | 4.97021 | 4.74644 | 0 | 38.55 | 100 | 37 | 122 | 7.6 | 0.06 | 160 | 380 | 0.1 | 475 | 415 | |
| 6395 | 1299.24 | 1199.24 | 13.17846 | 2.40799 | 6.52328 | 3.17843 | 0 | 32.93 | 91 | 37 | 122 | 8.4 | 0.099 | 155 | 400 | 0.1 | 480 | 415 | |
| 6194 | 1297.76 | 1197.76 | 11.97760 | 2.18393 | 4.99921 | 4.91469 | 0 | 34.11 | 100 | 37 | 122 | 7.6 | 0.099 | 155 | 465 | 0.09 | 485 | 425 | |
| 5553 | 1257.73 | 1157.73 | 13.94855 | 2.37258 | 5.85037 | 3.67421 | 0 | 14.63 | 83 | 139 | 122 | 7.6 | 0.097 | 205 | 455 | 0.09 | 465 | 400 | |
| 6398 | 1127.06 | 1027.06 | 12.22691 | 2.17911 | 7.96171 | 3.73152 | 0 | 11.47 | 84 | 84.6 | 78.8 | 7.6 | 0.099 | 155 | 465 | 0.098 | 470 | 375 | |
Set up an adviser according to the instructions !!!







































Hi, Firstly, thanks for giving away this product. It looks good but I have yet to test it as my broker has server off. Looking at your test results which you claim is 1000%, over 10months, 100 trades. Is that number correct? Thats like 1 trade in 3 days. The guy in the comment section had different results as you posted and he followed the settings. Also can you please include the safety level in the test for the settings. I have also downloaded the C1, cant wait to test it also. All of it have similar levels of profit factor. Its hard to differentiate. please advise. thanks