Grape Pullback
- Indicadores
- Arlos Elias Rivas Romero
- Versión: 1.0
- Activaciones: 5
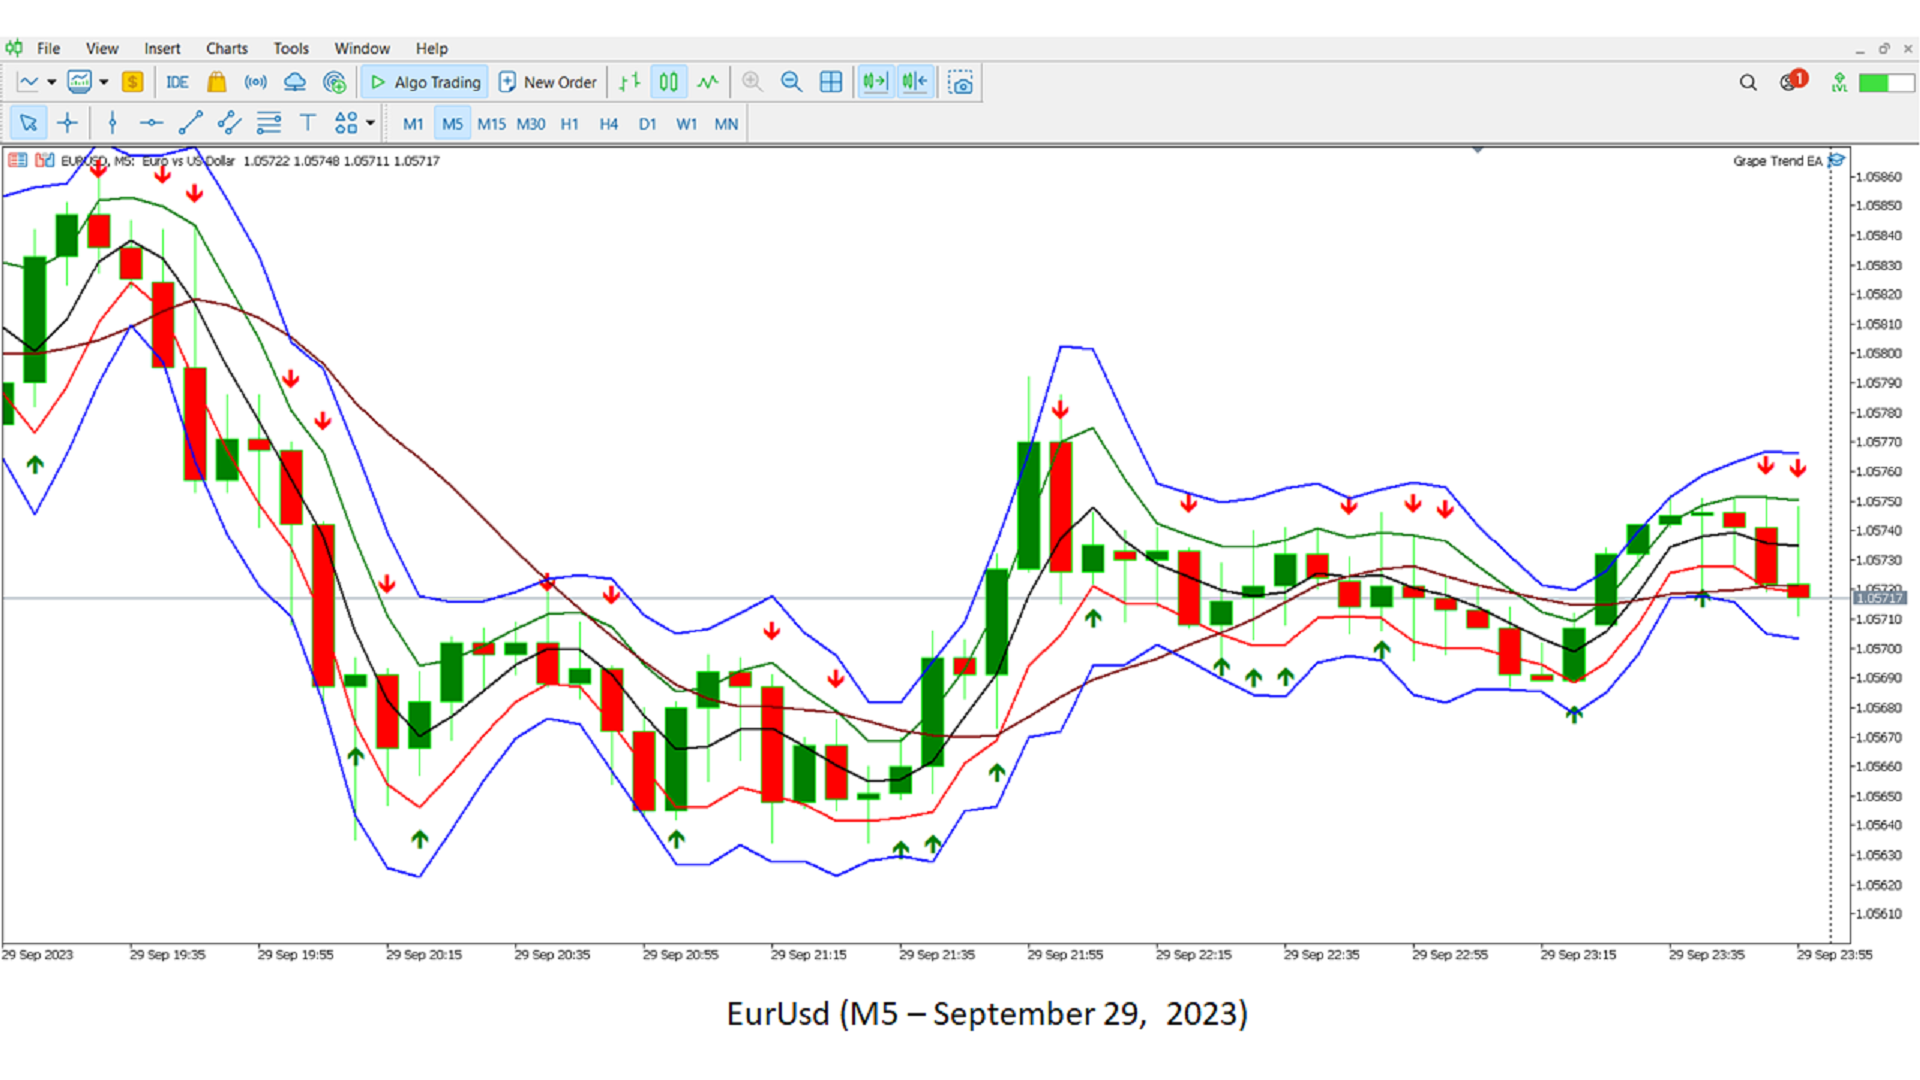
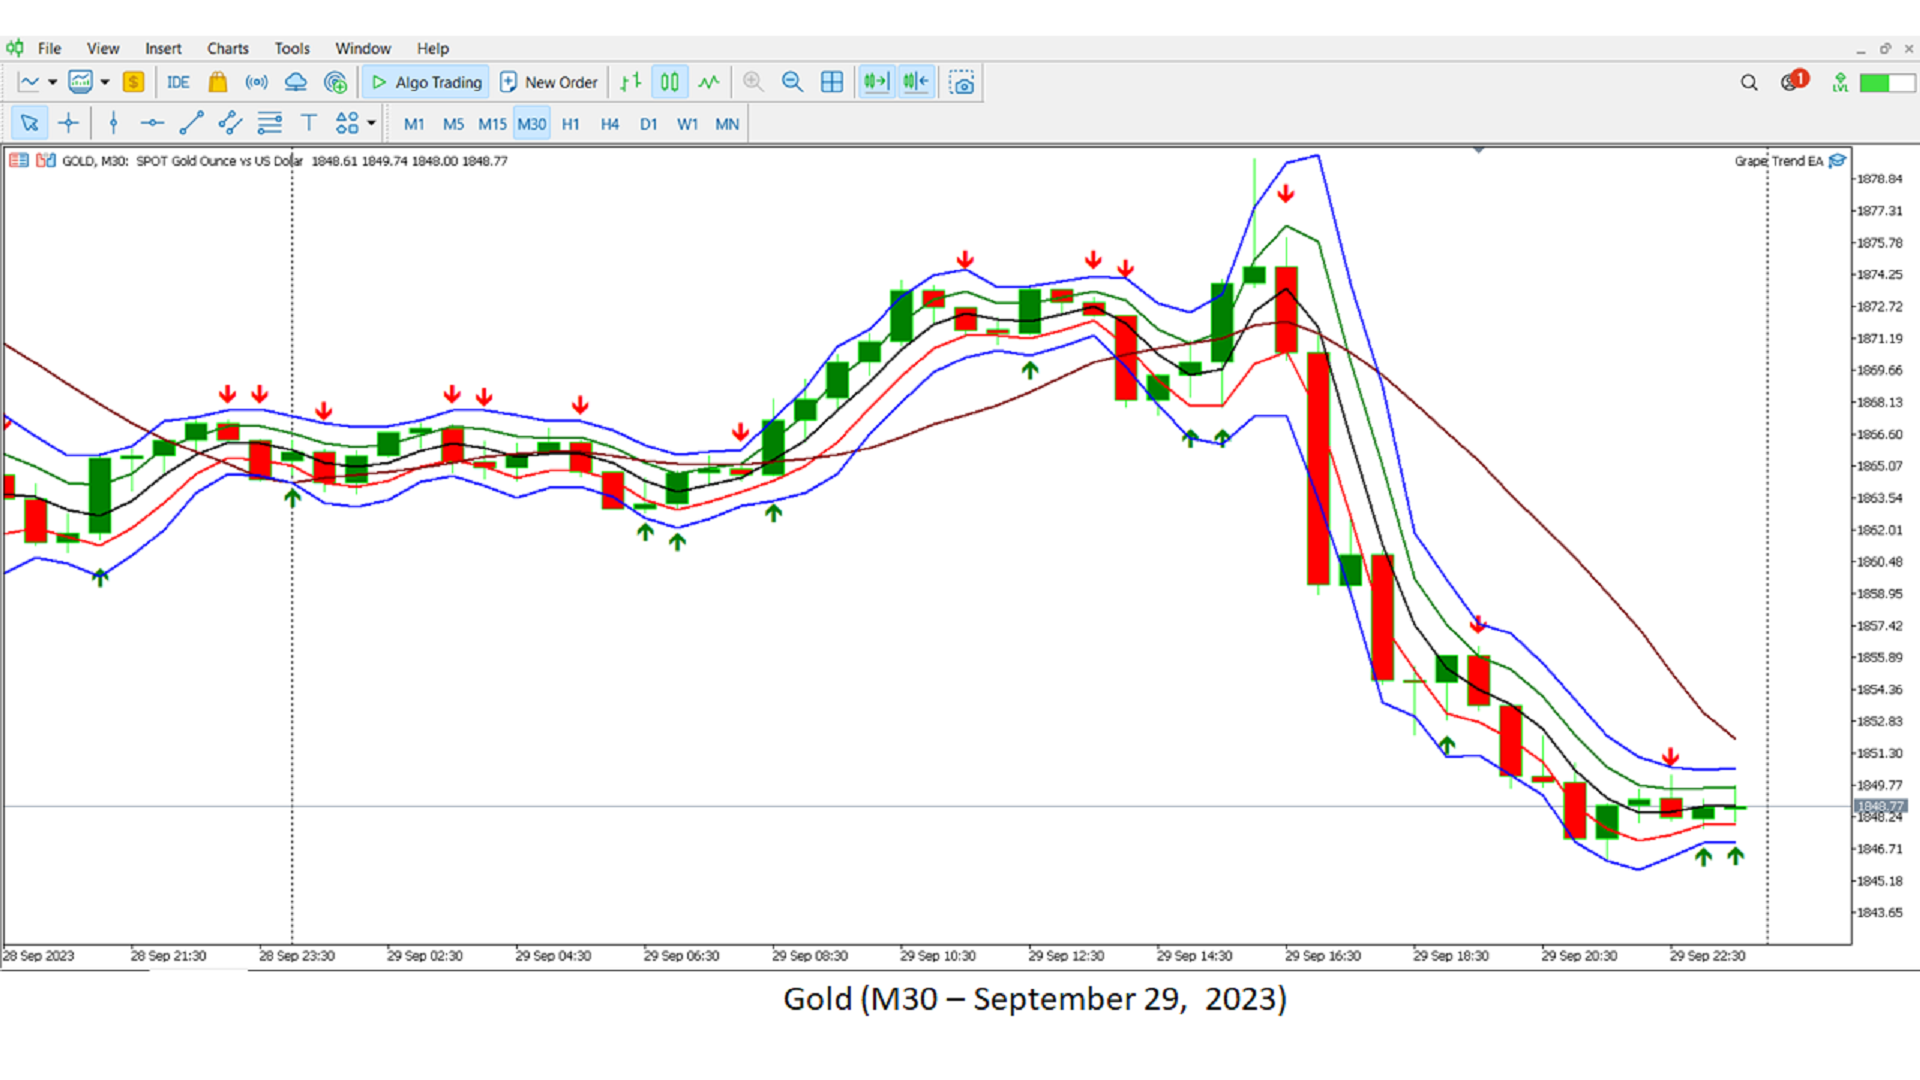
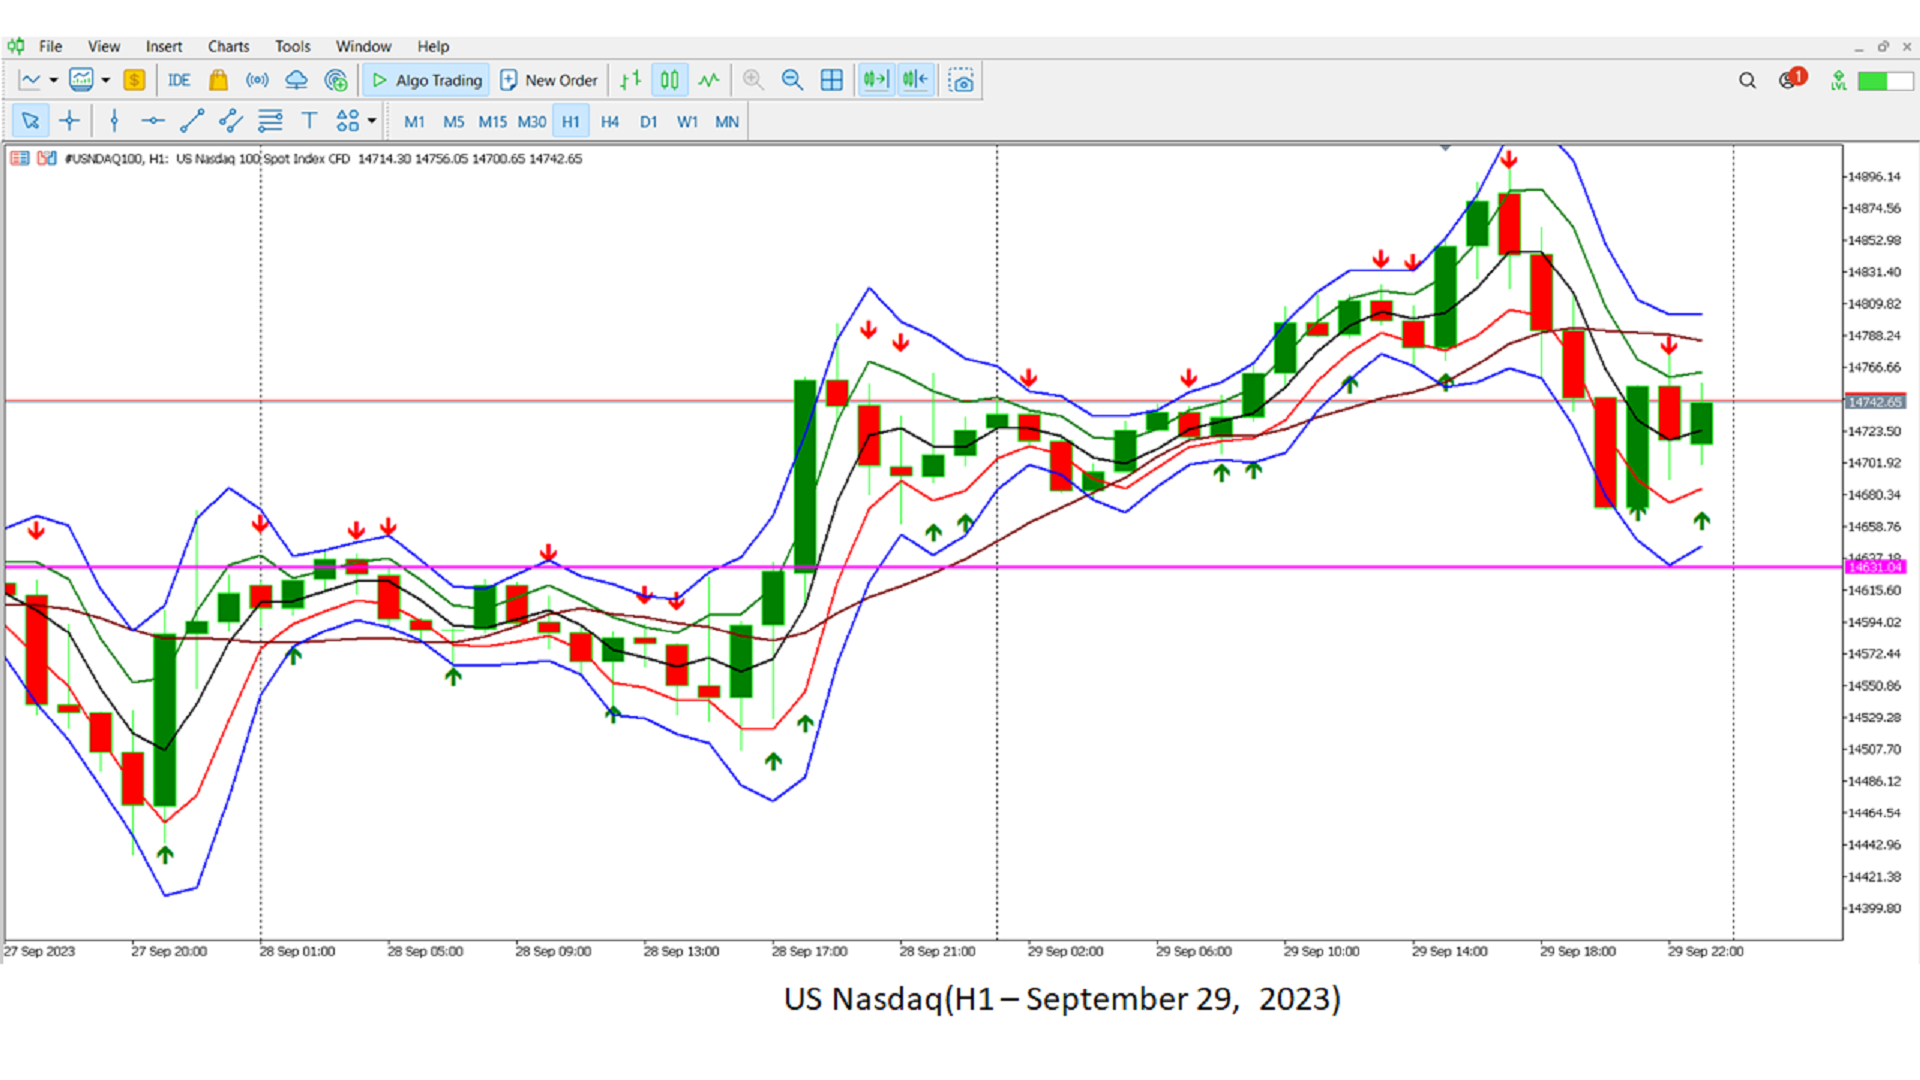
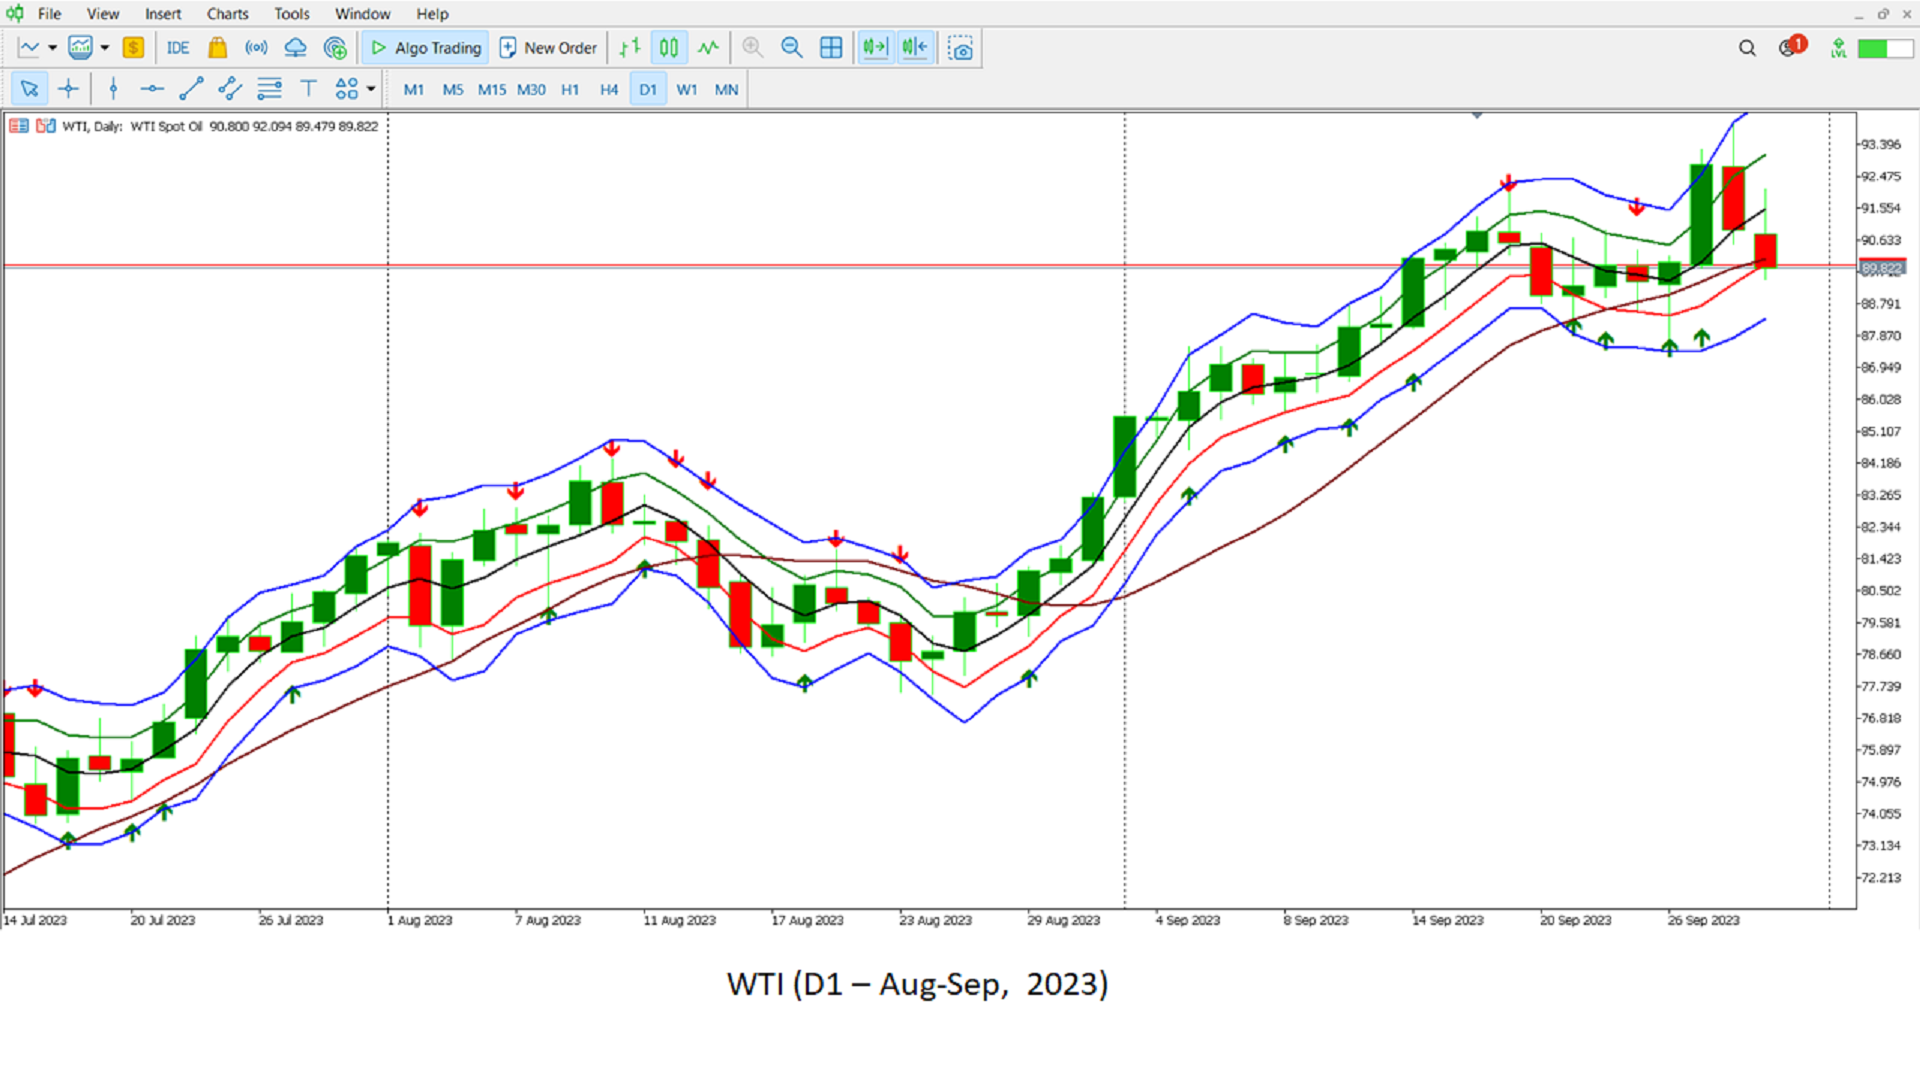
Indicador (flecha) Tipo Estrategia (Pullback) para todos los símbolos y periodicidad, preferiblemente a partir de 30M periodicidad. Se puede utilizar para el comercio manual.
El indicador está determinado por estrategias que se basan en criterios para la ubicación de velas en el canal y para los indicadores Rsi y Market facilitation index.
Su espacio de trabajo corresponde al canal de 3 barras de Bill Willians con una extensión de canal.
COMPRAR cuando hay una flecha verde. StopLoss debajo de la línea inferior del canal interno
VENDER cuando hay una flecha roja. StopLoss por encima de la línea superior del canal interno
CIERRE la posición en el límite exterior (línea azul) del canal extendido o cuando la línea media (línea negra) cambie de dirección.