• Información general
  • Comentarios (1)
  • Discusión

The Reversal Strategy

5
¡Descubra la mejor estrategia comercial de reversión!


Presentamos un poderoso indicador que desbloquea el arte de identificar reversiones en cada sesión de negociación. ¡Diga adiós a las conjeturas y hola a la precisión!


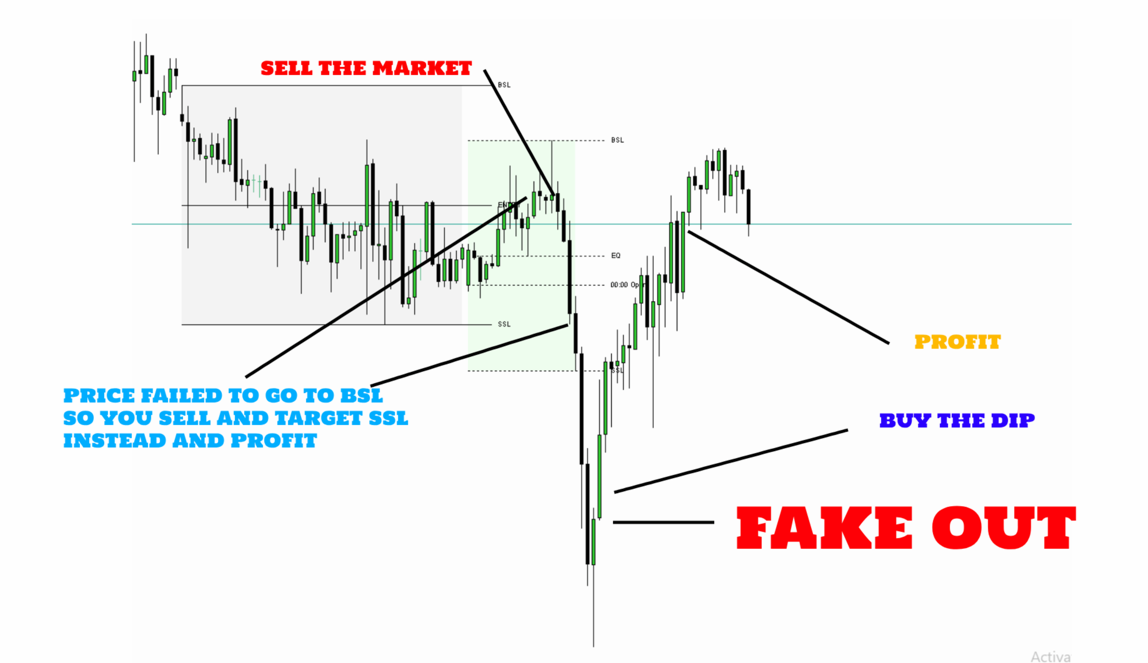
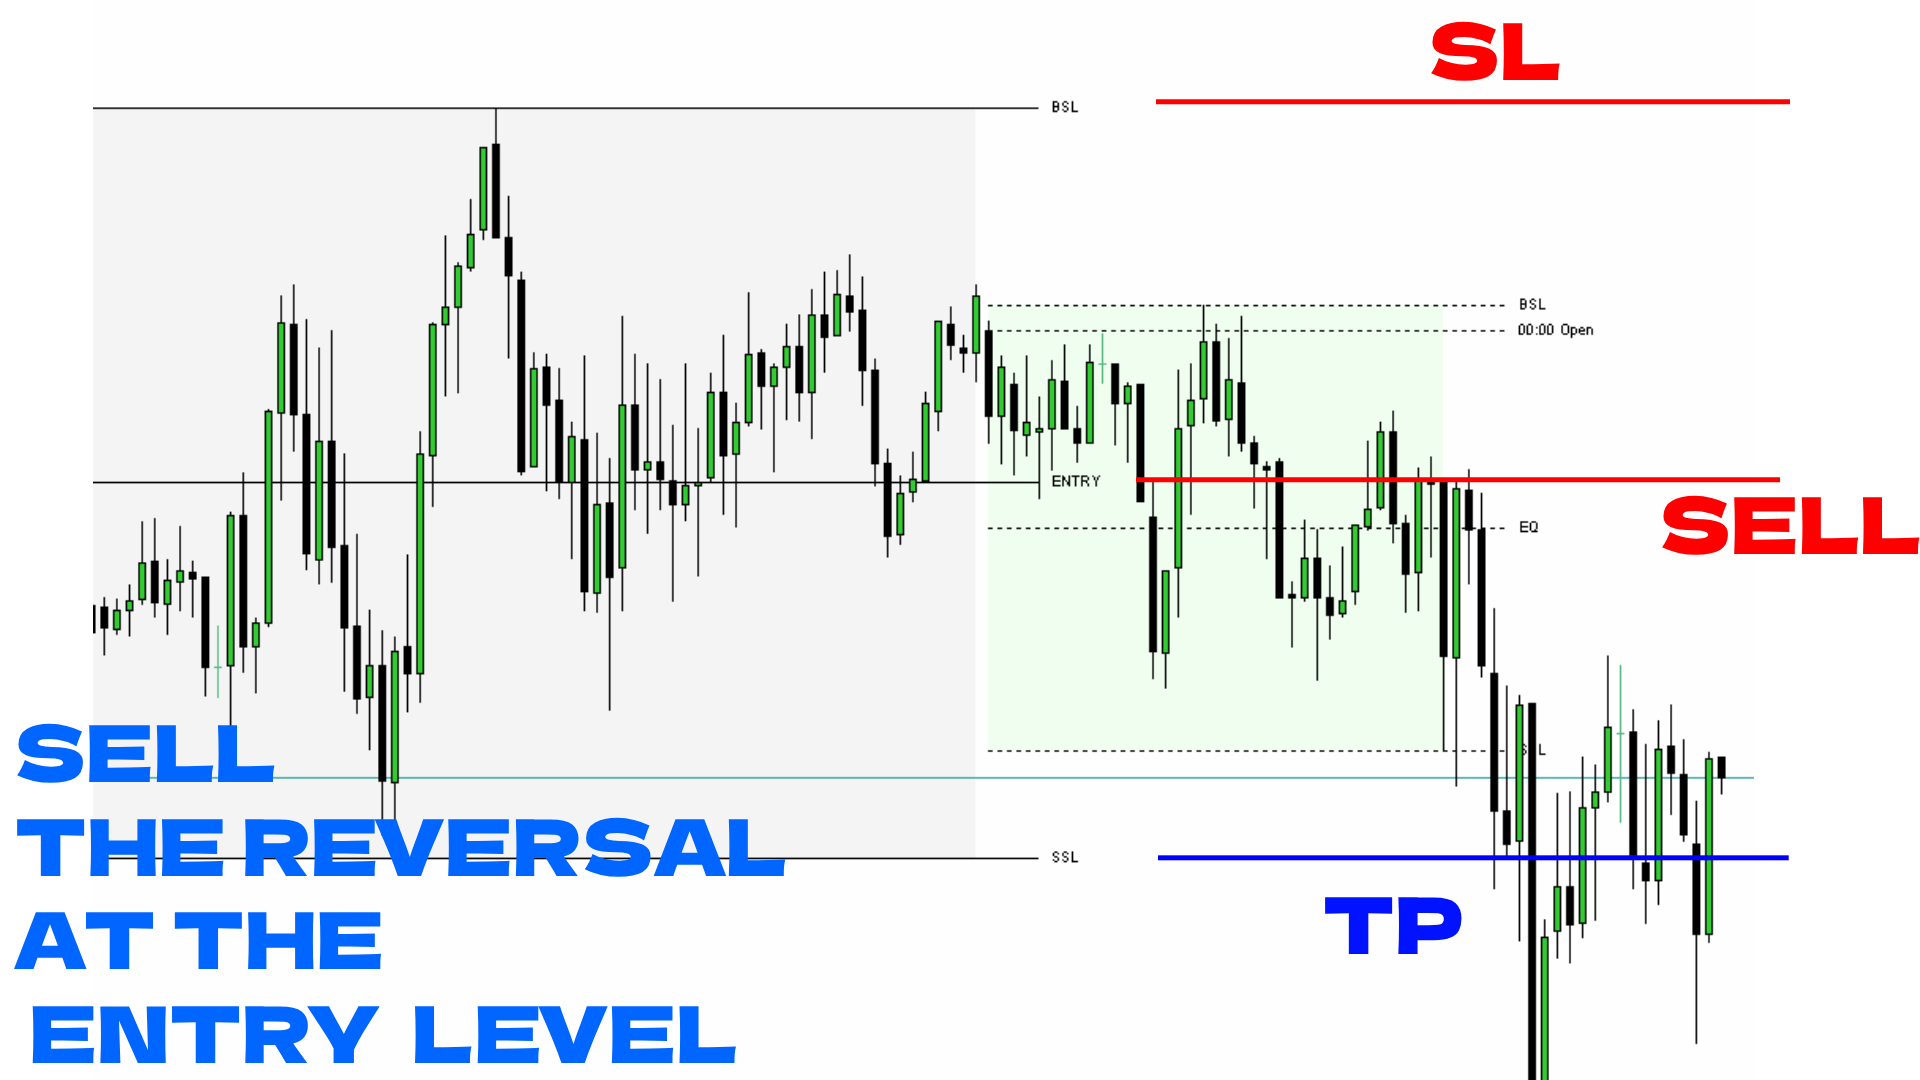
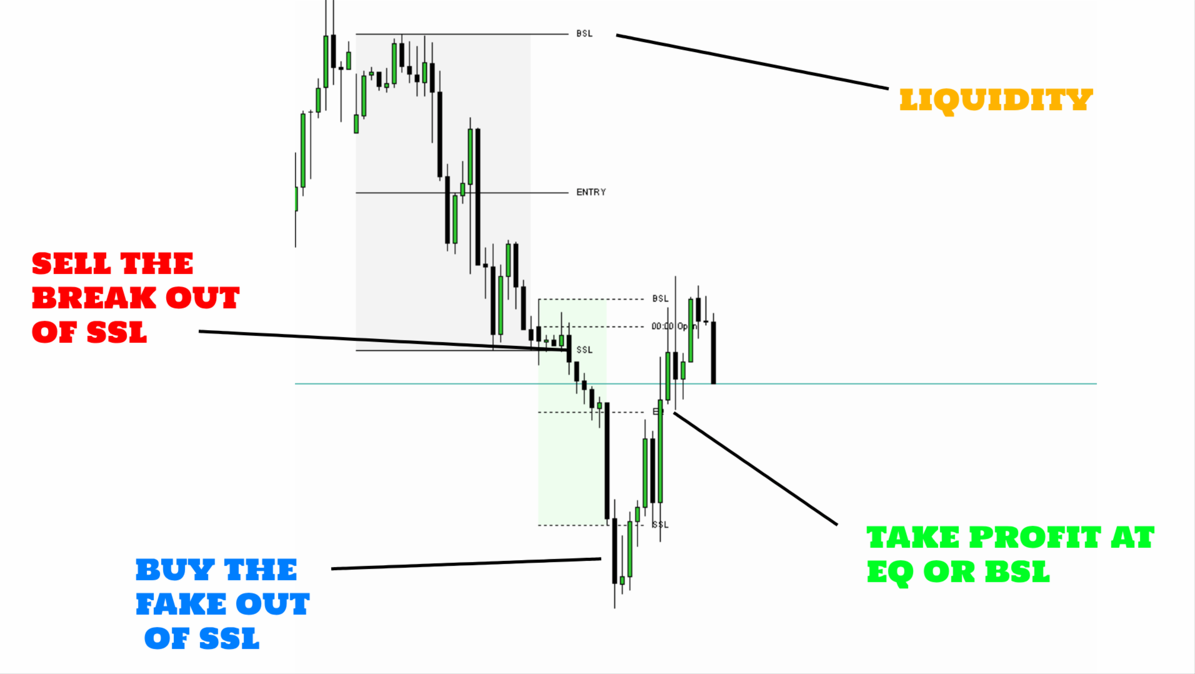
Nuestro indicador mapea meticulosamente tanto la liquidez del lado de compra (BSL) como la liquidez del lado de venta (SSL), brindándole el conocimiento para tomar decisiones de salida informadas.


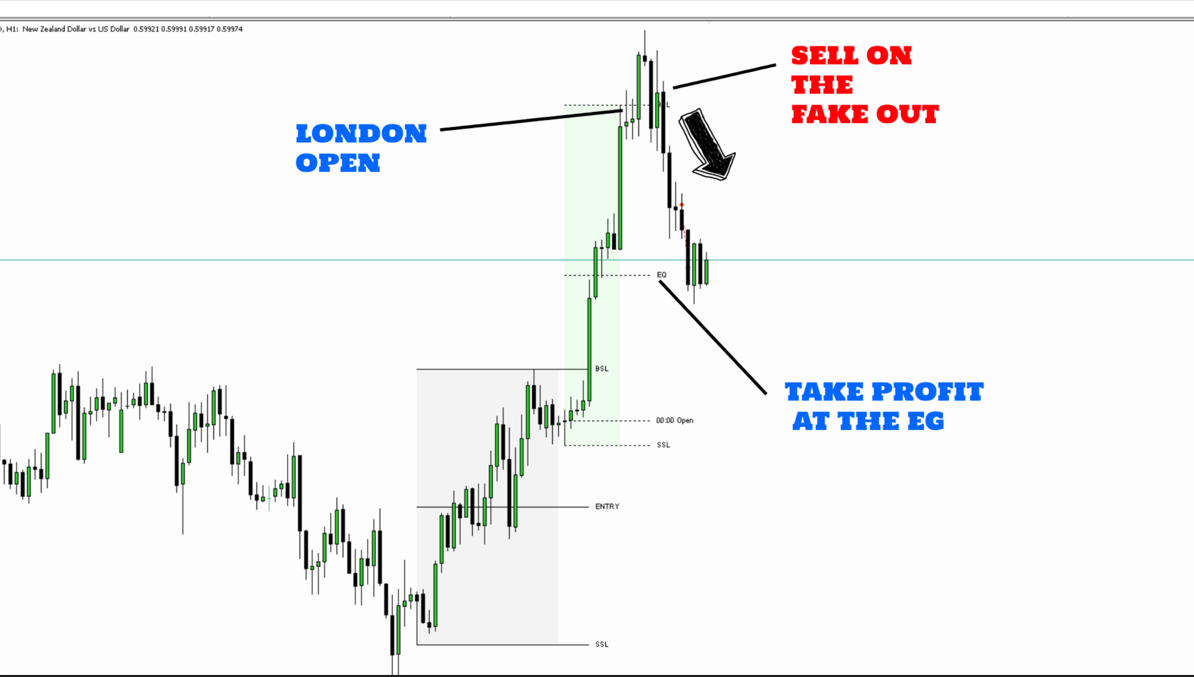
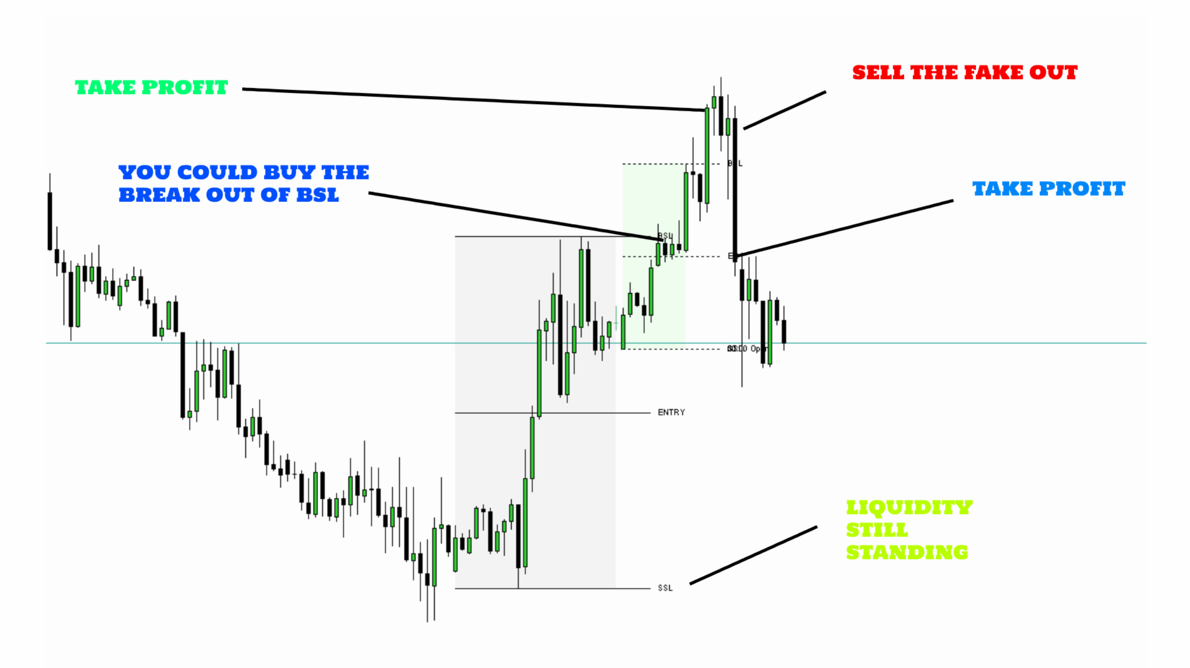
Pero eso no es todo: con esta estrategia, no estará limitado a un único enfoque. ¡También puede aprovechar la ruptura de Londres aprovechando la liquidez BSL y SSL, ofreciéndole versatilidad y el potencial de obtener ganancias aún mayores!


**Aquí hay un ejemplo:**


Imagínese cuando el precio sube desde la liquidez del lado comprador y cruza con confianza el nivel de entrada. Es su señal para entrar en la operación y fijar su mirada en la liquidez del lado vendedor: ¡una estrategia sencilla pero potente!


**¿Por qué optar por esta estrategia?**


1. **Rentabilidad comprobada:** Esta estrategia ha resistido la prueba del tiempo y está respaldada por un historial de rentabilidad constante. Una vez que lo domine, estará bien encaminado hacia ganancias sostenibles.


2. **Consistencia sobre cambio:** Detenga el ciclo de cambio constante de estrategias. Adopte la confiabilidad de esta estrategia y manténgala firme para observar cómo se disparan sus ganancias.


Experimente la magia del comercio de precisión con nuestra estrategia de reversión. No deje que se le escapen las oportunidades: ¡elija esta estrategia hoy y lleve su juego comercial a nuevas alturas!
Comentarios 1
cubetrader33
646
cubetrader33 2023.09.29 07:24 
 

Excelente indicado de Forex e índices sintéticos.

Productos recomendados
Was: $249  Now: $99   Market Profile defines a number of day types that can help the trader to determine market behaviour. A key feature is the Value Area, representing the range of price action where 70% of trading took place. Understanding the Value Area can give traders valuable insight into market direction and establish the higher odds trade. It is an excellent addition to any system you may be using. Inspired by Jim Dalton’s book “Mind Over Markets”, this indicator is designed to suit the
Wapv Price and volume
Eduardo Da Costa Custodio Santos
El indicador de precio y volumen WAPV para MT5 es parte del conjunto de herramientas (Wyckoff Academy Wave Market) y (Wyckoff Academy Price and Volume). El indicador de precio y volumen WAPV para MT5 se creó para facilitar la visualización del movimiento del volumen en el gráfico de forma intuitiva. Con ella podrás observar los momentos de pico de volumen y momentos en los que el mercado no tiene interés profesional Identificar momentos en los que el mercado se mueve por inercia y no por movimie
No Demand No Supply MT5
Trade The Volume Waves Single Member P.C.
No Demand No Supply   This indicator identifies   No Demand –No Supply candles to your chart and plots volume bars colored according to the signal. It can be applied to all timeframes or to a specific one only. It can also be used as regular volume indicator  with exceptional future of WEIGHTED VOLUME. Furthermore is has an alert notification, sound and email when a signals occurs. The indicator does not repaint but the alert will come on two candles back due to the definition of No Demand No Su
To get access to MT4 version please click here . - This is the exact conversion from TradingView: "Stochastic Momentum Index" By "UCSgears". - This is a popular version of stochastic oscillator on tradingview. - This is a light-load processing and non-repaint indicator. - Buffers are available for the lines on chart. - You can message in private chat for further changes you need. Thanks for downloading
The Accumulation / Distribution is an indicator which was essentially designed to measure underlying supply and demand. It accomplishes this by trying to determine whether traders are actually accumulating (buying) or distributing (selling). This indicator should be more accurate than other default MT5 AD indicator for measuring buy/sell pressure by volume, identifying trend change through divergence and calculating Accumulation/Distribution (A/D) level. Application: - Buy/sell pressure: above
1. What is this         Rising volatility and falling volatility are not the same, whether it is academic research or actual testing has shown this point.         The original ATR indicator is calculated by putting up and down fluctuations together. This indicator is to calculate separately the upward volatility and the downward volatility, which can better help you study the market. 2. Indicator description          There are two modes for the calculation of this indicator, as shown in the f
Developed by Smart Trader - Smart Reversion Pattern is an indicator capable of identifying reversal patterns , both bullish reversals and bearish reversals. It is designed to provide fast, real-time awareness of patterns. We also thought about the interface part, creating a clean and pleasant look to identify formation patterns on the chart. Note: If any pattern you need is not listed, just contact us and request inclusion - we usually respond within a few hours. Bearish Reversal P
The Penta-O is a 6-point retracement harmonacci pattern which usually precedes big market movements. Penta-O patterns can expand and repaint quite a bit. To make things easier this indicator implements a twist: it waits for a donchian breakout in the right direction before signaling the trade. The end result is an otherwise repainting indicator with a very reliable trading signal. The donchian breakout period is entered as an input. [ Installation Guide | Update Guide | Troubleshooting | FAQ | A
PZ Fibonacci MT5
PZ TRADING SLU
5 (1)
Are you tired of plotting Fibonacci retracements or extensions manually? This indicator displays Fibo retracements or extensions automatically, calculated from two different price points, without human intervention or manual object anchoring. [ Installation Guide | Update Guide | Troubleshooting | FAQ | All Products ] Easy to use Manual anchoring is not needed Perfect for price confluence studies The indicator evaluates if retracements or extensions are needed Once drawn, you can manually edit t
Owl Smart Levels MT5
Sergey Ermolov
4.07 (28)
Versión MT4  |  FAQ El Indicador Owl Smart Levels es un sistema comercial completo dentro de un indicador que incluye herramientas de análisis de mercado tan populares como los fractales avanzados de Bill Williams , Valable ZigZag que construye la estructura de onda correcta del mercado y los niveles de Fibonacci que marcan los niveles exactos de entrada. en el mercado y lugares para tomar ganancias. Descripción detallada de la estrategia Instrucciones para trabajar con el indicador Asesor de c
Mini Chart Indicators
Flavio Javier Jarabeck
The Metatrader 5 has a hidden jewel called Chart Object, mostly unknown to the common users and hidden in a sub-menu within the platform. Called Mini Chart, this object is a miniature instance of a big/normal chart that could be added/attached to any normal chart, this way the Mini Chart will be bound to the main Chart in a very minimalist way saving a precious amount of real state on your screen. If you don't know the Mini Chart, give it a try - see the video and screenshots below. This is a gr
Noize Absorption Index - is the manual trading system that measures the difference of pressure between bears forces and bulls forces. Green line - is a noize free index that showing curent situation. Zero value of index shows totally choppy/flat market.Values above zero level shows how powerfull bullish wave is and values below zero measures bearish forces.Up arrow appears on bearish market when it's ready to reverse, dn arrow appears on weak bullish market, as a result of reverse expectation.
Market profile was developed by Peter Steidlmayer in the second half of last century. This is a very effective tool if you understand the nature and usage. It's not like common tools like EMA, RSI, MACD or Bollinger Bands. It operates independently of price, not based on price but its core is volume. The volume is normal, as the instrument is sung everywhere. But the special thing here is that the Market Profile represents the volume at each price level. 1. Price Histogram The Price Histogram
Thunder Scalper
Mr Fares Mohammad Alabdali
Indicador de objetivos de compra y venta       Consta de tres líneas: el primer color verde identifica los objetivos de compra, el segundo color rojo identifica los objetivos de venta y el tercer color azul es el precio promedio.       Hay dos formas de entrar:       Método 1: punto de entrada cuando el precio promedio se rompe con una vela larga desde abajo y mantenerse por encima de la línea azul con una vela verde se considera compra       Cuando el precio promedio atraviesa el techo con un
Crash 1000 Scalping Indicator for the Crash 1000 Deriv Synthetic Index. Introduction The Crash 1000 Scalping Indicator is a specialized tool designed for the Crash 1000 index on the Deriv Synthetic market. This indicator is particularly useful for scalping on the M1 timeframe, helping traders to identify precise entry and exit points for buy positions. It is designed to be non-repainting, providing clear signals with audible alerts and push notifications, and is compatible with mobile devices th
Este indicador le mostrará los valores TP y SL (en esa moneda) que ya configuró para cada pedido en los gráficos (cerrados a la línea de transacción/pedido) que lo ayudarán mucho a estimar sus ganancias y pérdidas para cada pedido. Y también te muestra los valores de PIP. el formato que se muestra es "Valores de moneda de nuestros valores de ganancias o pérdidas / PIP". El valor TP se mostrará en color verde y el valor SL se mostrará en color rojo. Para cualquier pregunta o más información, n
Upgraded - Stars added to indentify Areas you can scale in to compound on your entry  when buying or selling version 2.4 Upgraded Notifications and alerts added version 2.3 *The indicator is suitable for all pairs fromm  Deriv pairs (Vix,jump,boom & crash indices) , Currencies, cryptos , stocks(USA100, USA30 ), and metals like gold etc. How does it work? Increasing the period make it more stable hence will only focus on important entry points However  lowering the period will mean the indica
Terra Infinity is a flat indicator. This improved version of the CalcFlat indicator has three additional lines that significantly increase its effectiveness. Unlike its predecessor with two static levels, Terra Infinity adds three dynamic lines above the main histogram, which are interpreted as follows: base signal line, minimum signal line, maximum signal line. These lines are formed using the additional parameter Avg, which is the average value of the histogram. Averaging produces a line
An indicator of patterns #24, #25, #26 and #27 ("Head and Shoulders", "Complex Head and Shoulders") from Encyclopedia of Chart Patterns by Thomas N. Bulkowski. Parameters: Alerts - show alert when an arrow appears   Push - send a push notification when an arrow appears (requires configuration in the terminal) PeriodBars - indicator period K - an additional parameter that influences the accuracy of pattern shape recognition. The smaller the value is, the smoother the row of peaks/valleys shoul
Delta Aggression Volume PRO is an indicator developed to monitor the strength and continuity of the aggression volume of sell and buy negotiations. Note: This indicator DOES NOT WORK for Brokers and/or Markets WITHOUT the type of aggression (BUY or SELL). Cryptocurrencies and Forex do not provide this type of data, that is, it does not work with them. O Delta Agrression Volume PRO has features that allow you to view beyond the delta volume of the day. Operation Multi symbols  (those who pro
To get access to MT4 version please click here . This is the exact conversion from TradingView: "[SHK] Schaff Trend Cycle (STC)" by "shayankm". This is a light-load processing indicator. This is a non-repaint indicator. Buffers are available for processing in EAs. All input fields are available. You can message in private chat for further changes you need. Thanks for downloading
B Xtrender
Yashar Seyyedin
To download MT4 version please click here . This is the exact conversion from TradingView: "B-Xtrender" By "QuantTherapy". - It is an oscillator based on RSI and multiple layers of moving averages. -   It is a two in one indicator to calculate overbought and oversold zones for different RSI settings. -  This indicator lets you read the buffers for all data on the window. - This is a non-repaint and light processing load indicator. - You can message in private chat for further changes you need.
Este producto le ayudará a comprar con beneficio y usar dos productos más populares para el análisis de los volúmenes de las peticiones y operaciones en los mercados de equidad: Actual Depth of Market Chart Actual Tick Footprint Volume Chart Este producto ha integrado toda la potencia de cada uno de los indicadores y se ofrece como un archivo único. Las rebajas anticrisis. ¡Hoy el precio del producto está rebajado! ¡Dese prisa! Las capacidades funcionales del producto Actual COMBO Depth of Mark
Big Candle Detect
Guilherme Guimaraes Dias
The indicator, Big Candle Detect , is based on ATR and Volume to detect candlesticks of buying and selling strength, which is represented through an oscillator indicator. With this indicator you will be able to identify the lateral market, providing better entries according to your strategy. Big Candle Detect highlights candles with brighter colors when the condition is found, making it easier to identify, in addition to being fully compatible for automation in your EA. SETTINGS ATR P
Nuevo Indicador Combinado - 3 en 1 ¿Estás buscando herramientas de trading que puedan mejorar tu análisis de mercado y tus estrategias de inversión? Hemos combinado tres de nuestros mejores indicadores en una única solución poderosa y conveniente, permitiéndote obtener el máximo valor para tu trading. 1. Indicador de Bloques de Órdenes (anteriormente vendido por 32,90$) El Indicador de Bloques de Órdenes es una herramienta esencial para identificar áreas de fuerte interés institucional dentro de
HMA Trend Professional MT5
Pavel Zamoshnikov
4.25 (4)
Improved version of the free HMA Trend indicator (for MetaTrader 4) with statistical analysis. HMA Trend is a trend indicator based on the Hull Moving Average (HMA) with two periods. HMA with a slow period identifies the trend, while HMA with a fast period determines the short-term movements and signals in the trend direction. The main differences from the free version: Ability to predict the probability of a trend reversal using analysis of history data. Plotting statistical charts for analyz
Gann Box (o Gann Square) es un método de análisis de mercado basado en el artículo "Fórmula matemática para predicciones de mercado" de W.D. Gann. Este indicador puede trazar tres modelos de cuadrados: 90, 52 (104), 144. Hay seis variantes de cuadrículas y dos variantes de arcos. Puede trazar varios cuadrados en un gráfico simultáneamente. Parámetros Square — selección de un modelo cuadrado: 90 — cuadrado de 90 (o cuadrado de nueve); 52 (104) — cuadrado de 52 (o 104); 144 — cuadrado univer
Renko Gold
Ignacio Agustin Mene Franco
Renko Gold !  indica clara mente los pisos y techos donde va de 4 lineas ,  la linea de abajo que marca el piso en color verde confirmando con la linea mas fina aclara la entrada en compra ,  lo mismo es para la venta , la linea de arriba marca el techo y la mas fina de color  rojo marca la venta ,  este indicador sirve para todas las temporalidades !  Para los mercados de Forex y Indices sinteticos ! Tambien sirve para los mercados de crypto !  Buen Profit! World Inversor. 
WaveTrend 3D is the mql version of this oscillator (By jdehorty and LazyBear). WaveTrend 3D (WT3D) is a novel implementation of the famous WaveTrend (WT) indicator and has been completely redesigned from the ground up to address some of the inherent shortcomings associated with the traditional WT algorithm. WaveTrend 3D is an alternative implementation of WaveTrend that directly addresses some of the known shortcomings of the indicator, including its unbounded extremes, susceptibility to whip
Los compradores de este producto también adquieren
TPSpro RFI Levels MT5
Roman Podpora
4.75 (12)
INSTRUCCIONES       RUSO   -   ING        Se   recomienda utilizar con un indicador.       -       TPSpro   TENDENCIA PRO -   Versión MT5 Un elemento clave en el trading son las zonas o niveles desde los que se toman las decisiones de compra o venta de un instrumento de trading. A pesar de los intentos de los principales actores de ocultar su presencia en el mercado, inevitablemente dejan rastros. Nuestra tarea era aprender a identificar estos rastros e interpretarlos correctamente. Funciones p
TPSproTREND PrO MT5
Roman Podpora
4.89 (9)
TPSpro TREND PRO  - is a trend indicator that automatically analyzes the market and provides information about the trend and each of its changes, as well as giving signals for entering trades without redrawing! The indicator uses each candle, analyzing them separately. referring to different impulses - up or down impulse. Exact entry points into transactions for currencies, crypto, metals, stocks, indices!  Version MT4               DETAILED DESCRIPTION               R ecommended to use with an
Atbot
Zaha Feiz
4.92 (36)
AtBot: Cómo funciona y cómo usarlo ### Cómo funciona El indicador "AtBot" para la plataforma MT5 genera señales de compra y venta utilizando una combinación de herramientas de análisis técnico. Integra la Media Móvil Simple (SMA), la Media Móvil Exponencial (EMA) y el índice de Rango Verdadero Promedio (ATR) para identificar oportunidades de trading. Además, puede utilizar velas Heikin Ashi para mejorar la precisión de las señales. Deja una reseña después de la compra y recibe un regalo especia
Trend Screener Pro MT5
STE S.S.COMPANY
4.87 (63)
Desbloquee el poder del comercio de tendencias con el indicador Trend Screener: ¡su solución definitiva para el comercio de tendencias impulsada por lógica difusa y un sistema multidivisa!Mejore su comercio de tendencias con Trend Screener, el revolucionario indicador de tendencias impulsado por lógica difusa. Es un poderoso indicador de seguimiento de tendencias que combina más de 13 herramientas y funciones premium y 3 estrategias comerciales, lo que lo convierte en una opción versátil para co
Atomic Analyst MT5
Issam Kassas
4.32 (19)
En primer lugar, vale la pena enfatizar que este Indicador de Trading no repinta, no redibuja y no se retrasa, lo que lo hace ideal tanto para el trading manual como para el automatizado. Manual del usuario: configuraciones, entradas y estrategia. El Analista Atómico es un Indicador de Acción del Precio PA que utiliza la fuerza y el impulso del precio para encontrar una mejor ventaja en el mercado. Equipado con filtros avanzados que ayudan a eliminar ruidos y señales falsas, y aumentan el poten
Primero que todo, vale la pena enfatizar que este Sistema de Trading es un Indicador No Repintado, No Redibujado y No Retrasado, lo que lo hace ideal tanto para el trading manual como para el automatizado. Curso en línea, manual y descarga de ajustes preestablecidos. El "Sistema de Trading Inteligente MT5" es una solución completa de trading diseñada para traders nuevos y experimentados. Combina más de 10 indicadores premium y presenta más de 7 estrategias de trading robustas, lo que lo convie
Quantum TrendPulse
Bogdan Ion Puscasu
5 (1)
Presentamos   Quantum TrendPulse   , la herramienta de trading definitiva que combina el poder de   SuperTrend   ,   RSI   y   Stochastic   en un indicador integral para maximizar su potencial de trading. Diseñado para traders que buscan precisión y eficiencia, este indicador le ayuda a identificar tendencias del mercado, cambios de impulso y puntos de entrada y salida óptimos con confianza. Características principales: Integración con SuperTrend:   siga fácilmente la tendencia predominante del
Este es un genial indicador para MT5 que ofrece señales precisas para entrar en una transacción sin redibujar. Se puede aplicar a cualquier activo financiero: fórex, criptomonedas, metales, acciones, índices. Nos dará valoraciones bastante precisas y nos dirá cuándo es mejor abrir y cerra una transacción. Eche un vistazo  al vídeo  (6:22), ¡contiene un ejemplo de procesamiento de una sola señal que ha amortizado el indicador! La mayoría de los tráders mejoran sus resultados comerciales durante l
FX Power MT5 NG
Daniel Stein
5 (6)
Obtenga su actualización diaria del mercado con detalles y capturas de pantalla a través de nuestro Morning Briefing aquí en mql5 y en Telegram ! FX Power MT5 NG es la nueva generación de nuestro popular medidor de fuerza de divisas, FX Power. ¿Y qué ofrece este medidor de fuerza de nueva generación? Todo lo que le encantaba del FX Power original PLUS Análisis de fuerza de ORO/XAU Resultados de cálculo aún más precisos Períodos de análisis configurables individualmente Límite de cálculo persona
Gold Stuff mt5
Vasiliy Strukov
4.92 (169)
Gold Stuff mt5: un indicador de tendencia diseñado específicamente para el oro, también se puede usar en cualquier instrumento financiero. El indicador no se vuelve a dibujar ni se retrasa. El marco de tiempo recomendado es H1. IMPORTANTE! Póngase en contacto conmigo inmediatamente después de la compra para obtener instrucciones y bonificación!   Puede obtener una copia gratuita de nuestro indicador Strong Support y Trend Scanner, por favor envíe un mensaje privado. ¡a mí! PARÁMETROS Draw
FX Volume MT5
Daniel Stein
4.93 (14)
Obtenga su actualización diaria del mercado con detalles y capturas de pantalla a través de nuestro Morning Briefing aquí en mql5 y en Telegram ! FX Volume es el PRIMER y ÚNICO indicador de volumen que proporciona una visión REAL del sentimiento del mercado desde el punto de vista de un bróker. Proporciona una visión impresionante de cómo los participantes institucionales del mercado, como los brokers, están posicionados en el mercado Forex, mucho más rápido que los informes COT. Ver esta info
Introduciendo       Quantum Breakout PRO   , el innovador indicador MQL5 que está transformando la forma en que comercia con Breakout Zones. Desarrollado por un equipo de comerciantes experimentados con experiencia comercial de más de 13 años,       Desglose cuántico PRO       está diseñado para impulsar su viaje comercial a nuevas alturas con su innovadora y dinámica estrategia de zona de ruptura. El indicador de ruptura cuántica le dará flechas de señal en las zonas de ruptura con 5 zonas
Este tablero muestra los últimos   patrones armónicos   disponibles para los símbolos seleccionados, por lo que ahorrará tiempo y será más eficiente /   versión MT4 . Indicador gratuito:   Basic Harmonic Pattern Columnas del indicador Symbol:   aparecerán los símbolos seleccionados Trend :   alcista o bajista Pattern :   tipo de patrón (gartley, mariposa, murciélago, cangrejo, tiburón, cifrado o ABCD) Entry :   precio de entrada SL:   precio de stop loss TP1:   1er precio de toma de benefici
Ante todo, vale la pena enfatizar que esta Herramienta de Trading es un Indicador No Repintado, No Redibujado y No Retrasado, lo que la hace ideal para el trading profesional. Curso en línea, manual del usuario y demostración. El Indicador de Conceptos de Acción del Precio Inteligente es una herramienta muy potente tanto para traders nuevos como experimentados. Combina más de 20 indicadores útiles en uno solo, combinando ideas avanzadas de trading como el Análisis del Trader del Círculo Inte
Blahtech Supply Demand MT5
Blahtech Limited
4.54 (13)
Was: $299  Now: $99   Supply Demand uses previous price action to identify potential imbalances between buyers and sellers. The key is to identify the better odds zones, not just the untouched ones. Blahtech Supply Demand indicator delivers functionality previously unavailable on any trading platform. This 4-in-1 indicator not only highlights the higher probability zones using a multi-criteria strength engine, but also combines it with multi-timeframe trend analysis, previously confirmed swings
TPA True Price Action indicator reveals the true price action of the market makers through 100% non-repainting signals strictly at the close of a candle! TPA shows entries and re-entries, every time the bulls are definitely stronger than the bears and vice versa. Not to confuse with red/green candles. The shift of power gets confirmed at the earliest stage and is ONE exit strategy of several. There are available now two free parts of the TPA User Guide for our customers. The first "The Basics"
Matrix Arrow Indicator MT5
Juvenille Emperor Limited
5 (13)
Matrix Arrow Indicator MT5   es una tendencia única 10 en 1 que sigue un indicador   100% sin repintado   de marcos temporales múltiples que se puede usar en todos los símbolos/instrumentos:   divisas ,   materias primas ,   criptomonedas ,   índices ,   acciones .  Matrix Arrow Indicator MT5  determinará la tendencia actual en sus primeras etapas, recopilando información y datos de hasta 10 indicadores estándar, que son: Índice de movimiento direccional promedio (ADX) Índice de canales de prod
Auto Order Block with break of structure based on ICT and Smart Money Concepts (SMC) Futures Break of Structure ( BoS )             Order block ( OB )            Higher time frame Order block / Point of Interest ( POI )    shown on current chart           Fair value Gap ( FVG ) / Imbalance   -  MTF      ( Multi Time Frame )    HH/LL/HL/LH  -  MTF      ( Multi Time Frame )  Choch  MTF      ( Multi Time Frame )  Volume Imbalance     ,  MTF          vIMB Gap’s Power of 3 Equal High
Quantum Trend Sniper
Bogdan Ion Puscasu
4.8 (49)
Introduciendo       Indicador Quantum Trend Sniper   , el innovador indicador MQL5 que está transformando la forma en que identificas y negocias los cambios de tendencia. Desarrollado por un equipo de comerciantes experimentados con experiencia comercial de más de 13 años,       Indicador de francotirador de tendencia cuántica       está diseñado para impulsar su viaje comercial a nuevas alturas con su forma innovadora de identificar cambios de tendencia con una precisión extremadamente alta.
Ahora $ 147 (aumentando a $ 499 después de algunas actualizaciones) - Cuentas ilimitadas (PC o Mac) Manual de usuario de RelicusRoad + Videos de capacitación + Acceso al grupo privado de Discord + Estado VIP UNA NUEVA MANERA DE VER EL MERCADO RelicusRoad es el indicador comercial más poderoso del mundo para divisas, futuros, criptomonedas, acciones e índices, y brinda a los comerciantes toda la información y las herramientas que necesitan para mantenerse rentables. Brindamos análisis téc
PTS - Buscador de Compras por Divergencia de Precision Trading Systems El Buscador de Divergencias de Precisión fue diseñado para encontrar los mínimos del mercado con una precisión milimétrica y lo hace con frecuencia. En el análisis técnico, la habilidad de identificar mínimos generalmente es mucho más fácil que identificar máximos, y este elemento está diseñado precisamente para esa tarea. Después de identificar una divergencia alcista, es prudente esperar a que la tendencia se vuelva al
Advanced Supply Demand MT5
Bernhard Schweigert
4.5 (14)
¡Actualmente con 33% de descuento! ¡La mejor solución para cualquier tráder principiante o experto! Este indicador es una herramienta comercial única, de alta calidad y asequible, porque incorpora una serie de características patentadas y una nueva fórmula. Con esta actualización, podrá mostrar zonas de doble marco temporal. No solo podrá mostrar un marco temporal más alto, sino también mostrar ambos, el marco temporal del gráfico MÁS el marco temporal más alto: MOSTRANDO ZONAS ANIDADAS. A todos
ICT, SMC, SMART MONEY CONCEPTS, SMART MONEY, Smart Money Concept, Support and Resistance, Trend Analysis, Price Action, Market Structure, Order Blocks, BOS/CHoCH,   Breaker Blocks ,  Momentum Shift,   Supply&Demand Zone/Order Blocks , Strong Imbalance,   HH/LL/HL/LH,    Fair Value Gap, FVG,  Premium  &   Discount   Zones, Fibonacci Retracement, OTE, Buy Side Liquidity, Sell Side Liquidity, BSL/SSL Taken, Equal Highs & Lows, MTF Dashboard, Multiple Time Frame, BigBar, HTF OB, HTF Market Structure
FxaccurateLS
Shiv Raj Kumawat
WHY IS OUR FXACCCURATE LS MT5 THE PROFITABLE ? PROTECT YOUR CAPITAL WITH RISK MANAGEMENT Gives entry, stop and target levels from time to time. It finds Trading opportunities by analyzing what the price is doing during established trends. POWERFUL INDICATOR FOR A RELIABLE STRATEGIES We have made these indicators with a lot of years of hard work. It is made at a very advanced level. Established trends provide dozens of trading opportunities, but most trend indicators completely ignore them!
Trend Line Map Pro MT5
STE S.S.COMPANY
4.09 (11)
El indicador Trend Line Map es un complemento para Trend Screener Indicator. Funciona como un escáner para todas las señales generadas por el evaluador de tendencias (Trend Line Signals). Es un escáner de líneas de tendencia basado en el indicador de evaluación de tendencias. Si no tiene el indicador Trend Screener Pro, Trend Line Map Pro no funcionará. It's a Trend Line Scanner based on Trend Screener Indicator. If you don't have Trend Screener Pro Indicator,     the Trend Line Map Pro will
Introducing the POWER TRADE indicator created by a small group of traders with a few years trading trading the financial market profitably . This is a plug and play indicator that provides you with  POWERFUL Entry signals with Profit Taking and rebound zones. The indicator Works with all MT5 trading instruments. The indicator uses previous  chart data as receipt to speculate on future market moves.
Trend Forecaster
Alexey Minkov
5 (6)
The Trend Forecaster indicator utilizes a unique proprietary algorithm to determine entry points for a breakout trading strategy. The indicator identifies price clusters, analyzes price movement near levels, and provides a signal when the price breaks through a level. The Trend Forecaster indicator is suitable for all financial assets, including currencies (Forex), metals, stocks, indices, and cryptocurrencies. You can also adjust the indicator to work on any time frames, although it is recommen
Contact me for instruction, any questions! Related Product:  Gold Trade Expert MT5 Introduction The breakout and retest strategy is traded support and resistance levels. it involves price breaking through a previous level.  The break and retest strategy is designed to help traders do two main things, the first is to avoid false breakouts. Many false breakouts start with a candlestick that breaks out of a level but ends with an immediate candlestick that brings the price back into the level. T
ICT, SMC, Smart Money Concept, Soporte y Resistencia, Análisis de Tendencias, Acción del Precio, Estructura del Mercado, Bloques de Órdenes, Bloques Rompedores, Cambio de Momentum, Fuerte Desbalance, HH/LL/HL/LH, Brecha de Valor Justo, FVG, Zonas de Prima y Descuento, Retroceso de Fibonacci, OTE, Liquidez en el Lado Comprador, Liquidez en el Lado Vendedor, Vacíos de Liquidez, Sesiones de Mercado, NDOG, NWOG, Bala de Plata, Plantilla ICT. En el mercado financiero, el análisis de mercado precis
First of all Its worth emphasizing here that this Trading indicator is   Non-Repainting   , Non Redrawing and Non Lagging Indicator   Which makes it ideal from both manual and robot trading .  Viking Strategy Signal Indicator  - is a trend indicator that automatically analyzes the market and provides information about the trend and each of its changes, as well as giving signals for entering trades without redrawing! . Exact entry points into transactions for currencies, crypto, metals, stock
Otros productos de este autor
Algo Map
Kenny Michael Smith
5 (3)
MAPA DE ALGO CARACTERÍSTICAS - NIVELES DE ENTRADA - TOMAR NIVELES DE GANANCIAS - PUNTOS DE ENTRADA DE INVERSIÓN - ESTRATEGIA DE REVERSIÓN - ESTRATEGIA DE COMERCIO DE TENDENCIAS - COMPRAR Y VENDER SEÑALES DE SWING TRADING EN CADA PLAZO DE TIEMPO ¡EL SOFTWARE COMERCIAL #1 SUPERA CUALQUIER MERCADO CUALQUIER DÍA CON ESTE SOFTWARE MT5! ¡QUIERO PASAR EL MAPA DE ALGO DE FIRMAS DE PROP ES AMISTOSO DE FIRMA DE PROP! NUEVO EN EL COMERCIO Y QUIERE UNA ESTRATEGIA QUE FUNCIONE CON EL T
Algo Map L
Kenny Michael Smith
Presentamos Algo Map Lite, un software de vanguardia diseñado para revolucionar su experiencia comercial. Esta herramienta avanzada se integra perfectamente con sus sesiones de negociación y proporciona un análisis completo del nivel de ruptura en cada ocasión. Además de su interfaz intuitiva y su funcionalidad de impresión a nivel de tiempo real, Algo Map Lite se destaca por incorporar meticulosas métricas de tasa de ganancia para fortalecer sus afirmaciones de rendimiento. Nuestro compr
Filtro:
cubetrader33
646
cubetrader33 2023.09.29 07:24 
 

Excelente indicado de Forex e índices sintéticos.

Respuesta al comentario