• Información general
  • Comentarios (9)
  • Discusión (4)
  • Novedades

Market Structures MT5

4.88

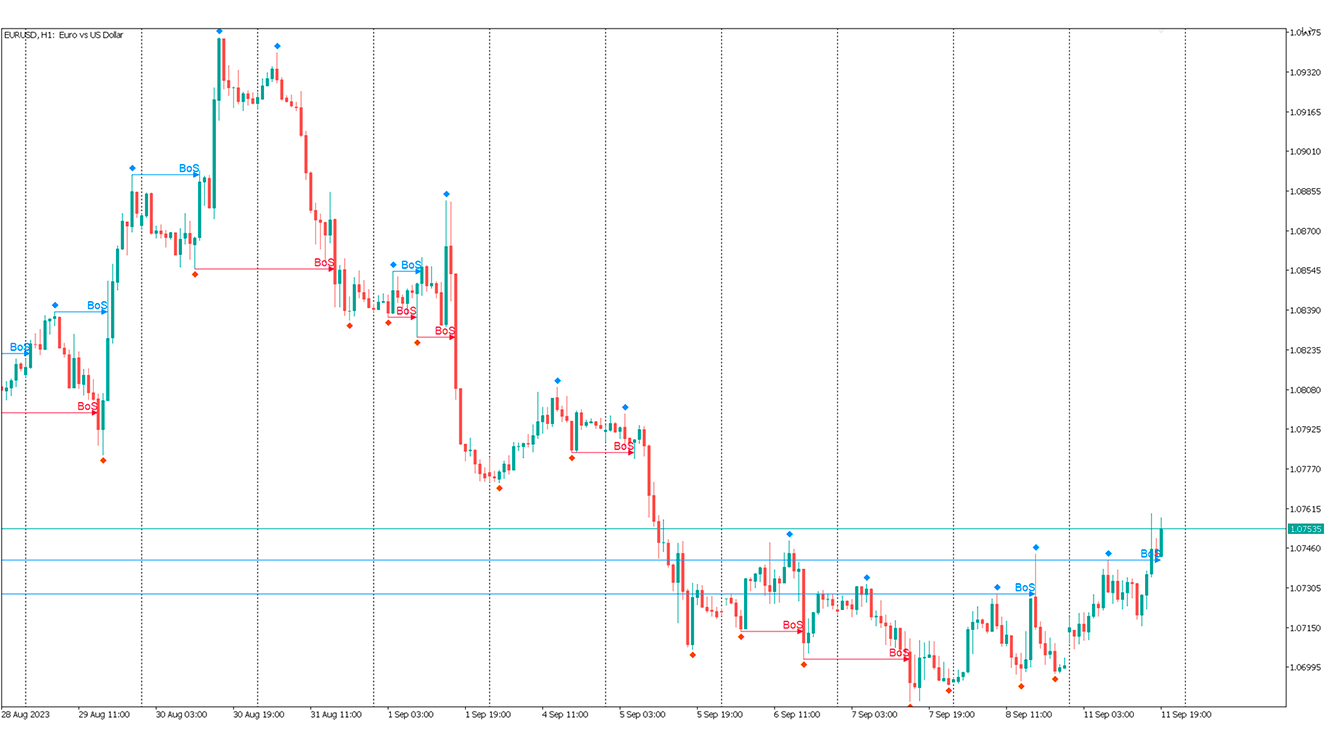
The Market Structures MT5 indicator finds and shows the Break Of Structures (BoS) pattern on the chart. The pattern is an important part of the Smart Money Concepts (SMC) system.
The appearance of a pattern means that the price breaks the last peak of an uptrend, or the last bottom of a downtrend. This indicates a change in the existing trend structure and the beginning of a new movement.
BOS is a technical analysis tool used to identify trend reversals.


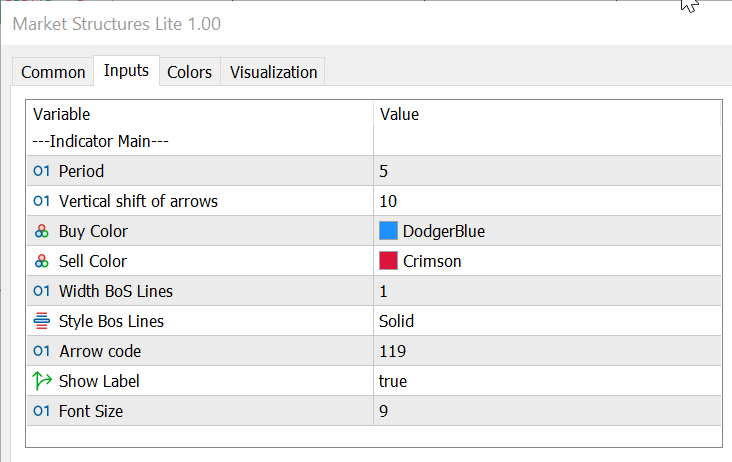
The set of input parameters is simple. Main parameter:

  • Period. Using this parameter, local extrema are determined.

Other parameters change the appearance of the indicator.
The concept of BOS (Break of Structure) refers to a price movement that changes the existing trend structure and initiates a new impulse. This strategy, used in technical analysis, helps traders identify trend reversals and take advantage of potential trading opportunities.

A "Pro" version of this indicator has been developed. You can find it here.

Comentarios 9
Seth Tetteh
1313
Seth Tetteh 2024.04.25 11:54 
 

cool

Slavcho Mitrovski
18
Slavcho Mitrovski 2024.02.01 07:10 
 

So Kann Mann Trend leicht bestimmen.

Detleff Böhmer
2625
Detleff Böhmer 2023.12.07 07:00 
 

Gut gemacht, sehr guter Indikator.

Productos recomendados
A countdown timer for the  Volume bar chart generator  and  Tick chart generator  products, which are available for download from the MQL5 Market: Tick chart generator: https://www.mql5.com/en/market/product/29215 Volume bar chart generator: https://www.mql5.com/en/market/product/47197 The counter conveniently displays the number of ticks or transactions (depending on the chart) that need to pass for a new bar to start printing. The user can set the following indicator inputs. Volume type
FREE
Value Chart Candlesticks
Flavio Javier Jarabeck
4.67 (9)
The idea of a Value Chart indicator was presented in the very good book I read back in 2020 , " Dynamic Trading Indicators: Winning with Value Charts and Price Action Profile ", from the authors Mark Helweg and David Stendahl. The idea is simple and the result is pure genius: Present candlestick Price analysis in a detrended way! HOW TO READ THIS INDICATOR Look for Overbought and Oversold levels. Of course, you will need to test the settings a lot to find the "correct" one for your approach.
FREE
Weis Waves
Flavio Javier Jarabeck
3.15 (26)
The original author is David Weis, an expert in the Wyckoff Method. The Weis Wave is a modern adaptation of the 1930's Wyckoff Method, another expert in Tape Reading techniques and Chart Analysis. Weis Waves takes market volume and stacks it into waves according to price conditions giving the trader valuable insights about the market conditions. If you want to learn more about this subject you can find tons of videos in YouTube. Just look for "The Wickoff Method", "Weis Wave" and "Volume Spread
FREE
VWAP Indicator
LUC JACOBUS A VERHEECKE
4.26 (23)
Volume Weighted Average Price (VWAP) The volume weighted average price (VWAP) is a  trading   benchmark  used by traders that gives the average price a security has traded at throughout the day, based on both volume and price. It is important because it provides traders with insight into both the trend and value of a security. This indicator VWAP V2 is free and is the manual version of the extended Easy VWAP indicator (30 Euro), where the date and time properties are automatically entered. With
FREE
The Volume Weighted ATR indicator is a helpful tool for measuring market activity. It is based on the idea of the Volume-Weighted ATR. Combining these two elements helps identify potential turning points or breakout opportunities. The indicator for the classification of the activity of the market uses the moving average and its multiples. Accordingly, where the VWATR bar is located (relative to the moving average), it is labelled as ultra-low, low, average, high, very high or ultra high. The Vo
FREE
Hunt markets with Hunttern ZigZag . Easy to use with one parameter    You can use it for the following:       -Classic patterns       -Heads and shoulders       -Harmonic patterns       -Elliott Wave       -Support and resistance       -Supply and Demand Single parameter:      -Period (1-120) Features:        -Candle time        -Single parameter        -Light mode template This is version 1 of Hunttern ZigZag. We are very happy to receive feedback from you.
FREE
BoxProfile MT5
Evgeny Shevtsov
4.56 (9)
The indicator displays volume profiles based on the nesting principle. Profiles periods are pre-set so that each subsequent profile has a length twice as long as the length of the previous profile. In addition to profiles, the indicator displays volume clusters sorted by color, depending on the volume they contain. Indicator operation features The indicator works on typical timeframes from M5 to MN, but for calculations uses historical data from smaller timeframes: M1 - for timeframes from M5
FREE
Waves Sizer
Flavio Javier Jarabeck
3.67 (6)
Wyckoff fans, enjoy! Ideally to be used with the Weis Waves indicator, but it can be easily used alone, the Waves Sizer puts the range (in resulting Price movement) done by the Price on its market swings. You can control how accurate or loose will be the swings. This tool is very helpful for visually know how much the Price has traveled in your Timeframe. This way you can confront this level of effort with the resulting Volume, etc... Weis Waves indicator: https://www.mql5.com/en/market/pro
FREE
Stackable VWAP
Flavio Javier Jarabeck
3.33 (6)
Volume Weighted Average Price (VWAP) is a trading benchmark commonly used by Big Players that gives the average price a Symbol has traded throughout the day. It is based on both Volume and price. Additionally we put in this indicator the MVWAP (Moving Volume Weighted Average Price). For those who do not know the usage and the importance od this indicator I recommend a great article about this subject at Investopedia ( https://www.investopedia.com/articles/trading/11/trading-with-vwap-mvwap.asp
FREE
LT Weis Waves
Thiago Duarte
5 (11)
The Weis Wave first takes the market volume and then organizes it with the price into Wave charts. It is the only software that will present the true picture of the market before you. If anyone of you, has watched an intraday price movement then you must know that it unfolds in a series of selling as well as buying waves-a procedures tearing down and building up. Wave analysis is an integral part of the trading method. The indicator helps to deal with today’s volatile market. Moreover, it works
FREE
FRB Support and Resistance
Fernando Baratieri
5 (2)
FRB Trader - Our mission is to provide the best support to customers through conted and tools so that they can achieve the expected results FRB Support and Resistance - Indicator places lines on the chart to show Support and Resistance regions. - You can choose the timeframe you want to calculate, as well as the colors of the lines. - Algorithm calculates the points where the strengths of the asset are considered and are extremely important for decision making.
FREE
PZ Penta O MT5
PZ TRADING SLU
4 (6)
The Penta-O is a 6-point retracement harmonacci pattern which usually precedes big market movements. Penta-O patterns can expand and repaint quite a bit. To make things easier this indicator implements a twist: it waits for a donchian breakout in the right direction before signaling the trade. The end result is an otherwise repainting indicator with a very reliable trading signal. The donchian breakout period is entered as an input. [ Installation Guide | Update Guide | Troubleshooting | FAQ | A
FREE
Introduction This indicator detects volume spread patterns for buy and sell opportunity. The patterns include demand and supply patterns. You might use each pattern for trading. However, these patterns are best used to detect the demand zone (=accumulation area) and supply zone (=distribution area). Demand pattern indicates generally potential buying opportunity. Supply pattern indicates generally potential selling opportunity. These are the underlying patterns rather than direct price action. T
FREE
MW Volume
Martin Bittencourt
4 (5)
El indicador de volumen Martinware traza un promedio móvil coloreado sobre las barras de volumen. La coloración utiliza tres colores y puede hacerse de diferentes maneras elegibles por el usuario y se aplica tanto al promedio como a las barras de volumen. Son posibles tres tipos de coloración: Ninguno: no se realiza ninguna coloración Aumentando o disminuyendo: cambia el color dependiendo de que el valor actual sea mayor o menor que el anterior Volumen relativo al promedio: los colores varí
FREE
This is a buyer and seller aggression indicator that analyzes the shape of each candle and project this data in a histogram form. There are 4 histograms in one. On the front we have two: Upper - Buyer force. Lower - Seller force. At the background we also have two histogram, both with same color. They measure the combined strenght of buyers and sellers. This histograms can be turned off in Input Parameters. It is also possible to have the real or tick volume to help on this force measurement. IN
FREE
White Weis Volume Ticks
Ricardo Almeida Branco
5 (3)
White Weis Volume This indicator shows the sum of the volume in each wave, bulish or bearish, as idealized by David Weis , but it brings an important addition , which is the marking of the bar with the highest volume of the wave (White Bar)! In coding the indicator, it was sought to optimize the code to require minimal processing during use and not to overload mt5. The indicator can be used for pre-trading analysis and study, where the trader analyzes possible points of support and resi
Hull Moving Average MT5
Maestri Investment Group Ltd.
5 (1)
We value your feedback and believe that your experience with the Hull Moving Average (HMA) is essential to us and other traders. Help us continue to improve and refine our product by sharing your thoughts and insights through a review! The Hull Moving Average (HMA) Indicator – Your Key to Smoother Trends and Profitable Trades! Are you tired of lagging and choppy moving averages that hinder your ability to spot profitable trading opportunities? Look no further! The Hull Moving Average (HMA) is
FREE
Functional in the Forex market. Functional in the B3 market - Bolsa Brasil Balcão. Motivation The technical Fibonacci retraction indicator for many is essential and the basis for all market movement forecasts. The name of the tool comes from the Italian mathematician Leonardo de Pisa (13th century). This DEMO version will work in Meta Trader with Demo and Strategy Tester. To purchase the Full version that works on a Real account, click on: https://www.mql5.com/en/market/product/38089
FREE
VWAP and MVWAP
Flavio Javier Jarabeck
4.17 (6)
Volume Weighted Average Price (VWAP) is a trading benchmark commonly used by Big Players that gives the average price a Symbol has traded throughout the day. It is based on both Volume and price. Additionally we put in this indicator the MVWAP (Moving Volume Weighted Average Price). For those who do not know the usage and the importance od this indicator I recommend a great article about this subject at Investopedia ( https://www.investopedia.com/articles/trading/11/trading-with-vwap-mvwap.asp )
FREE
Zona de Consolidacao
Edilson Domingos
5 (1)
It makes it easier to see where there have been consolidation zones for previous prices and allows you to highlight the histogram where there is the biggest consolidation zone. Input parameters Intervalo de preço Is the price between the histograms Periodo Number of candle sticks to be analyzed Porcentagem Highlights the histogram where there is minimal consolidation in relation to the analyzed period
FREE
This indicator sums up the difference between the sells aggression and the buys aggression that occurred in each Candle, graphically plotting the waves of accumulation of the aggression volumes.   Through these waves an exponential average is calculated that indicates the direction of the business flow. Note: This indicator DOES NOT WORK for Brokers and/or Markets WITHOUT the type of aggression (BUY or SELL).   Be sure to try our Professional version with configurable features and alerts:  Agr
FREE
Calculated Trend - the trend indicator creates two-color dots along the chart, connected by lines. This is a trend indicator, it is an algorithmic indicator. Easy to use and understand when a blue circle appears, you need to buy, when a red circle appears, you need to sell. The indicator well indicates the points of the beginning of a trend and its completion or reversal. Working on the Forex currency market without trend indicators is almost impossible. By using the Calculated Trend indicator,
Daily VWAP
Riccardo Moreo
This is the Volume Avarage Weighted Price (VWAP) it's a indicator that shows where is the avarage of the current volumes and the levels at which the price is considered premium, above the second upper band, or discount, under the second lower band, it's also very usefull to use the VWAP level as a target for operations since it's a very liquid level so the price it's attracted to it. feel free to leave a feedback either positive or negative based on your expereince with this indicator, enjoy the
FREE
Candle Timer Countdown muestra el tiempo restante antes de que se cierre la barra actual y se forme una nueva barra. Puede utilizarse para la gestión del tiempo. ¡Versión MT4 aquí ! Características destacadas Realiza un seguimiento de la hora del servidor, no de la hora local Color de texto y tamaño de fuente configurables Visualización opcional de la variación diaria del símbolo Optimizado para reducir el uso de la CPU Parámetros de entrada Mostrar variación diaria: verdadero / falso T
FREE
AvgVolumes
Marco Montemari
5 (2)
This indicator is based on Volumes standard indicator, calculates the average of Volumes based on the last N bars set by users, and if the value of the volume is bigger then a set % respect the average a different color will be used. The indicator is shown in a separate indicator window. This version has now a limitation in setting the % about the threshold. If you are interested to set threshold consider to buy the PRO version ( https://www.mql5.com/en/market/product/35925 ) If you want to use
FREE
Bar Color Trend
Germano Chagas
4.5 (10)
Combining the best of Price Action , Directional Movement , and Divergence/Convergence analysis, Candle Color Trend is a easy and reliable way to identify trend direction. The indicator automatically paints the candles according to the assumption that an uptrend is defined by prices that form a series of higher highs and higher lows. In contrast, a downtrend is defined by prices that form a series of lower highs and lower lows. Additionally, ADX Wilder indicator is used to measure trend weakness
FREE
Volume Profile For MT5
Abdelkhabir Yassine Alaoui
Volume Profile is a very useful indicator . it allows you to spot the price levels where important price action took place. It is similar to support and resistance levels but with a different logic. ( Check Out  Fixed Range Volume Profile MT5  ) One of the first thing that traders mark up when analyzing a chart is support and resistance. Volume Profile can be used for doing that too. The indicator scans the defined number of previous bars and calculates the volume of activity at each price
Aggression Volume
Flavio Javier Jarabeck
3.91 (22)
Aggression Volume Indicator is the kind of indicator that is rarely found in the MQL5 community because it is not based on the standard Volume data provided by the Metatrader 5 platform. It requires the scrutiny of all traffic Ticks requested on the platform... That said, Aggression Volume indicator requests all Tick Data from your Broker and processes it to build a very special version of a Volume Indicator, where Buyers and Sellers aggressions are plotted in a form of Histogram. Additionally,
FREE
Donchian Pro
Paulo Henrique Faquineli Garcia
5 (2)
The Donchian Channel Channels are among the most popular tools of technical analysis, as they visually convey to the analyst the limits within which most price movement tends to occur. Channel users know that valuable information can be obtained at any time, whether prices are in the central region of a band or close to one of the border lines. One of the best known techniques to explore these concepts is Bollinger Bands. However, John Bollinger was not the only one to research the applicatio
FREE
This indicator calculates the difference between the SELL aggression and the BUY aggression that occurred in each Candle, plotting the balance of each one graphically. Note: This indicator DOES NOT WORK for Brokers and/or Markets WITHOUT the type of aggression (BUY or SELL). Be sure to try our   Professional   version with configurable features and alerts:   Delta Agression Volume PRO Settings Aggression by volume (Real Volume) or by number of trades (Tick Volume) Start of the Aggression De
FREE
Los compradores de este producto también adquieren
Atomic Analyst MT5
Issam Kassas
5 (15)
En primer lugar, vale la pena enfatizar que este Indicador de Trading no repinta, no redibuja y no se retrasa, lo que lo hace ideal tanto para el trading manual como para el automatizado. Manual del usuario: configuraciones, entradas y estrategia. El Analista Atómico es un Indicador de Acción del Precio PA que utiliza la fuerza y el impulso del precio para encontrar una mejor ventaja en el mercado. Equipado con filtros avanzados que ayudan a eliminar ruidos y señales falsas, y aumentan el poten
Quantum Trend Sniper
Bogdan Ion Puscasu
5 (46)
Introduciendo       Indicador Quantum Trend Sniper   , el innovador indicador MQL5 que está transformando la forma en que identificas y negocias los cambios de tendencia. Desarrollado por un equipo de comerciantes experimentados con experiencia comercial de más de 13 años,       Indicador de francotirador de tendencia cuántica       está diseñado para impulsar su viaje comercial a nuevas alturas con su forma innovadora de identificar cambios de tendencia con una precisión extremadamente alta.
Primero que todo, vale la pena enfatizar que este Sistema de Trading es un Indicador No Repintado, No Redibujado y No Retrasado, lo que lo hace ideal tanto para el trading manual como para el automatizado. Curso en línea, manual y descarga de ajustes preestablecidos. El "Sistema de Trading Inteligente MT5" es una solución completa de trading diseñada para traders nuevos y experimentados. Combina más de 10 indicadores premium y presenta más de 7 estrategias de trading robustas, lo que lo convie
Este es un genial indicador para MT5 que ofrece señales precisas para entrar en una transacción sin redibujar. Se puede aplicar a cualquier activo financiero: fórex, criptomonedas, metales, acciones, índices. Nos dará valoraciones bastante precisas y nos dirá cuándo es mejor abrir y cerra una transacción. Eche un vistazo  al vídeo  (6:22), ¡contiene un ejemplo de procesamiento de una sola señal que ha amortizado el indicador! La mayoría de los tráders mejoran sus resultados comerciales durante l
Gold Stuff mt5
Vasiliy Strukov
4.9 (181)
Gold Stuff mt5: un indicador de tendencia diseñado específicamente para el oro, también se puede usar en cualquier instrumento financiero. El indicador no se vuelve a dibujar ni se retrasa. El marco de tiempo recomendado es H1. IMPORTANTE! Póngase en contacto conmigo inmediatamente después de la compra para obtener instrucciones y bonificación!   Puede obtener una copia gratuita de nuestro indicador Strong Support y Trend Scanner, por favor envíe un mensaje privado. ¡a mí! PARÁMETROS Draw
AT Forex Indicator MT5
Marzena Maria Szmit
5 (4)
The AT Forex Indicator MT5 is a sophisticated trading tool designed to provide traders with a comprehensive analysis of multiple currency pairs. This powerful indicator simplifies the complex nature of the forex market, making it accessible for both novice and experienced traders. AT Forex Indicator uses advanced algorithms to detect trends, patterns and is an essential tool for traders aiming to enhance their forex trading performance. With its robust features, ease of use, and reliable signal
FX Power MT5 NG
Daniel Stein
5 (5)
Obtenga su actualización diaria del mercado con detalles y capturas de pantalla a través de nuestro Morning Briefing aquí en mql5 y en Telegram ! FX Power MT5 NG es la nueva generación de nuestro popular medidor de fuerza de divisas, FX Power. ¿Y qué ofrece este medidor de fuerza de nueva generación? Todo lo que le encantaba del FX Power original PLUS Análisis de fuerza de ORO/XAU Resultados de cálculo aún más precisos Períodos de análisis configurables individualmente Límite de cálculo persona
Trend Screener Pro MT5
STE S.S.COMPANY
4.88 (66)
Desbloquee el poder del comercio de tendencias con el indicador Trend Screener: ¡su solución definitiva para el comercio de tendencias impulsada por lógica difusa y un sistema multidivisa!Mejore su comercio de tendencias con Trend Screener, el revolucionario indicador de tendencias impulsado por lógica difusa. Es un poderoso indicador de seguimiento de tendencias que combina más de 13 herramientas y funciones premium y 3 estrategias comerciales, lo que lo convierte en una opción versátil para co
Ante todo, vale la pena enfatizar que esta Herramienta de Trading es un Indicador No Repintado, No Redibujado y No Retrasado, lo que la hace ideal para el trading profesional. Curso en línea, manual del usuario y demostración. El Indicador de Conceptos de Acción del Precio Inteligente es una herramienta muy potente tanto para traders nuevos como experimentados. Combina más de 20 indicadores útiles en uno solo, combinando ideas avanzadas de trading como el Análisis del Trader del Círculo Inte
FX Volume MT5
Daniel Stein
4.94 (17)
Obtenga su actualización diaria del mercado con detalles y capturas de pantalla a través de nuestro Morning Briefing aquí en mql5 y en Telegram ! FX Volume es el PRIMER y ÚNICO indicador de volumen que proporciona una visión REAL del sentimiento del mercado desde el punto de vista de un bróker. Proporciona una visión impresionante de cómo los participantes institucionales del mercado, como los brokers, están posicionados en el mercado Forex, mucho más rápido que los informes COT. Ver esta info
Reversal First Impulse levels (RFI)      INSTRUCTIONS        RUS       -       ENG              R ecommended to use with an indicator   -   TPSpro  TREND PRO -  Version MT4                 A key element in trading is zones or levels from which decisions to buy or sell a trading instrument are made. Despite attempts by major players to conceal their presence in the market, they inevitably leave traces. Our task was to learn how to identify these traces and interpret them correctly. Main functi
XQ Indicator MetaTrader 5
Marzena Maria Szmit
5 (1)
Step into the realm of Forex trading with confidence and precision using XQ, a cutting-edge Forex indicator designed to elevate your trading game to unprecedented heights. Whether you're a seasoned trader or just stepping into the world of currency exchange, XQ Forex Indicator empowers you with the insights and signals needed to make informed trading decisions. The signal conditions are a combination of three indicators, and XQ Forex Indicator only display  medium and long-term trends . The ind
TPSproTREND PrO MT5
Roman Podpora
4.88 (8)
TPSpro TRENDPRO  - is a trend indicator that automatically analyzes the market and provides information about the trend and each of its changes, as well as giving signals for entering trades without redrawing! The indicator uses each candle, analyzing them separately. referring to different impulses - up or down impulse. Exact entry points into transactions for currencies, crypto, metals, stocks, indices!  -  Version MT4               DETAILED DESCRIPTION               R ecommended to use with
TPA True Price Action indicator reveals the true price action of the market makers through 100% non-repainting signals strictly at the close of a candle! TPA shows entries and re-entries, every time the bulls are definitely stronger than the bears and vice versa. Not to confuse with red/green candles. The shift of power gets confirmed at the earliest stage and is ONE exit strategy of several. There are available now two free parts of the TPA User Guide for our customers. The first "The Basics"
Was: $249  Now: $99   Market Profile defines a number of day types that can help the trader to determine market behaviour. A key feature is the Value Area, representing the range of price action where 70% of trading took place. Understanding the Value Area can give traders valuable insight into market direction and establish the higher odds trade. It is an excellent addition to any system you may be using. Inspired by Jim Dalton’s book “Mind Over Markets”, this indicator is designed to suit the
Advanced Supply Demand MT5
Bernhard Schweigert
4.53 (15)
¡Actualmente con 33% de descuento! ¡La mejor solución para cualquier tráder principiante o experto! Este indicador es una herramienta comercial única, de alta calidad y asequible, porque incorpora una serie de características patentadas y una nueva fórmula. Con esta actualización, podrá mostrar zonas de doble marco temporal. No solo podrá mostrar un marco temporal más alto, sino también mostrar ambos, el marco temporal del gráfico MÁS el marco temporal más alto: MOSTRANDO ZONAS ANIDADAS. A todos
Conviértase en un Breaker Trader y obtenga beneficios de los cambios en la estructura del mercado a medida que se invierte el precio. El indicador de ruptura de bloque de órdenes identifica cuándo una tendencia o movimiento de precio se acerca al agotamiento y está listo para revertirse. Le alerta sobre cambios en la estructura del mercado que generalmente ocurren cuando una reversión o un retroceso importante están a punto de suceder. El indicador utiliza un cálculo patentado que identific
Blahtech Supply Demand MT5
Blahtech Limited
4.54 (13)
Was: $299  Now: $99   Supply Demand uses previous price action to identify potential imbalances between buyers and sellers. The key is to identify the better odds zones, not just the untouched ones. Blahtech Supply Demand indicator delivers functionality previously unavailable on any trading platform. This 4-in-1 indicator not only highlights the higher probability zones using a multi-criteria strength engine, but also combines it with multi-timeframe trend analysis, previously confirmed swings
ICT, SMC, SMART MONEY CONCEPTS, SMART MONEY, Smart Money Concept, Support and Resistance, Trend Analysis, Price Action, Market Structure, Order Blocks, BOS/CHoCH,   Breaker Blocks ,  Momentum Shift,   Supply&Demand Zone/Order Blocks , Strong Imbalance,   HH/LL/HL/LH,    Fair Value Gap, FVG,  Premium  &   Discount   Zones, Fibonacci Retracement, OTE, Buy Side Liquidity, Sell Side Liquidity, BSL/SSL Taken, Equal Highs & Lows, MTF Dashboard, Multiple Time Frame, BigBar, HTF OB, HTF Market Structure
Matrix Arrow Indicator MT5
Juvenille Emperor Limited
5 (14)
Matrix Arrow Indicator MT5   es una tendencia única 10 en 1 que sigue un indicador   100% sin repintado   de marcos temporales múltiples que se puede usar en todos los símbolos/instrumentos:   divisas ,   materias primas ,   criptomonedas ,   índices ,   acciones .  Matrix Arrow Indicator MT5  determinará la tendencia actual en sus primeras etapas, recopilando información y datos de hasta 10 indicadores estándar, que son: Índice de movimiento direccional promedio (ADX) Índice de canales de prod
IX Power MT5
Daniel Stein
5 (3)
IX Power   lleva por fin la insuperable precisión de FX Power a los símbolos que no son de Forex. Determina con exactitud la intensidad de las tendencias a corto, medio y largo plazo de tus índices, acciones, materias primas, ETF e incluso criptodivisas favoritas. Puede   analizar todo lo   que su terminal le ofrece. Pruébalo y experimenta cómo   tu timing mejora significativamente   a la hora de operar. Características principales de IX Power Resultados de cálculo 100% precisos y sin rep
Bill Williams Advanced
Siarhei Vashchylka
5 (7)
Bill Williams Advanced is designed for automatic chart analysis using Bill Williams' "Profitunity" system. The indicator analyzes four timeframes at once. Manual (Be sure to read before purchasing) Advantages 1. Automatically analyzes the chart using the "Profitunity" system of Bill Williams. The found signals are placed in a table in the corner of the screen. 2. Equipped with a trend filter based on the Alligator indicator. Most of the system signals are recommended to be used only accordi
Auto Order Block with break of structure based on ICT and Smart Money Concepts (SMC) Futures Break of Structure ( BoS )             Order block ( OB )            Higher time frame Order block / Point of Interest ( POI )    shown on current chart           Fair value Gap ( FVG ) / Imbalance   -  MTF      ( Multi Time Frame )    HH/LL/HL/LH  -  MTF      ( Multi Time Frame )  Choch  MTF      ( Multi Time Frame )  Volume Imbalance     ,  MTF          vIMB Gap’s Power of 3 Equal High
Este tablero muestra los últimos   patrones armónicos   disponibles para los símbolos seleccionados, por lo que ahorrará tiempo y será más eficiente /   versión MT4 . Indicador gratuito:   Basic Harmonic Pattern Columnas del indicador Symbol:   aparecerán los símbolos seleccionados Trend :   alcista o bajista Pattern :   tipo de patrón (gartley, mariposa, murciélago, cangrejo, tiburón, cifrado o ABCD) Entry :   precio de entrada SL:   precio de stop loss TP1:   1er precio de toma de benefici
Introduciendo       Quantum Breakout PRO   , el innovador indicador MQL5 que está transformando la forma en que comercia con Breakout Zones. Desarrollado por un equipo de comerciantes experimentados con experiencia comercial de más de 13 años,       Desglose cuántico PRO       está diseñado para impulsar su viaje comercial a nuevas alturas con su innovadora y dinámica estrategia de zona de ruptura. El indicador de ruptura cuántica le dará flechas de señal en las zonas de ruptura con 5 zonas
Legacy of Gann for MT5
Pavel Zamoshnikov
5 (6)
The indicator very accurately determines the levels of the possible end of the trend and profit fixing. The method of determining levels is based on the ideas of W.D.Gann, using an algorithm developed by his follower Kirill Borovsky. Extremely high reliability of reaching levels (according to K. Borovsky  - 80-90%) Indispensable for any trading strategy – every trader needs to determine the exit point from the market! Precisely determines targets on any timeframes and any instruments (forex, met
SMCpro
Arief
5 (1)
Currently Price  20% OFF  ( for unlimited use ) Indicator   USER MANUAL , trade setups, solving issues, etc :  Direct Download Here     (  for users only  ) Hello World! Introducing.. SMCpro tool and Indicator for  MetaTrader 5 , a cutting-edge feature designed to revolutionize your trading experience. With innovative ICT Smart Money Concept, you gain unparalleled insight into market dynamics, empowering you to make informed trading decisions like never before. SMC Indicator built on th
Black Dragon indicator mt5
Ramil Minniakhmetov
4.83 (58)
El indicador de detección de tendencias complementará cualquier estrategia y también se puede utilizar como una herramienta independiente. Ventajas Fácil de usar, no sobrecarga el gráfico con información innecesaria; Puede usarse como filtro para cualquier estrategia; Tiene niveles integrados de soporte y resistencia dinámicos, que se pueden usar tanto para obtener ganancias como para establecer límites de pérdidas; El indicador no cambia de color después de que se cierra la vela;  Funciona
Gartley Hunter Multi
Siarhei Vashchylka
5 (7)
Gartley Hunter Multi - An indicator for searching for harmonic patterns simultaneously on dozens of trading instruments and on all possible timeframes. Manual (Be sure to read before purchasing) | Version for MT4 Advantages 1. Patterns: Gartley, Butterfly, Shark, Crab. Bat, Alternate Bat, Deep Crab, Cypher 2. Simultaneous search for patterns on dozens of trading instruments and on all possible timeframes 3. Search for patterns of all possible sizes. From the smallest to the largest 4. A
Volume by Price MT5
Brian Collard
4.2 (5)
The Volumebyprice.com Indicator for MetaTrader 5 features Volume Profile and Market Profile TPO (Time Price Opportunity). Volume and TPO histogram bar and line charts. Volume Footprint charts. TPO letter and block marker collapsed and split structure charts. Static, dynamic and flexible range segmentation and compositing methods with relative and absolute visualizations. Session hours filtering and segment concatenation with Market Watch and custom user specifications. Graphical layering, posit
Otros productos de este autor
Market Structures MT4
Andrei Novichkov
4.33 (3)
The Market Structures MT4 indicator finds and shows the Break Of Structures (BoS) pattern on the chart. The pattern is an important part of the Smart Money Concepts (SMC) system. The appearance of a pattern means that the price breaks the last peak of an uptrend, or the last bottom of a downtrend. This indicates a change in the existing trend structure and the beginning of a new movement. BOS is a technical analysis tool used to identify trend reversals. The set of input parameters is simple
FREE
The "VSA on the FLY" indicator is designed to quickly display various Volume Profile / Market Profile parameters.. The indicator takes the initial data for operation from the M1 timeframe. The indicator is installed on any timeframe and starts displaying data starting from the selected left border. This can be the beginning of a day, a week, a trading session, any hour, etc. The version of this indicator for MetaTrader 4 can be found here . The following input parameters are available: Show
GridShowAverageMT5
Andrei Novichkov
4 (3)
For any number of placed market and pending orders, the utility calculates the "breakeven level" - weighted average price. The calculation is performed individually for buy and sell orders. The weighted average price is marked with a label and colored horizontal line separately as well - one line for the buy price, and the other for sell price. Input Parameters: Include pending. Include the pending orders in calculation. The default value of this parameter is false, and the calculation of the
FREE
CloneChartMT5
Andrei Novichkov
5 (1)
This utility clones the chart it is running on. It opens the same chart with the same graphical objects, set of indicators (saving the parameters) and the rest of the elements. In essence, it performs a deep copying of the original chart, transferring the template to the opened chart. The symbol and the timeframe of the original chart are also saved.
FREE
CloneChartMT4
Andrei Novichkov
5 (2)
This utility clones the chart it is running on. It opens the same chart with the same graphical objects, set of indicators (saving the parameters) and the rest of the elements. In essence, it performs a deep copying of the original chart, transferring the template to the opened chart. The symbol and the timeframe of the original chart are also saved.
FREE
The script allows to use the mouse for placing a grid of orders with fixed or variable step quickly and with as few mistakes as possible. Drag the script to the chart using the left mouse button and release. The grid will be plotted starting from that point. If the current price is lower than the grid start point, the grid will be placed "to the north" towards the buys, and if higher - towards the sells, "to the south". Setting take profit and stop loss is left to trader's discretion. Input Pa
Модифицируйте тейк профит и стоп лосс сети ордеров с помощью мыши. Перетащите скрипт на график левой кнопкой мыши и отпустите. Скрипт выставляет всем рыночным и отложенным ордерам раздельно, единый стоп лосс и единый тейк профит, используя величину цены в точке окончания перетаскивания. Входные параметры Buy or sell - Ордера какого типа подлежат модификации. Возможны два варианта: All BUY - все ордера на покупку All SELL - все ордера на продажу По умолчанию значение этого параметра All BUY. Wh
If a complex grid with specified stop loss and take profit levels has been created in the wrong place by mistake, it is not necessary to remove it and start over again. The grid can be moved to a new place using the mouse. Drag the script to the chart and drop it where the grid should be moved. The grid will be moved, keeping the distance between orders, distances to stop loss and take profit. The script works exclusively with pending orders , market orders will be left unchanged. Input Parame
The "VSA on the FLY" indicator is designed to quickly display various Volume Profile / Market Profile parameters.. The indicator takes the initial data for operation from the M1 timeframe. The indicator is installed on any timeframe and starts displaying data starting from the selected left border. This can be the beginning of a day, a week, a trading session, any hour, etc. The version of this indicator for MetaTrader 5 can be found here . The following input parameters are available: Show
"Scalper Channel MT4" is a modern channel indicator that shows the trader the direction of the trade. For work, the indicator uses built-in and proprietary technical means and a new secret formula. Load it on the chart and the indicator will show you the entry direction in color: If the upper limit of the price channel of the indicator is blue, open a buy position. If the lower limit of the price channel of the indicator is red, open a sell position. If the border of the indicator is gray, ne
Indicator ICT Implied Fair Value Gap (IFVG) is an important part of the Smart Money Concepts (SMC) system. It looks for and shows on the chart a modern pattern - the Fair Value Gap ( FVG ). This pattern is a three candlestick imbalance formation based on the discovery of a mismatch between supply and demand. This happens when the price moves quickly in one direction without encountering resistance. The result is a "gap", which can be filled in later. The indicator finds this pattern using the up
The Market Structures Pro indicator finds and displays 5 (five) patterns of the Smart Money Concepts (SMC) system on the chart, namely: Break Of Structures (BoS)       Change of character (CHoCH) Equal Highs & Lows Premium, Equilibrium and Discount zones with Fibo grid High-high, Low-low, High-low and Low-high extremes Patterns are displayed for two modes - Swing and Internal and are easily distinguished by color on the chart. Internal mode features higher contrast colors, finer lines, and sm
Our new indicator is an important part of the Smart Money Concepts (SMC) system It uses a modern market vision and fast calculation methods. As a result, the trader has a complete picture of the trade at every moment in time, which makes the process of obtaining results easier and faster. Our new indicator displays the following important patterns:   Order Blocks. Imbalance – Fair Value Gap (FVG). Break Of Structures (BoS). Change of character (CHoCH). Equal highs & lows. Premium , Equili
The script allows to use the mouse for placing a grid of orders with fixed or variable step quickly and with as few mistakes as possible. Drag the script to the chart using the left mouse button and release. The grid will be plotted starting from that point. If the current price is lower than the grid start point, the grid will be placed "to the north" towards the buys, and if higher - towards the sells, "to the south". Setting take profit and stop loss is left to trader's discretion. Input Pa
Modify the take profit and stop loss of orders grid using the mouse. Drag the script to the chart using the left mouse button and release. The script sets a single stop loss and take profit to all positions and pending orders separately, using the price value at the final point of dragging. Input Parameters Buy or sell - the type to be modified. There are two options: All BUY - all buy orders and positions (this parameter is set to All BUY by default.) All SELL - all sell orders and positions
If a complex grid with specified stop loss and take profit levels has been created in the wrong place by mistake, it is not necessary to remove it and start over again. The grid can be moved to a new place using the mouse. Drag the script to the chart and drop it where the grid should be moved. The grid will be moved, keeping the distance between orders, distances to stop loss and take profit. The script works exclusively with pending orders , market orders will be left unchanged. Input Parame
"Scalper Channel MT5" is a modern channel indicator that shows the trader the direction of the trade. For work, the indicator uses built-in and proprietary technical means and a new secret formula. Load it on the chart and the indicator will show you the entry direction in color: If the upper limit of the price channel of the indicator is blue, open a buy position. If the lower limit of the price channel of the indicator is red, open a sell position. If the border of the indicator is gray, ne
Indicator ICT Implied Fair Value Gap (IFVG) is an important part of the Smart Money Concepts (SMC) system. It looks for and shows on the chart a modern pattern - the Fair Value Gap ( FVG ). This pattern is a three candlestick imbalance formation based on the discovery of a mismatch between supply and demand. This happens when the price moves quickly in one direction without encountering resistance. The result is a "gap", which can be filled in later. The indicator finds this pattern using the up
The Market Structures Pro indicator finds and displays 5 (five) patterns of the Smart Money Concepts (SMC) system on the chart, namely: Break Of Structures (BoS)       Change of character (CHoCH) Equal Highs & Lows Premium, Equilibrium and Discount zones with Fibo grid High-high, Low-low, High-low and Low-high extremes Patterns are displayed for two modes - Swing and Internal and are easily distinguished by color on the chart. Internal mode features higher contrast colors, finer lines, and sm
Our new indicator is an important part of the Smart Money Concepts (SMC) system It uses a modern market vision and fast calculation methods. As a result, the trader has a complete picture of the trade at every moment in time, which makes the process of obtaining results easier and faster. Our new indicator displays the following important patterns:   Order Blocks. Imbalance – Fair Value Gap (FVG). Break Of Structures (BoS). Change of character (CHoCH). Equal highs & lows. Premium , Equili
Filtro:
zhui meng
63
zhui meng 2024.06.15 17:26 
 

El usuario no ha dejado ningún comentario para su valoración

Cappuccinono
93
Cappuccinono 2024.06.15 17:16 
 

El usuario no ha dejado ningún comentario para su valoración

Seth Tetteh
1313
Seth Tetteh 2024.04.25 11:54 
 

cool

Chispa2023
64
Chispa2023 2024.04.21 14:57 
 

Excelente.

Slavcho Mitrovski
18
Slavcho Mitrovski 2024.02.01 07:10 
 

So Kann Mann Trend leicht bestimmen.

Detleff Böhmer
2625
Detleff Böhmer 2023.12.07 07:00 
 

Gut gemacht, sehr guter Indikator.

CodeFaceCrunch
151
CodeFaceCrunch 2023.10.09 05:01 
 

The indicator is very useful. My only concern is the pointing arrow. Would it be possible for you to remove the arrow and let the lines do their job? It is cleaner to see.

Andrei Novichkov
23391
Respuesta del desarrollador Andrei Novichkov 2023.10.09 22:43
Yes, the arrow can be removed. Maybe I'll make a version like this and post it on my profile.
MAKARIOS YACOUBIAN
2901
MAKARIOS YACOUBIAN 2023.09.22 21:49 
 

El usuario no ha dejado ningún comentario para su valoración

R SELVA
18
R SELVA 2023.09.21 08:04 
 

no words ji great great great

Andrei Novichkov
23391
Respuesta del desarrollador Andrei Novichkov 2023.09.21 10:18
Thank you very much)
Respuesta al comentario
Versión 1.30 2024.01.21
The algorithm has been refined and improved
Versión 1.20 2023.12.06
Исправлена внутренняя ошибка
Versión 1.10 2023.12.06
1. Added alerts about pattern breakout. Available: text messages, sound messages, notifications to a smartphone and email.
2. Internal algorithms have been optimized.