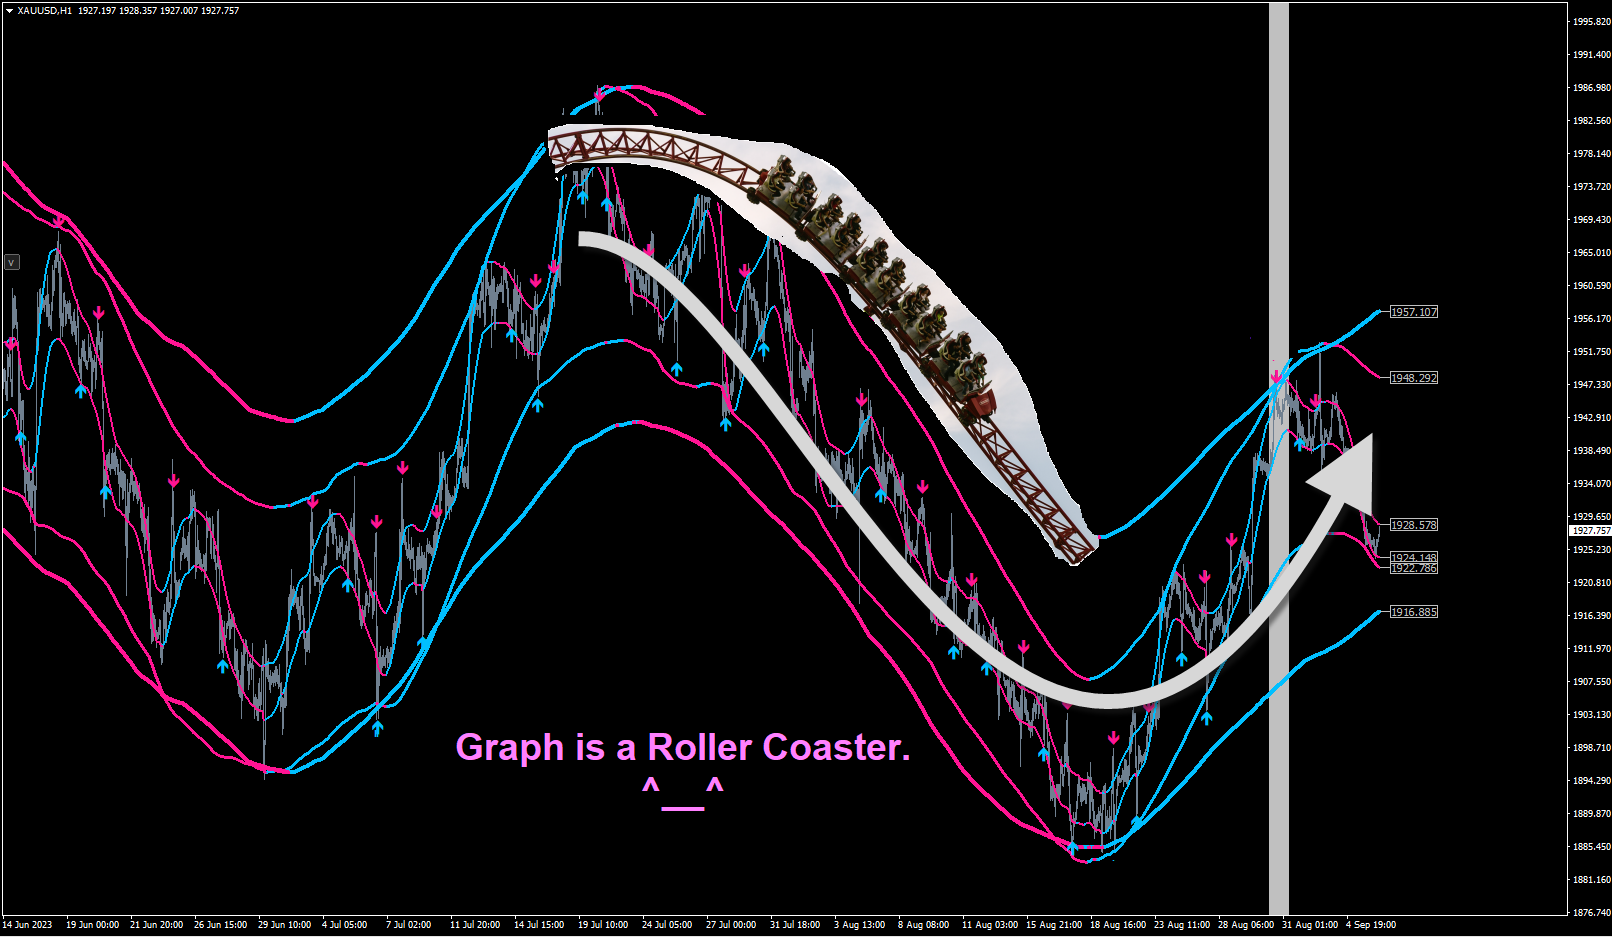
• Información general
  • Comentarios
  • Discusión
  • Novedades

MT Roller Coaster


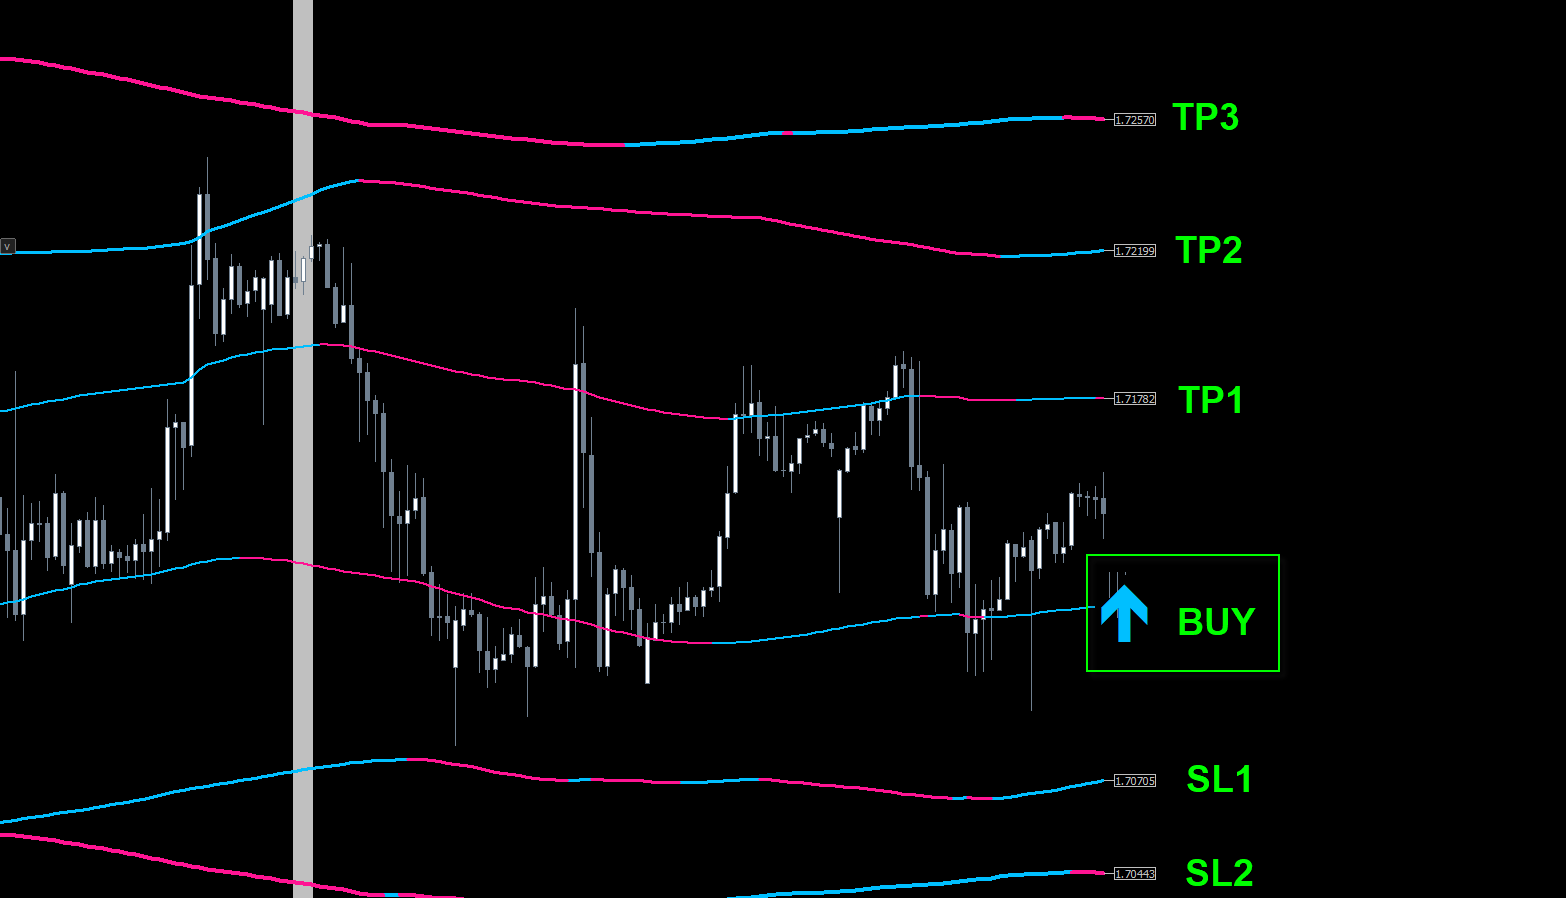
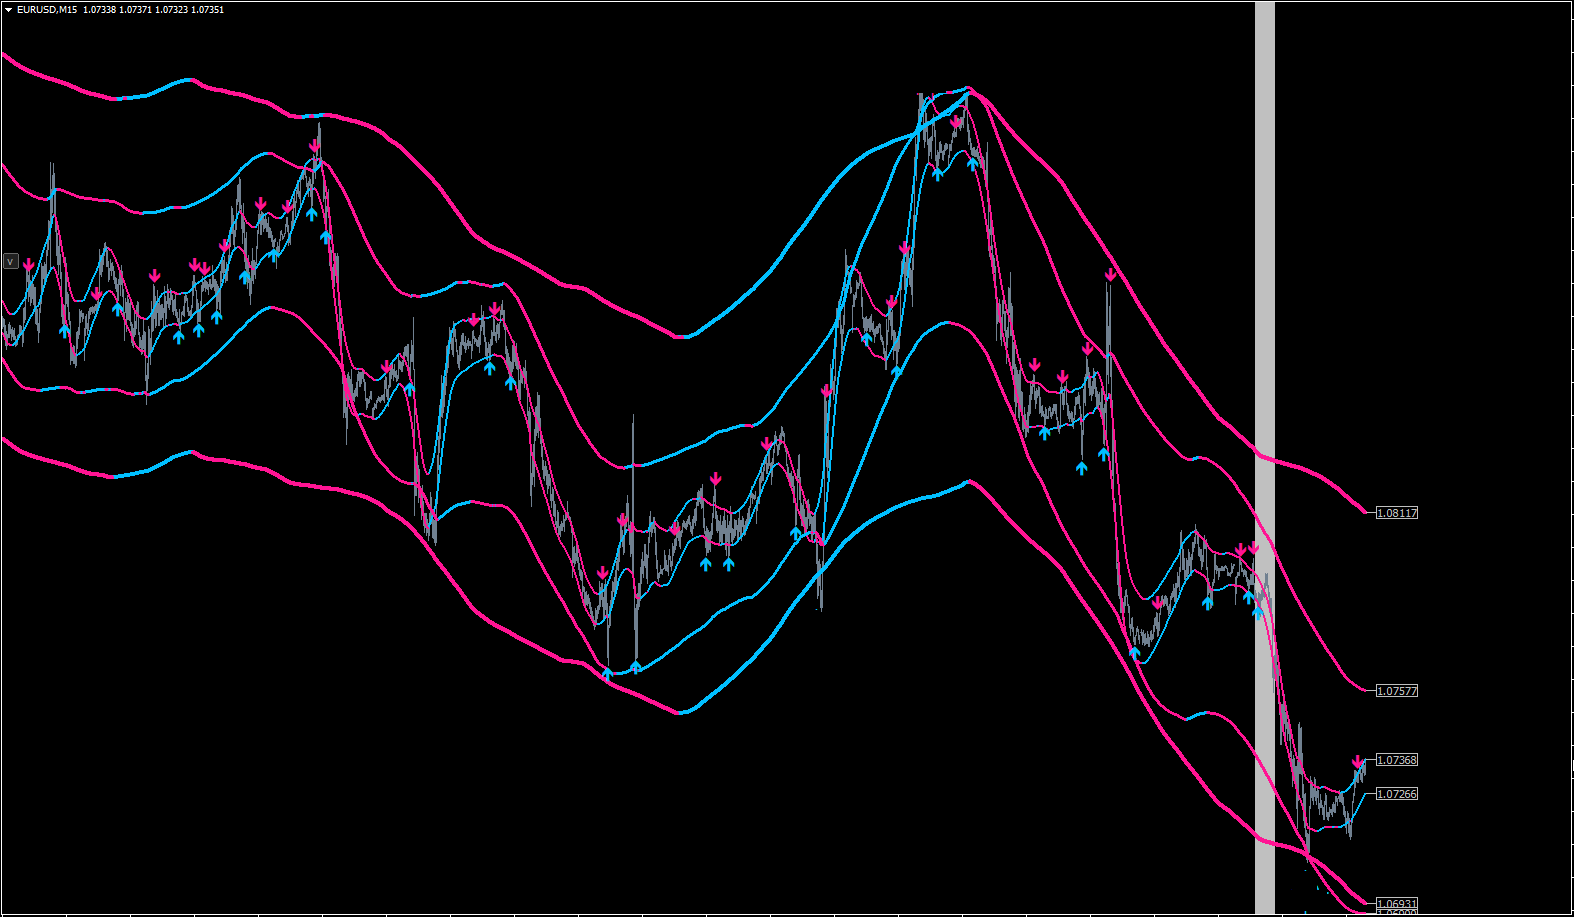
Graph's roller-coaster

MT Roller Coaster :

Inspired by the graph's roller-coaster-like movement, this tool uses color bands to signal trends effectively.

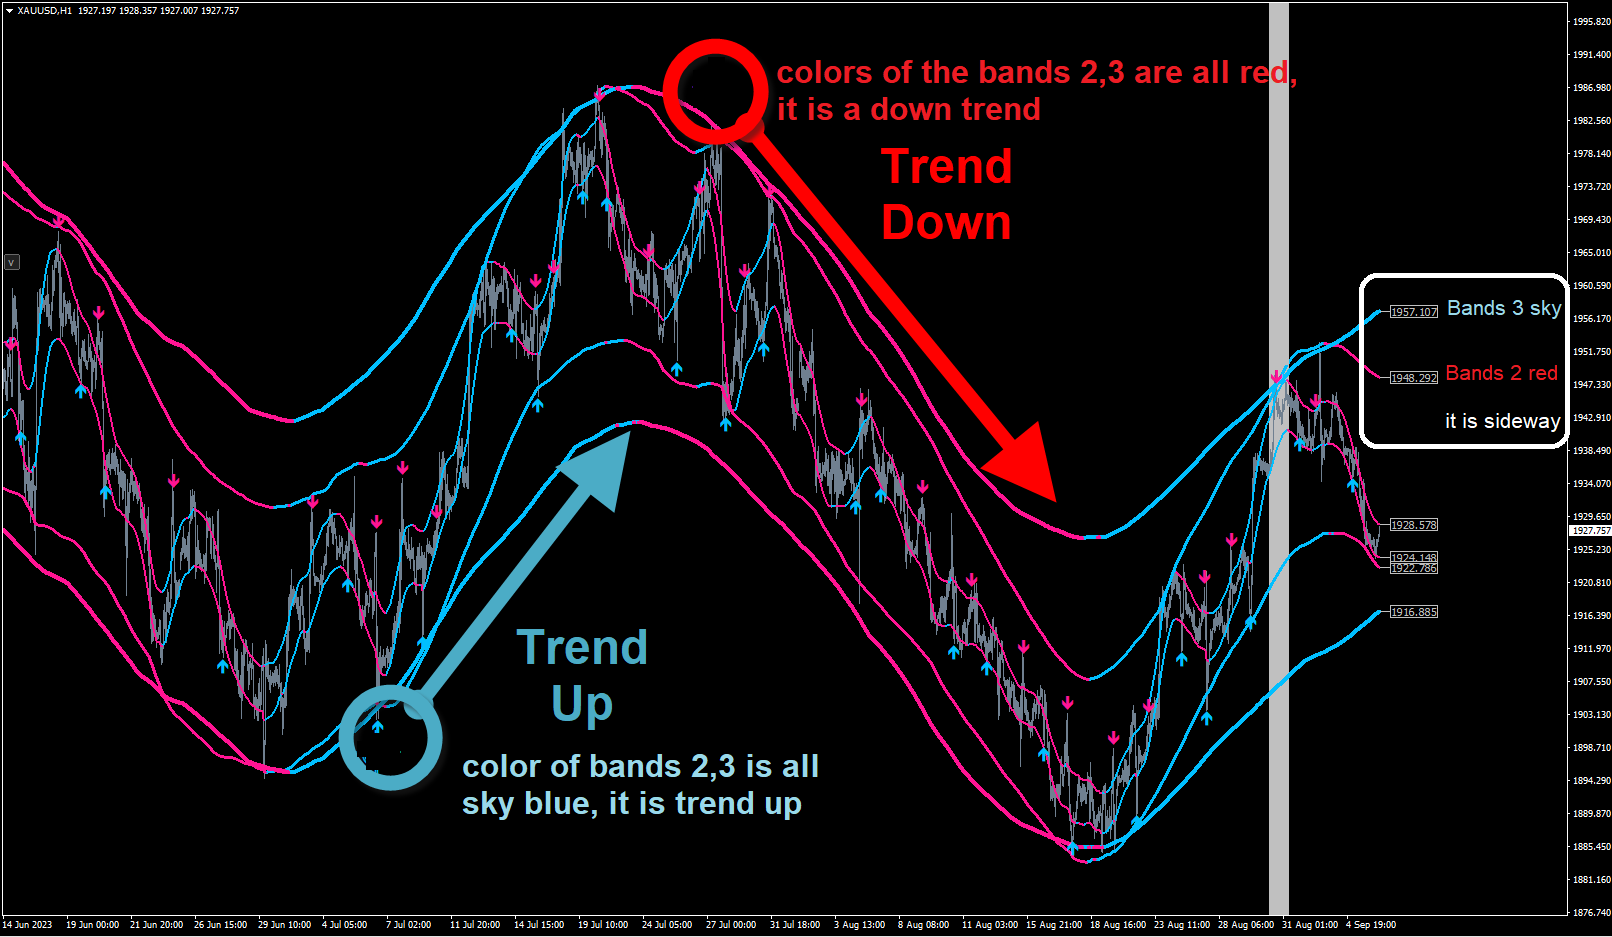
The band colors simplify order decisions:

Downtrend: Bands 2 and 3 turn red, signaling sell opportunities.

Uptrend: Bands 2 and 3 appear sky blue, suggesting buy orders.

Sideways: Alternating band colors allow both buy and sell trades, suitable for scalping strategies.

Major trend entries are identified at the outer bands, with correct Stop Loss placement critical to avoiding false trend reversals.

Suitable for all experience levels, emphasizing sound money management.

Indicator for traders who prefer manual trading.

Required PC high performance


TRADE & TIME FRAME:  Forex H1

SYMBOL PAIR: All Symbol


SETTINGS:

CALCULATE BARS: Value or bars used must be large enough to calculate the formula. 
FOCUS HISTORY BARS: Focus points make it easier to see trends.

SIGNAL LEVEL: There are 5 levels to choose : Very Fast (Very Aggressive), Fast (Aggressive), Normal (Medium), Slow (Safe) and Very Slow (Very Safe)        
                       signals uses our secret formula to perform complex calculations to get good results.

BANDS: Set all 3 bands: Period, Multipier and Recalculate. 

ANALYSIS PROFIT: Accept value that is greater than ...point, If the value is less, it is considered a lose. (calculate by calculate_bars)
                           Allows you to calculate the probability of making a profit next time.

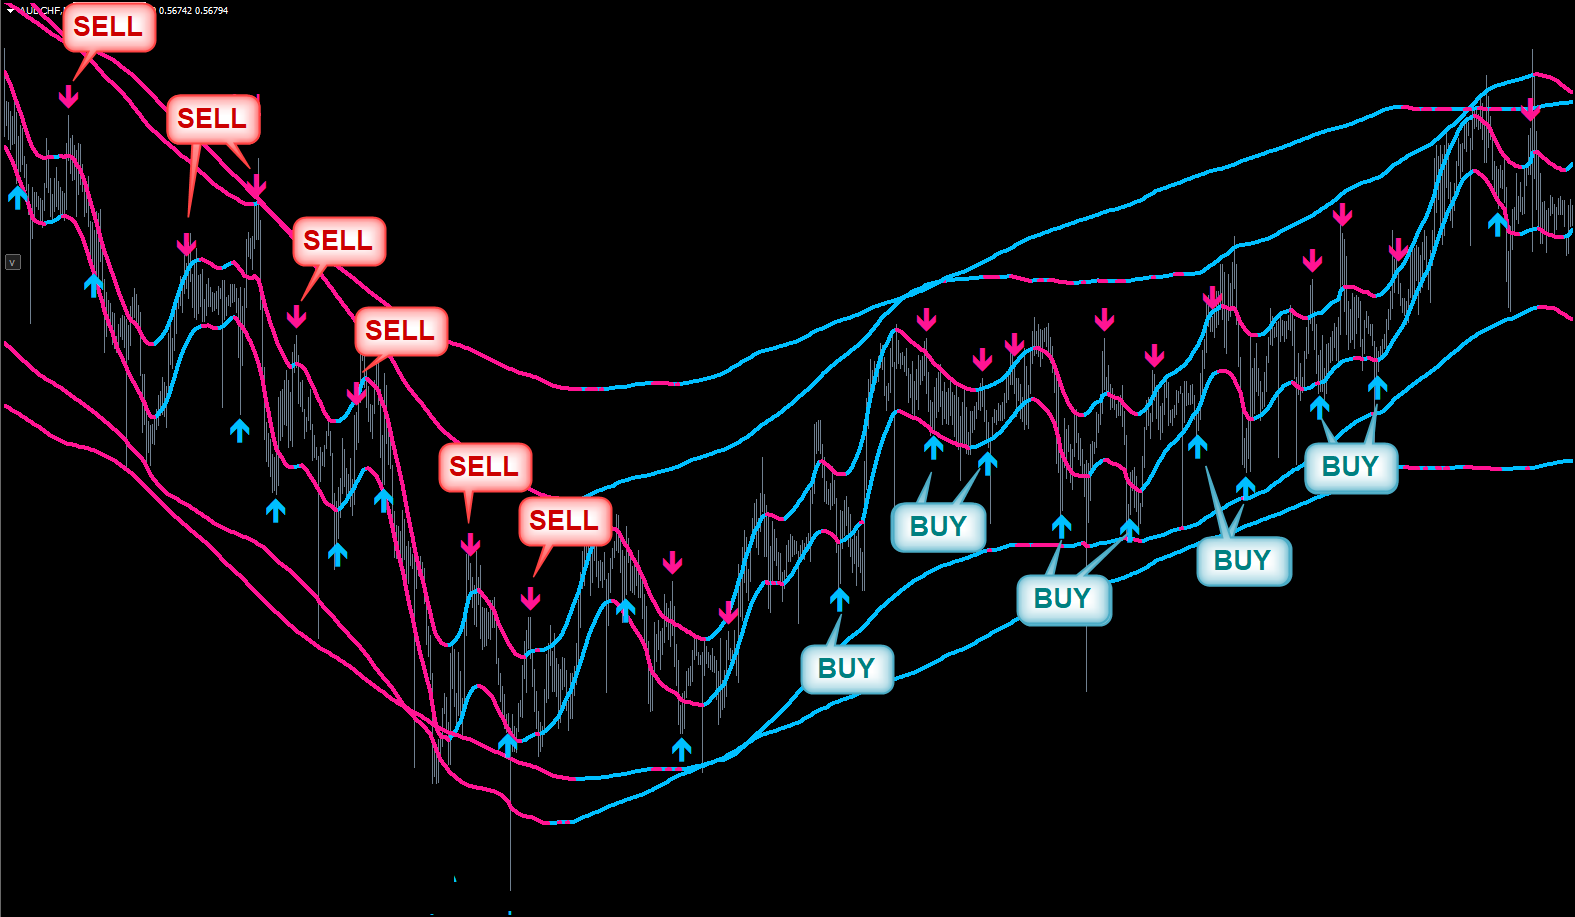
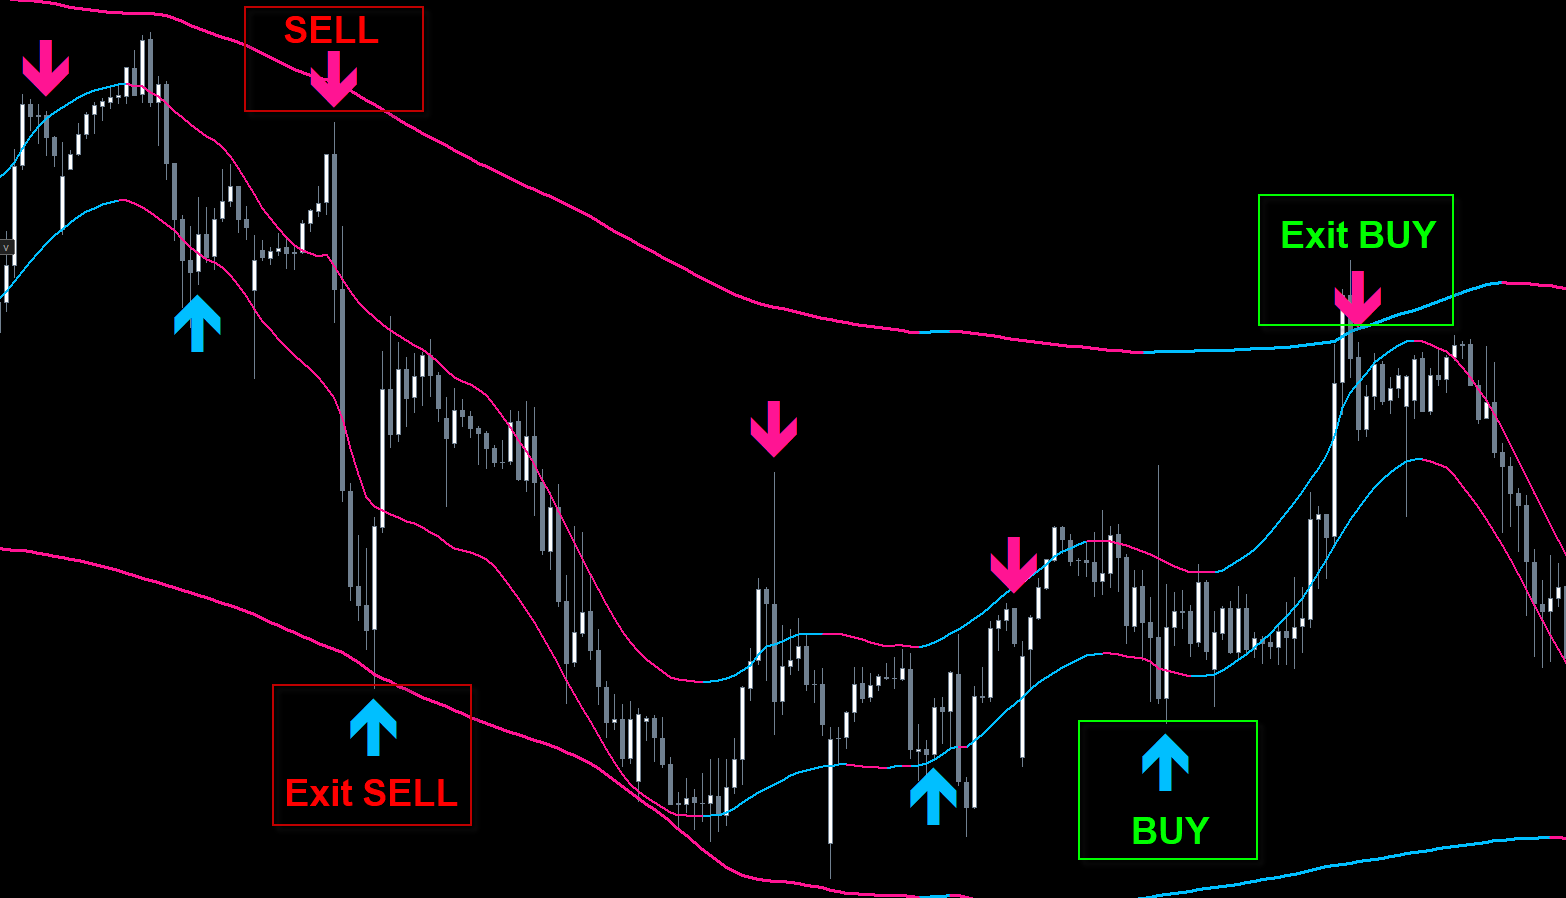
ALERT SIGNALS AND ALERT: Popup, Mobile, Sound (Arrow and Alert after close candle) 
                Alert_Type:  Buy & Sell, Buy only and Sell only. 

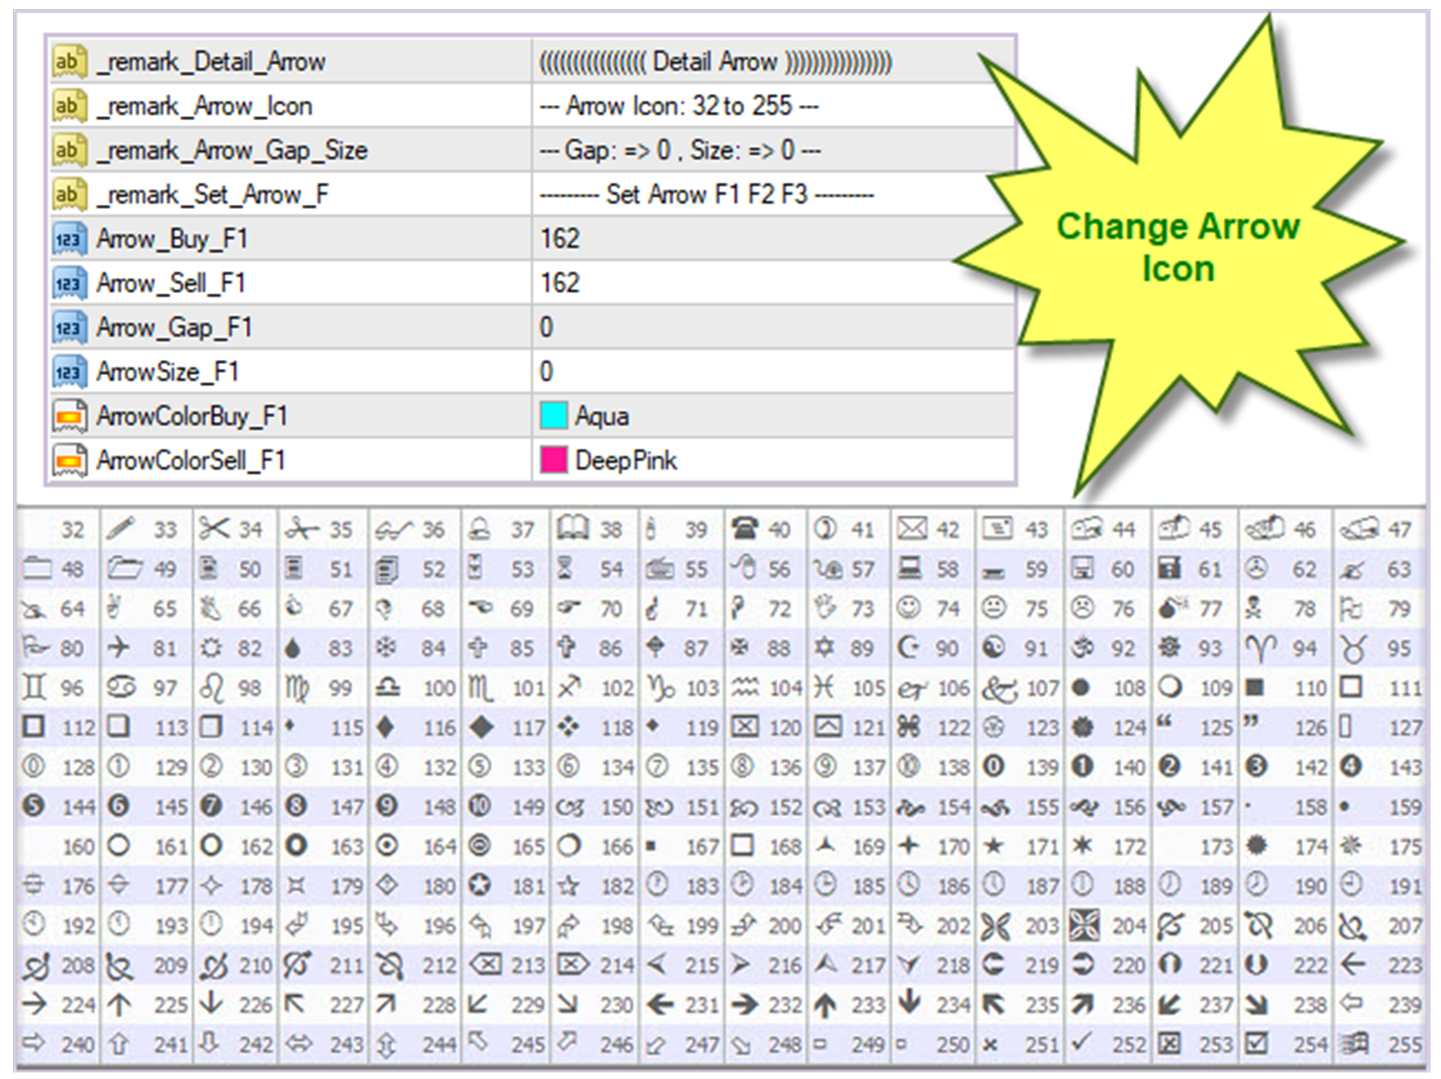
DETAIL ARROW: Refine the arrow details in the display. Change Arrow: Icon, Gap, Size and Color
                        (***** Signals : No repaint, No redraw*****)

For the backtest has to run through a lot of bars >3,000 bars for bands 3 to set form. 

----------------------------------------------------------------------------
Business Hours: Monday to Friday, 10:00 a.m. to 3:00 p.m.
Feel free to reach out for any additional details or assistance!
Productos recomendados
The indicator detects and displays Shark harmonic pattern (see the screenshot). The pattern is plotted by the extreme values of the ZigZag indicator (included in the resources, no need to install). After detecting the pattern, the indicator notifies of that by a pop-up window, a mobile notification and an email. The indicator highlights the process of the pattern formation and not just the complete pattern. In the former case, it is displayed in the contour triangles. After the pattern is comple
Indicador Crypto_Forex HTF Ichimoku para MT4. - El indicador Ichimoku es uno de los indicadores de tendencia más poderosos. HTF significa "marco temporal superior". - Este indicador es excelente para los operadores de tendencias, así como para combinarlo con entradas de acción del precio. - El indicador HTF Ichimoku le permite adjuntar Ichimoku de un marco temporal superior a su gráfico actual. - Tendencia ascendente: línea roja sobre la azul (y ambas líneas están sobre la nube) / Tendencia de
Market Structure Zig Zag
Lesedi Oliver Seilane
4.63 (27)
Free Market structure zig zag to assist in price action trading the screenshots describe how to use and how to spot patterns new version comes with alerts, email alert and  push notification alert can be used on all pairs  can be used on all timeframes  you can add additional confirmation indicators the indicator shows you your higher high and low highs as well as your lower lows and lower highs  the indication makes price action analysis easier to spot.
FREE
Binary Options Support Resistance Indicator This indicator is designed for binary options trading and effectively shows retracements from support and resistance levels. Signals appear on the current candle. A red arrow pointing downwards indicates a potential selling opportunity, while a blue arrow pointing upwards suggests buying opportunities. All that needs adjustment is the color of the signal arrows. It is recommended to use it on the M1-M5 timeframes as signals are frequent on these timef
Los indicadores [ZhiBiCCI] son ​​adecuados para todos los ciclos de uso y también son adecuados para todas las variedades de mercado. [ZhiBiCCI] La línea verde sólida es una reversión de la divergencia alcista. La línea de puntos verde es una divergencia alcista clásica. [ZhiBiCCI] La línea continua hacia el rojo es una divergencia bajista inversa. La línea roja punteada es una divergencia bajista clásica. [ZhiBiCCI] puede configurarse en los parámetros (Alerta, Enviar correo, Enviar notifica
The indicator detects and displays 3 Drives harmonic pattern (see the screenshot). The pattern is plotted by the extreme values of the ZigZag indicator (included in the resources, no need to install). After detecting the pattern, the indicator notifies of that by a pop-up window, a mobile notification and an email. The indicator highlights the process of the pattern formation and not just the complete pattern. In the former case, it is displayed in the contour triangles. After the pattern is com
Trend Oscillator es un indicador avanzado personalizado de Crypto_Forex, ¡una herramienta de trading eficiente! - Se utiliza un nuevo método de cálculo avanzado: 20 opciones para el parámetro "Precio para el cálculo". - El oscilador más suave jamás desarrollado. - Color verde para tendencias alcistas, color rojo para tendencias bajistas. - Valores de sobreventa: por debajo de 5, valores de sobrecompra: por encima de 95. - Hay muchas oportunidades para mejorar incluso las estrategias estándar c
Th3Eng signals wave is a very good indicator to read the trend. But you need to filter the main trend direction with your own strategy. Because this indicator signals are repainted. So for example: Use Moving average 21 to find the trend and if the price is above the moving on higher TF or the current >> open only buy signals from the indicator. Also you can use it on option trading, Not only on forex. Works with all time-frames. works with all pairs, CFD and cryptocurrency. Sending all alertin
FREE
Easy RSI Alerts
Luke Kendall
5 (1)
The Relative Strength Index (RSI) was developed by J. Welles Wilder and is a momentum oscillator that identifies overbought and oversold conditions. It is also a popular choice for many traders helping them find entries into the market. How it Works The simplest way to use the Relative Strength Index is to wait for an overbought or oversold condition and then enter into a trade when the RSI indicates that price is resuming in the dominant direction of the trend. Buy signals : For the first cond
Good Signal
Yaroslav Varankin
The indicator is designed for binary options and short-term transactions on Forex To enter a trade when a signal appears blue up arrow buy red down arrow sell signal For Forex enter on a signal exit on the opposite signal or take profit For binary options Enter on 1 candle, if the deal goes negative, set a catch on the next candle Works on all timeframes If you apply a filter like Rsi, you will get a good reliable strategy.. The algorithm is at the stage of improvement and will be further develo
This is a combination of multiple oscillators into a single divergence system that creates the impression of a more reliable divergence indicator. It is multi-currency based and works best on 15 minutes timeframe and above. Every time a signal is generated, it shows an alert to the user. It is more ideal if combined with other price action indicators or trading systems.
Owl smart levels
Sergey Ermolov
4.24 (37)
Versión MT5  |   FAQ El   Indicador Owl Smart Levels   es un sistema comercial completo dentro de un indicador que incluye herramientas de análisis de mercado tan populares como   los fractales avanzados de Bill Williams , Valable ZigZag que construye   la estructura de onda correcta   del mercado y   los niveles de Fibonacci   que marcan los niveles exactos de entrada. en el mercado y lugares para tomar ganancias. Descripción detallada de la estrategia Instrucciones para trabajar con el indi
Indicador Crypto_Forex "Histograma de Corrección de Tendencia Principal" para MT4, sin repintado. - El indicador de Histograma de Corrección de Tendencia Principal fue diseñado para detectar grandes tendencias. - El indicador puede mostrarse en dos colores: rojo para tendencia bajista y azul para alcista (los colores se pueden cambiar). - Al menos 10 columnas consecutivas del mismo color en el histograma indican el inicio de una nueva tendencia. - El indicador cuenta con alertas integradas par
VR Cub
Vladimir Pastushak
VR Cub es un indicador para obtener puntos de entrada de alta calidad. El indicador fue desarrollado para facilitar los cálculos matemáticos y simplificar la búsqueda de puntos de entrada a una posición. La estrategia comercial para la cual se diseñó el indicador ha demostrado su eficacia durante muchos años. La simplicidad de la estrategia comercial es su gran ventaja, que permite que incluso los operadores novatos negocien con éxito con ella. VR Cub calcula los puntos de apertura de posiciones
MACD Signals Dashboard
Mihails Babuskins
4 (4)
Download directly the indicator file here. (if you can't open on MT4) MACD Indicator is one of the most popular momentum indicators among users. Searching and detecting MACD signals by the eye may not be easy. Scan Full Charts Dashboard Indicator with simple user interface and search customization panel saves time and scans all charts for MACD signals search and notifies the user with high accuracy. After finding the signal, the user was aware of the result by alerts and notifications. This ind
FREE
A top-quality implementation of the famous Super Trend indicator, which needs no introduction. It is completely loyal to the original algorithm, and implements many other useful features such as a multi-timeframe dashboard.  [ Installation Guide | Update Guide | Troubleshooting | FAQ | All Products ] Easy to trade It implements alerts of all kinds It implements a multi-timeframe dashboard It is non-repainting and non-backpainting Input Parameters ATR Period - This is the average true range perio
FREE FOR A LIMITED TIME ONLY!!! The Ultimate Indicator For Trading Trend This indicator clearly shows you the strength of the market in one direction or the other, which means that you can trade knowing you are either with or against the market. When used in conjunction with the +3R principles you are sure to have some serious results. The +3R Principles Routine - This is when you trade and how often  Rules - This is the rule you follow  Risk:Reward - This is the percentage amount of your accoun
The MACD offers the best of both worlds: trend following and momentum. Traders can look for signal line crossovers, center-line crossovers and divergences to generate signals. Because the MACD is unbounded, it is not particularly useful for identifying overbought and oversold levels. It is not easy to use any indicator on smaller timeframes because traders cannot not look away from the screen. This classical indicator includes "Alert" function (see screenshots). Keep in mind that this indicator
Trend PA
Mikhail Nazarenko
5 (3)
The Trend PA indicator uses   Price Action   and its own filtering algorithm to determine the trend. This approach helps to accurately determine entry points and the current trend on any timeframe. The indicator uses its own algorithm for analyzing price changes and Price Action. Which gives you the advantage of recognizing, without delay, a new nascent trend with fewer false positives. Trend filtering conditions can be selected in the settings individually for your trading style. The indicator
SuperTrend V
Muhammad Hassaan
*This is TradingView indicator converted to mql4* The SuperTrend V indicator is a popular technical analysis tool used to identify trends and potential trend reversals in financial markets. It is based on the concept of the SuperTrend indicator but incorporates additional features and variations. The SuperTrend V indicator uses a combination of price action and volatility to determine the trend direction and generate trading signals. Here are the key components and features of the indicator: Ca
ADX Pointer
Dominik Mandok
ADX Pointer is an indicator which is based on "Average Directional Index" and draws three numbers in chart window depending on the value of ADX. In ADX Pointer you can set "ADX_Period" which is of course period of Average Directional Index and you can also set 3 levels. When ADX value exceed first level ("ADX_Level1") in chart window appears number "1", when ADX exceed second level ("ADX_Level2") appears "2" and when ADX exceed third level ("ADX_Level3") appears "3". Simple. ADX Pointer works on
The CCI Divergence is a reasonably useful indicator in itself, but it is even more effective when used with divergence pattern trading. The CCI Divergence indicator signal is one of the most potent signals among the indicators that exist in the market. Here is new version for Divergence Indicator using CCI method, with more improvements. Divergences indicate a potential investment point because the directional moment does not confirm the price. A bullish divergence occurs when the underlying va
LordAutoFibonnaci
Igor Pereira Calil
5 (2)
Lord Auto Fibonnaci is a free indicator for Meta Trader, in order to show the most famous chart in the financial market known as "Fibonnaci". As we can see in the images below, the fibonnaci table will automatically analyze the graph for you, with trend factors through percentage, almost infallible use, you can always work when the percentage is low or high, start shopping and sales on time, great for analyzing entries! In the images below we can see an example in gold in H4, where we are at
FREE
The   Fibonacci Confluence Toolkit   is a technical analysis tool designed to help traders identify potential price reversal zones by combining key market signals and patterns. It highlights areas of interest where significant price action or reactions are anticipated, automatically applies Fibonacci retracement levels to outline potential pullback zones, and detects engulfing candle patterns. Its unique strength lies in its reliance solely on price patterns, eliminating the need for user-define
El indicador "Auto FIBO Pro" de Crypto_Forex es una gran herramienta auxiliar para operar. - El indicador calcula y coloca automáticamente en el gráfico los niveles de Fibonacci y las líneas de tendencia locales (color rojo). - Los niveles de Fibonacci indican áreas clave donde el precio puede revertirse. - Los niveles más importantes son 23,6 %, 38,2 %, 50 % y 61,8 %. - Puede usarlo para scalping de reversión o para operar en cuadrículas de zonas. - También existen muchas oportunidades para m
The Range Directional Force Indicator is designed to help traders analyze market trends, reversals, and directional strength. It focuses on price movements within defined ranges, identifying key moments when the market is gaining momentum or preparing for a shift. By dividing the chart into dynamic price ranges, the indicator detects critical support and resistance levels. It calculates the directional force of price movements, highlighting potential entry and exit points based on market sentim
EZZ Elite Zig Zag is an indicator for the MetaTrader 4 terminal. This indicator traces the peak of the trend based on the market reversal, thus showing various opportunities in the financial market. EZZ Elite Zig Zag is a visual tool, intuitive, and easy to understand and use.  Test it Yourself by Downloading it for Free. Author Paulo Rocha all rights reserved
MetaCOT 2 is a set of indicators and specialized utilities for the analysis of the U.S. Commodity Futures Trading Commission reports. Thanks to the reports issued by the Commission, it is possible to analyze the size and direction of the positions of the major market participants, which brings the long-term price prediction accuracy to a new higher-quality level, inaccessible to most traders. These indicators, related to the fundamental analysis, can also be used as an effective long-term filter
The Vortex Indicator was inspired by the work of an Austrian inventor, Viktor Schauberger, who studied the flow of water in rivers and turbines. Etienne Botes and Douglas Siepman developed the idea that movements and flows within financial markets are similar to the vortex motions found in water. The Vortex Indicator was also partly inspired by J. Welles Wilder's concept of directional movement, which assumes the relationship between price bars gives clues as to the direction of a market. This i
Chart Patterns Detect 15 patterns (Ascending Triangle, Descending Triangle, Rising Wedge, Falling Wedge, Bullish Flag, Bearish Flag, Bullish Rectangle, Bearish Rectangle Symmetrical triangle, Head and Shoulders, Inverted Head and Shoulders, Triple top, Triple Bottom, Double Top, Double Bottom) Use historical data to calculate the probability of each pattern to succeed (possibility to filter notification according to the chance of success) gives graphic indication about the invalidation level and
Los compradores de este producto también adquieren
Gann Made Easy
Oleg Rodin
4.8 (116)
Gann Made Easy es un sistema de comercio de Forex profesional y fácil de usar que se basa en los mejores principios de comercio utilizando la teoría del Sr. W. D. Gann. El indicador proporciona señales precisas de COMPRA y VENTA, incluidos los niveles de Stop Loss y Take Profit. Puede comerciar incluso sobre la marcha utilizando notificaciones PUSH. ¡Por favor, póngase en contacto conmigo después de la compra! ¡Compartiré mis consejos comerciales con usted y excelentes indicadores de bonificació
¡Actualmente 20% OFF ! ¡La mejor solución para cualquier novato o trader experto! Este software funciona con 28 pares de divisas. Se basa en 2 de nuestros principales indicadores (Advanced Currency Strength 28 y Advanced Currency Impulse). Proporciona una gran visión general de todo el mercado de divisas. Muestra los valores de Advanced Currency Strength, la velocidad de movimiento de las divisas y las señales para 28 pares de divisas en todos los (9) marcos temporales. Imagine cómo mejorará
Scalper Inside PRO
Alexey Minkov
4.76 (63)
!SPECIAL SALE! An exclusive indicator that utilizes an innovative algorithm to swiftly and accurately determine the market trend. The indicator automatically calculates opening, closing, and profit levels, providing detailed trading statistics. With these features, you can choose the most appropriate trading instrument for the current market conditions. Additionally, you can easily integrate your own arrow indicators into Scalper Inside Pro to quickly evaluate their statistics and profitability
Gold Stuff
Vasiliy Strukov
4.86 (255)
Gold Stuff: un indicador de tendencia diseñado específicamente para el oro, también se puede usar en cualquier instrumento financiero. El indicador no se vuelve a dibujar ni se retrasa. El marco de tiempo recomendado es H1. Este indicador está escrito por EA Gold Stuff Advisor, puede encontrarlo en mi perfil.  Puede obtener una copia gratuita de nuestro indicador Strong Support y Trend Scanner, por favor envíe un mensaje privado. ¡a mí! IMPORTANTE! Póngase en contacto conmigo inmediatamente de
Golden Trend Indicator
Noha Mohamed Fathy Younes Badr
4.9 (10)
Golden Trend indicator  is The best indicator for predicting trend movement this indicator never lags and never repaints and never back paints    and give  arrow buy and sell    before the candle appear  and it will help you and  will make your trading decisions clearer its work on all currencies and  gold and crypto and all time frame This unique  indicator uses very secret algorithms to catch the  trends, so you can trade using this indicator and see the trend clear on charts  manual guide and
Dynamic Forex28 Navigator
Bernhard Schweigert
5 (5)
Dynamic Forex28 Navigator: la herramienta de trading de Forex de última generación. ACTUALMENTE CON UN 49 % DE DESCUENTO. Dynamic Forex28 Navigator es la evolución de nuestros indicadores populares de larga data, que combina el poder de tres en uno: Indicador avanzado Currency Strength28 (695 reseñas) + Indicador avanzado Currency IMPULSE con ALERT (520 reseñas) + Señales combinadas CS28 (bonificación). Detalles sobre el indicador https://www.mql5.com/en/blogs/post/758844 ¿Qué ofrece el indi
M1 Arrow
Oleg Rodin
5 (17)
Una estrategia intradía basada en dos principios fundamentales del mercado. El algoritmo se basa en el análisis de volúmenes y ondas de precios utilizando filtros adicionales. El algoritmo inteligente del indicador da una señal solo cuando dos factores de mercado se combinan en uno. El indicador calcula ondas de cierto rango en el gráfico M1 utilizando los datos del marco de tiempo más alto. Y para confirmar la onda, el indicador utiliza el análisis por volumen. Este indicador es un sistema come
Scalper Vault
Oleg Rodin
5 (29)
Scalper Vault es un sistema profesional de reventa que le brinda todo lo que necesita para una reventa exitosa. Este indicador es un sistema comercial completo que puede ser utilizado por operadores de divisas y opciones binarias. El marco de tiempo recomendado es M5. El sistema le proporciona señales de flecha precisas en la dirección de la tendencia. También le proporciona señales superiores e inferiores y niveles de mercado de Gann. Los indicadores proporcionan todo tipo de alertas, incluidas
Easy Breakout
Mohamed Hassan
5 (10)
After your purchase, feel free to contact me for more details on how to receive a bonus indicator called VFI, which pairs perfectly with Easy Breakout for enhanced confluence!   Easy Breakout is a powerful price action trading system built on one of the most popular and widely trusted strategies among traders: the Breakout strategy ! This indicator delivers crystal-clear Buy and Sell signals based on breakouts from key support and resistance zones. Unlike typical breakout indicators, it levera
Enigmera
Ivan Stefanov
5 (7)
ENIGMERA: El núcleo del mercado Importante: La demostración de MQL5.com se ejecuta en el Strategy Tester y puede no reflejar completamente la funcionalidad de Enigmera. Consulta la descripción, las capturas de pantalla y el video para más detalles. ¡No dudes en contactarme si tienes alguna pregunta! El código del indicador ha sido completamente reescrito. La versión 3.0 añade nuevas funcionalidades y elimina errores acumulados desde el inicio del indicador. Introducción Este indicador y sistem
Linear Trend Predictor : un indicador de tendencia que combina puntos de entrada y líneas de soporte de dirección. Funciona según el principio de romper el canal de precios altos/bajos. El algoritmo del indicador filtra el ruido del mercado, tiene en cuenta la volatilidad y la dinámica del mercado. Capacidades del indicador  Utilizando métodos de suavizado, muestra la tendencia del mercado y los puntos de entrada para abrir órdenes de COMPRA o VENTA.  Adecuado para determinar los movimientos
GOLD Impulse with Alert
Bernhard Schweigert
4.6 (10)
Este indicador es una super combinación de nuestros 2 productos Advanced Currency IMPULSE with ALERT  +   Currency Strength Exotics . ¡Funciona para todos los marcos de tiempo y muestra gráficamente el impulso de fuerza o debilidad para las 8 divisas principales más un Símbolo! Este Indicador está especializado en mostrar la aceleración de la fuerza de la divisa para cualquier símbolo como Oro, Pares Exóticos, Materias Primas, Índices o Futuros. Es el primero de su clase, cualquier símbolo p
Trend Screener
STE S.S.COMPANY
4.78 (93)
Indicador de tendencia, solución única e innovadora para el comercio y filtrado de tendencias con todas las funciones de tendencias importantes integradas en una sola herramienta. Es un indicador 100% sin repintar de marcos temporales y monedas múltiples que se puede usar en todos los símbolos/instrumentos: divisas, materias primas, criptomonedas, índices y acciones. OFERTA POR TIEMPO LIMITADO: El indicador de detección de soporte y resistencia está disponible por solo 50$ y de por vida. (Precio
FX Power MT4 NG
Daniel Stein
4.94 (18)
FX Power: Analiza la Fuerza de las Divisas para Decisiones de Trading Más Inteligentes Descripción General FX Power es tu herramienta esencial para comprender la fuerza real de las principales divisas y el oro en cualquier condición de mercado. Al identificar divisas fuertes para comprar y débiles para vender, FX Power simplifica las decisiones de trading y descubre oportunidades de alta probabilidad. Ya sea que quieras seguir las tendencias o anticipar reversiones utilizando valores extremos
Algo Pumping MT4
Ihor Otkydach
5 (4)
PUMPING STATION – Tu estrategia personal "todo incluido" Te presentamos PUMPING STATION, un indicador revolucionario para Forex que transformará tu forma de operar en una experiencia emocionante y eficaz. No es solo un asistente, sino un sistema de trading completo con potentes algoritmos que te ayudarán a operar de forma más estable. Al comprar este producto, recibes GRATIS: Archivos de configuración exclusivos: para una configuración automática y un rendimiento óptimo. Manual en video paso a p
- Real price is 80$ - 40% Discount (It is 49$ now) - Lifetime update free Contact me for instruction, add group and any questions! Related Products:  Bitcoin Expert , Gold Expert - Non-repaint - I just sell my products in Elif Kaya profile, any other websites are stolen old versions, So no any new updates or support. Introduction The breakout and retest strategy is traded support and resistance levels. it involves price breaking through a previous level.  The break and retest strategy is design
FX Volume
Daniel Stein
4.6 (35)
FX Volume: Experimente el Verdadero Sentimiento del Mercado desde la Perspectiva de un Bróker Resumen Rápido ¿Desea llevar su estrategia de trading a otro nivel? FX Volume ofrece información en tiempo real sobre cómo los traders minoristas y los brókers están posicionados, mucho antes de que aparezcan informes retrasados como el COT. Ya sea que busque beneficios consistentes o simplemente quiera una ventaja más profunda en los mercados, FX Volume le ayuda a identificar desequilibrios important
IX Power MT4
Daniel Stein
4.78 (9)
IX Power: Descubre perspectivas de mercado para índices, materias primas, criptomonedas y forex Descripción general IX Power es una herramienta versátil diseñada para analizar la fortaleza de índices, materias primas, criptomonedas y símbolos de forex. Mientras que FX Power ofrece la máxima precisión para pares de divisas mediante el uso de datos de todos los pares disponibles, IX Power se centra exclusivamente en los datos del mercado del símbolo subyacente. Esto convierte a IX Power en una e
Volatility Trend System - un sistema de comercio que da señales para las entradas. El sistema de volatilidad da señales lineales y puntuales en la dirección de la tendencia, así como señales para salir de ella, sin redibujar ni demoras. El indicador de tendencia monitorea la dirección de la tendencia a mediano plazo, muestra la dirección y su cambio. El indicador de señal se basa en cambios en la volatilidad y muestra entradas en el mercado. El indicador está equipado con varios tipos de alert
Pruebe "Chart Patterns All in One" en modo demo y obtenga un bono. Envíeme un mensaje después de probarlo en modo demo para recibir su bono. Deja un comentario después de la compra para recibir 8 indicadores de alta calidad como bono. El indicador Chart Patterns All-in-One ayuda a los traders a visualizar varios patrones de gráficos comúnmente utilizados en el análisis técnico. Este indicador apoya la identificación de posibles comportamientos del mercado, pero no garantiza rentabilidad. Se rec
Indicador cíclico para negociar y predecir la dirección del mercado. Muestra el comportamiento cíclico del precio en forma de oscilador. Da señales para abrir tratos al rebotar desde los límites superior e inferior del oscilador. En forma de histograma, muestra la fuerza suavizada de la tendencia. Complementará cualquier estrategia comercial, desde scalping hasta intradía. El indicador no se vuelve a dibujar. Adecuado para su uso en todos los símbolos/instrumentos. Marcos de tiempo adecuados par
Advanced Supply Demand
Bernhard Schweigert
4.91 (294)
¡Actualmente con 33% de descuento! ¡La mejor solución para cualquier tráder principiante o experto! Este indicador es una herramienta comercial única, de alta calidad y asequible, porque incorpora una serie de características patentadas y una nueva fórmula. Con esta actualización, podrá mostrar zonas de doble marco temporal. No solo podrá mostrar un marco temporal más alto, sino también mostrar ambos, el marco temporal del gráfico MÁS el marco temporal más alto: MOSTRANDO ZONAS ANIDADAS. A todos
Gold Buster M1 System es un sistema de negociación profesional para gráficos M1 en el par XAUUSD. Pero, a pesar de que el sistema se desarrolló originalmente exclusivamente para operar con oro, el sistema también se puede utilizar con otros pares de divisas. Después de la compra, le daré una lista de pares comerciales que se pueden usar con el sistema además de XAUUSD, lo que ampliará sus posibilidades para usar este sistema. ¡TODOS LOS INDICADORES DEL SISTEMA NO SE REPITE! Este sistema es un co
ACTUALMENTE 26% DE DESCUENTO ¡La mejor solución para cualquier operador novato o experto! Este indicador es una herramienta única, de alta calidad y asequible porque hemos incorporado una serie de características propias y una nueva fórmula. ¡Con sólo UN gráfico puede leer la Fuerza de la Divisa para 28 pares de Divisas! Imagínese cómo mejorará su operativa porque podrá señalar el punto exacto de activación de una nueva tendencia o de una oportunidad de scalping. Manual del usuario: haga cli
Hydra Trend Rider is a non-repainting, multi-timeframe trend indicator that delivers precise buy/sell signals and real-time alerts for high-probability trade setups. With its color-coded trend line, customizable dashboard, and mobile notifications, it's perfect for traders seeking clarity, confidence, and consistency in trend trading. Download the Metatrader 5 Version Message us here after purchase to get the Indicator Manual. Download Now! Offer valid only for next 10 Buyers. Price will increas
Volume Break Oscillator es un indicador que combina el movimiento de precios con las tendencias de volumen en forma de oscilador. Quería integrar el análisis de volumen en mis estrategias, pero siempre me han decepcionado la mayoría de los indicadores de volumen, como OBV, Money Flow Index, A/D, pero también Volume Weighted Macd y muchos otros. Por lo tanto, escribí este indicador para mí mismo, estoy satisfecho con su utilidad y, por lo tanto, decidí publicarlo en el mercado. Características
El Sincronizador de Ondas es un indicador visual de análisis de ondas. Combina secuencias de movimiento de velas y construye ondas direccionales, produciendo movimientos sincronizados con el mercado. El inicio de cada onda comienza con una flecha de señal; también incluye alertas. El indicador nunca redibujará ni moverá las flechas en el historial anterior. Las flechas de señal aparecen al cierre de la vela. Compatible con cualquier instrumento de trading y marco temporal. Fácil de usar y confi
Candle Probability Scalper
Martin Alejandro Bamonte
Guía de Uso del Candle Probability Scalper Este indicador hace que el scalping sea facil y 100% intuitivo. Candle Probability Scalper te mostrará de un vistazo los datos de los porcentajes de fuerza de compradores y vendedores en TIEMPO REAL , y en la vela actual. Los porcentajes se actualizan en cada tick, con lo que segundo a segundo sabrás lo que están haciendo la mayoría de compradores y vendedores, sin ningún tipo de retrasos, esto te ayudará inmensamente a determinar o confirmar cual es la
IQ Gold Gann Levels a non-repainting, precision tool designed exclusively for XAUUSD/Gold intraday trading. It uses W.D. Gann’s square root method to plot real-time support and resistance levels, helping traders spot high-probability entries with confidence and clarity. William Delbert Gann (W.D. Gann) was an exceptional market analyst, whose trading technique was based on a complex blend of mathematics, geometry, astrology, and ancient mathematics which proved to be extremely accurate. Download
Legacy of Gann
Pavel Zamoshnikov
4.83 (12)
The indicator very accurately determines the levels of the possible end of the trend and profit fixing. The method of determining levels is based on the ideas of W.D.Gann, using an algorithm developed by his follower Kirill Borovsky. Extremely high reliability of reaching levels (according to K. Borovsky  - 80-90%) Indispensable for any trading strategy – every trader needs to determine the exit point from the market! Precisely determines targets on any timeframes and any instruments (forex, met
Otros productos de este autor
MT Supply Demand
Issara Seeboonrueang
4 (4)
We provide indicators tailored to better meet your trading requirements.       >>  MT Magical  << MT Supply Demand : It is an indicator created to find supply and demand, which will be important support and resistance levels for the price.  Supply Zone   is a zone where the price has reached, it is often resisted. In other words, when the price reaches this zone, there will be more selling power to push the price back down. Demand Zone   is a zone where the price has reached, it is ofte
FREE
MT Magical
Issara Seeboonrueang
Please thoroughly test demo the indicator in your preferred trading conditions before making a purchase decision. Your satisfaction and confidence in its performance are paramount. MT Magical :  A sophisticated strategy combining swing trading, trend analysis and supply & demand signals. Expertly filtered for precision. Developed with rigorous effort, delivering value to serious investors. Indicator for traders who prefer manual trading.  Request: PC high performance TRADE: Forex TIME FRA
MT Merit Pullback
Issara Seeboonrueang
5 (2)
"Pullback while filtering trend" MT MERIT PullBack :  Engineered to detect pullback signals while filtering trends using advanced techniques. Best for short-term cycles. Tailored for manual trading, emphasizing risk management and fundamental analysis to select optimal currency pairs. TRADE: Forex TIME FRAME:  All Time Frame SYMBOL PAIR: All Symbol SETTINGS: CALCULATE BARS: Value or bars used must be large enough to calculate the formula. TREND FILTER: Put the number Period and Show tren
MT Merit TLC
Issara Seeboonrueang
Please thoroughly test demo the indicator in your preferred trading conditions before making a purchase decision. Your satisfaction and confidence in its performance are paramount. MT MERIT TLC (Trend Line Channel) : The TLC indicator identifies reversal or breakout signals using plotted trend line channels relative to the current price.  It is tailored for manual traders who manage risk independently (Stop Loss, Take Profit, Risk-Reward). Indicator for traders who prefer manual trading. TRA
Filtro:
No hay comentarios
Respuesta al comentario
Versión 6.0 2024.12.16
Show buffer in Data Windows (No signal = 0.00)
Versión 5.10 2024.12.09
Check the status = Backtest, automatically set Calculate_Bars = 0 to Backtest all bars.
Versión 5.0 2024.12.06
Improved code to speed up indicator
Versión 4.10 2024.11.29
Various improvements.
Versión 4.0 2024.11.28
Solve the problem of slow performance.
Detail: Remove signals bands3, Because makes the indicator slow and repaint makes the decision poor.
Using bands 2 and 3 together gives a better look trend than using signals bands3 that repaint.
Versión 3.21 2024.05.21
Improved function: Alert Type (a little)
Versión 3.20 2023.09.08
Adjust the parameter to be appropriate. Remove those that don't really affect display much.
Versión 3.10 2023.09.08
Add Parameter: Bands_Mode, Bands_Price
Versión 3.0 2023.09.08
Various improvements.
Versión 2.0 2023.09.07
Create function: Analysis Profit
Create function: Alert_OB&OS_ON (Overbought and Oversold)