• Información general
  • Comentarios
  • Discusión
  • Novedades

Percent Levels

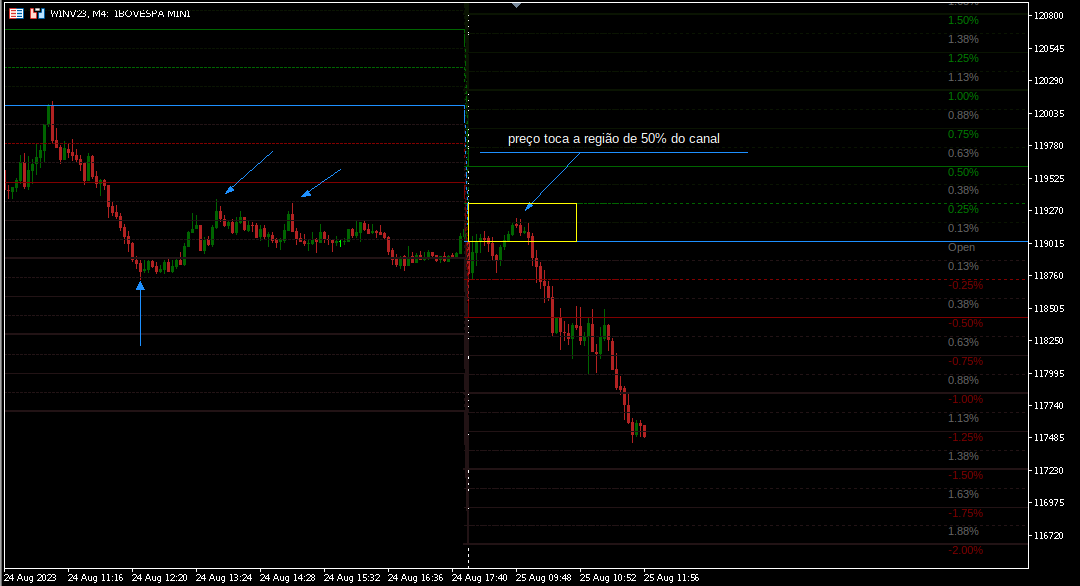
Indicador tipo 2mv frequência mostra os níveis percentuais no mercado financeiro que tendem a ser zonas realmente importantes para os traders. Observem que o preço segue um fluxo e uma frequência que se enquadram em canais percentuais de movimento, tradicionalmente traçados por níveis Fibonacci.

O indicador LevelsPercent traça linhas em pontos específicos de percentual configurados pelo usuário e "pode" anteceder possíveis níveis de SUPORTE e RESISTÊNCIA.

A leitura do mercado e a identificação de um padrão de amplitude e frequência do movimento do preço, pode fazer desse simples indicador um grande aliado em diferentes estratégias de negociação.

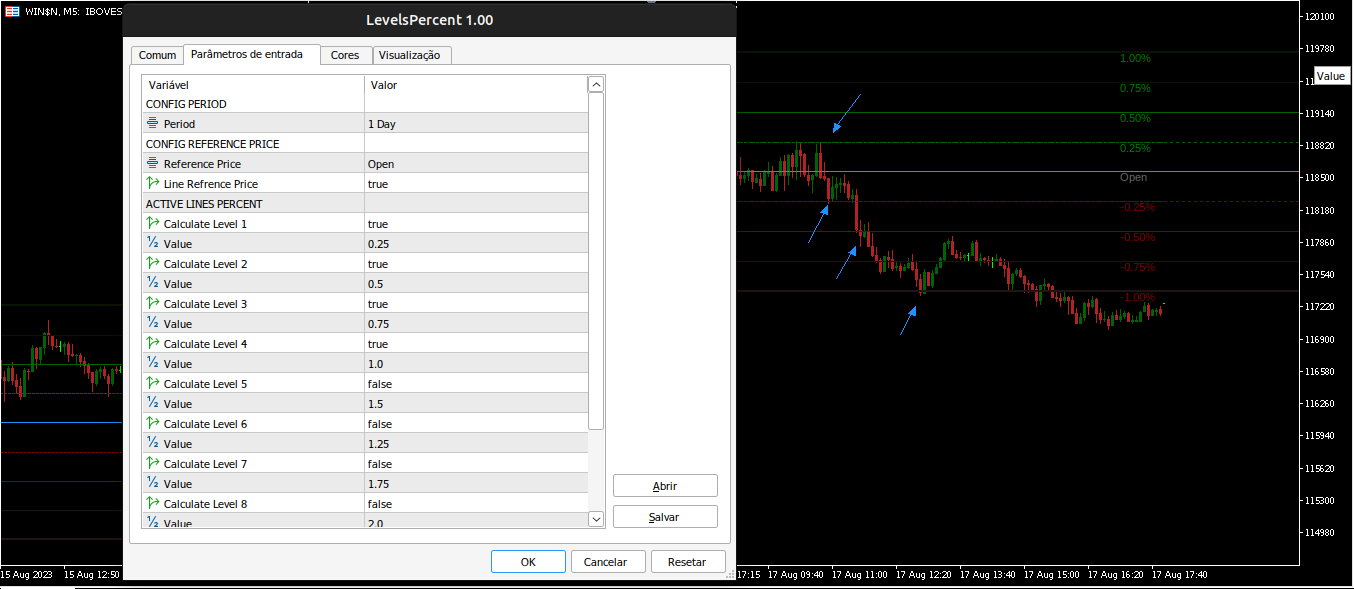
A configuração é simples:

Period:

Período para cálculo dos percentuais;

DAY = Período Diário;

WEEK = Período Semanal;

Reference Price

Preço de referência para cálculo;

OPEN = Preço de abertura atual do período selecionado (DAY ou WEEK);

CLOSE_PREVIOUS   = Preço de fechamento anterior ao período selecionado (DAY ou WEEK);

ACTIVE LEVELS PERCENT

Você pode gerar até 8 níveis percentuais, os valores são espelhados para baixo, por exemplo, se inserir 0.25,

uma linha de Resistência será traçada no nível 0.25% e outra linha no -0.25%, a partir do preço de referência selecionado.

Calculate Level = Se "true" habilita a linha, se "false" o nível não é calculado.

Value = valor percentual.

Show Labels = Mostrar legenda?;

Font Size Labels = Tamanho da fonte da legenda;

Position Labels = Posição da legenda.


Productos recomendados
Weis Wave Double Side
Eduardo Da Costa Custodio Santos
El indicador lateral Weis Wave Bouble para MT5 es parte del conjunto de herramientas (Wyckoff Academy Wave Market) El indicador lateral Weis Wave Bouble para MT5 se creó en base al ya establecido Weis Wave creado por David Weis. El indicador Weis Wave Double Side lee el mercado en ondas como se hizo por R. Wyckoff en 1900. Ayuda a identificar esfuerzo x resultado, causa y efecto, oferta y demanda. Su diferencial es que se puede utilizar por debajo del eje cero, mejorando aún más más lectura del
WAPV Weis Wave Chart Forex
Eduardo Da Costa Custodio Santos
El Weis Wave Chart Forex para MT5 es un indicador de precio y volumen. La lectura de Precio y Volumen fue ampliamente difundida a través de Richard Demille Wyckoff en base a las tres leyes creadas por él: Oferta y Demanda, Causa y Efecto y Esfuerzo vs. Resultado. En 1900, R.Wyckoff ya utilizaba el gráfico de ondas en sus análisis. Muchos años después, alrededor de 1990, David Weis Automatizó el gráfico de ondas de R. Wyckoff y hoy os traemos la evolución del gráfico de ondas de David Weis. Muest
Midas is the acronym for Market Interpretation / Data Analysis System is a trade approach started in 1995 by technical analyst Paul Levine and later developed by Andrew Coles, PhD and David Hawkins. Learn more in the book MIDAS Technical Analysis: A VWAP Approach to Trading and Investing in Today's Markets , (I saw that it is possible buy via Amazon). The positive points in relation to the Midas-based indicators are the prediction of movement reversal points, the negative point is the subjectivi
Weis Wave Double Side Alert
Eduardo Da Costa Custodio Santos
El indicador lateral Weis Wave Bouble para MT5 es parte del conjunto de herramientas (Wyckoff Academy Wave Market) El indicador lateral Weis Wave Bouble para MT5 se creó en base al ya establecido Weis Wave creado por David Weis. El indicador Weis Wave Double Side lee el mercado en ondas como lo hizo R. Wyckoff en 1900. Ayuda a identificar esfuerzo x resultado, causa y efecto, oferta y demanda. Su diferencial es que se puede usar debajo del eje cero y tiene una alerta de ruptura que muestra Quien
The   Visual Volatility Clustering   indicator clusters the market based on volatility. The indicator does not redraw and gives accurate data, does not use closing prices. Uses the opening prices or the highs or lows of the previous completed bar. Therefore, all information will be clear and unambiguous. The essence of the indicator is to divide the price market into certain areas according to a similar type of volatility. This can be done in any way. In this example, the indicator is configure
White Weis Volume Ticks
Ricardo Almeida Branco
5 (3)
White Weis Volume This indicator shows the sum of the volume in each wave, bulish or bearish, as idealized by David Weis , but it brings an important addition , which is the marking of the bar with the highest volume of the wave (White Bar)! In coding the indicator, it was sought to optimize the code to require minimal processing during use and not to overload mt5. The indicator can be used for pre-trading analysis and study, where the trader analyzes possible points of support and resi
BigPlayerBars
Paulo Henrique Faquineli Garcia
Se você já ouviu falar do Método de  Wyckoff, Análise de dispersão de volume, etc., com certeza chegou até aqui para buscar o indicador que lhe faltava!! Nosso indicador é capaz de lhe mostrar a dispersão de volume negociado pelos grandes players durante todo o período de negociação! E o grande diferencial deste tipo de abordagem é a capacidade que este indicador possui de lhe mostrar onde está armado o "ACAMPAMENTO" dos BigPlayers e, assim, tirar o melhor proveito em seus trades, entrando jun
A Média Móvel é um indicador que faz parte da Análise Técnica. Com ela, é possível identificar o equilíbrio dos preços no mercado, observando tendências de alta, neutra ou baixa. Este indicador customizado traz opções extras pera definir o método de cálculo podendo-se esclolher entre SMA,EMA,SSMA,LWMA,JJMA,JurX,ParMA,T3,Vidya,AMA,HULL MA. Também conta com varias opções para escolher o método de cálculo para o preço base a ser usado no cáculo da média.
Clear DOM
Oclair Gallacini Prado
Clear Dom This Indicator shows a pressure color box based on depth of market of the current symbol. Notice that it only works when book information is received. You decide weather you want or not to display higher (ask) and lower (bid) levels of book. The proportion ratio is calculated using volumes read from the book. You can read the actual pressure in the market any time. Indicator parameters: color_Ask -> ASK box color and ASK value line color color_Bid -> BID box color and BID valu
Weis Wave Result MT5
Sant Clear Ali Costa
Features 3 types of waves: bullish, bearish and unknown. The unknown tower comes when prices move in opposite the direction of the current tower. Label that shows the percentage remaining for the next tower. Allows you set the type of volume that will be accumulated in the towers, either real or tick volumes. Thus, the indicator works in any market, for example: stocks, futures, forex, commodities, etc. Allows you to set the required score for the tower exchange. Allows you to set the font size
Midas VWAP
Paulo Henrique Faquineli Garcia
4 (1)
Volume Weighted Average Price (VWAP) is a trading benchmark commonly used by Big Players that gives the average price a Symbol has traded throughout the day. It is based on both Volume and price. This indicator contains Daily VWAP and MIDAS' VWAP, which means you are able to anchor the beggining of MIDAS' calculations and, therefore you will be able to use this methodology to study price versus volume moves after anchor point. You will be able to anchor up to 3 HIGH MIDAS VWAP's and 3 LOW. Wis
FREE
Intraday Vwap Orion
Joao Paulo Botelho Silva
Theory VWAP is a volume-weighted moving average, bringing greater relevance to prices. The VWAP base calculation follows the classic formula described in Investopedia ( https://www.investopedia.com/terms/v/vwap.asp ). VWAP = sum(typical price[i]*volume[i]) / sum(volume[i]) Functionalities Orion Intraday VWAP innovates by allowing the user to choose between the conventional Daily, Weekly and Monthly periods, also having the option of calculating the Intraday indicator, as used in other platfo
Vwap Freeze
Ricardo Almeida Branco
5 (1)
The previous day's vwap is used by some traders as a support and resistance point, after all it is one of the ways to consider the fair price of that asset or that pair the day before. Possible defenses can occur in this region indicating a reversal, or triggering stops starting a new, more directional movement. It is a matter of analyzing how it will add to your operational. To avoid manually drawing the previous day's vwaps and saving time for your analysis, use the Vwap Freeze indicator,
VWAP and MVWAP
Flavio Javier Jarabeck
4 (5)
Volume Weighted Average Price (VWAP) is a trading benchmark commonly used by Big Players that gives the average price a Symbol has traded throughout the day. It is based on both Volume and price. Additionally we put in this indicator the MVWAP (Moving Volume Weighted Average Price). For those who do not know the usage and the importance od this indicator I recommend a great article about this subject at Investopedia ( https://www.investopedia.com/articles/trading/11/trading-with-vwap-mvwap.asp )
FREE
Volume Waves
Paulo Henrique Faquineli Garcia
One of the best tools for analyzing volume, Weis Wave was devised by David Weis to facilitate reading the directional flow. For the disciples of the Wyckoff method, this means an evolution, facilitating a predictive reading of the market, always looking for Accumulation and Distribution zones for traded assets. For better understanding, in this indicator we try to cover every reading of EFFORT (traded volume) versus RESULT (price change). Thus, you can apply the indicator on the chart twice
An anchored Vwap With Arrows is an indicator that includes a moving average weighted by volume that allows you to plot on a bottom or a top. Usually banks and institutions measure an average price, this average price is a price range where they agree to make a trade. Using the logic of anchored vwap with arrows it is possible to understand that if the price breaks the vwap it means that someone with enough buying and selling power has lost control. You can use vwap anchored with arrows in any ti
Orion Vwap Bands
Joao Paulo Botelho Silva
Fundamentação teórica   A VWAP é uma média móvel ajustada pelo volume, ou seja, o peso de cada preço corresponde ao volume de ações negociadas no período, dando mais importância ao período em que se tenha mais negociações. A Orion Vwap Bands permite que o usuário use plote 8 bandas que podem ser utilizadas como suportes e resistências para o preço. Cada banda é calculada a partir da Vwap Tradicional: Ex.: Se escolhermos o valor 0.25 para a plotagem da Banda 1, pega-se o preço da Vwap e acrescen
Oscillador moving
Ignacio Agustin Mene Franco
Oscillador Moving ! es un oscillador donde tiene 3 puntos de entrada  donde tiene la linea naranja ,  la linea roja  y la linea azul ,  donde la linea naranja toca el techo de la linea azul da señal de entrada en compra .  donde la linea roja cruza la linea azul da señal de venta !  muy claro de ver y muy simple de usar ! se puede usar en cualquier temporalidad ! se puede usar en los mercados de Forex .  En los mercados de indices sinteticos y crypto !  Buen Profit  World Inversor . 
Mean Volume indicator for MT5
Renaud Herve Francois Candel
Mean Volume Most indicators are based on price analysis. This indicator is based on volume. Volume is overlooked piece of information in most trading systems. And this is a big mistake since volume gives important information about market participants. Mean Volume is an indicator that can be used to spot when volume is above average. It usually means that institutional traders are active. Peak in volume can be used to confirm an entry since increased volume can sustain the move in one or
The Market Structure with Inducements & Sweeps indicator is a unique take on Smart Money Concepts related market structure labels that aims to give traders a more precise interpretation considering various factors. Compared to traditional market structure scripts that include Change of Character (CHoCH) & Break of Structures (BOS) -- this script also includes the detection of Inducements (IDM) & Sweeps which are major components of determining other structures labeled on the chart. SMC &
Visual Heatmap Book Analyzer
Alexandre Moraes De Souza Lima
Visual Heatmap Book Analyser This indicator monitors the market liquidity and generates colors based on order patterns, quantities, and renewal activities in the book. This allows you to visualize the order flow and identify areas of high and low liquidity and activity. The indicator uses machine learning techniques to analyze the order behavior in the book, enabling it to detect patterns and trends in orders, allowing you to make informed decisions about your trading operations. The color pal
Anchored VWAP with Alert MT5
Trade The Volume Waves Single Member P.C.
5 (1)
What is the Volume Weighted Average Price (VWAP)? The volume weighted average price (VWAP) is a trading benchmark used by traders that gives the average price an instrument has traded at throughout the day, based on both volume and price.  It is important because it provides traders with insight into both the trend and value of the instrument. What is the Difference between VWAP and AVWAP? While VWAP is having as starting point the beggining of the day,week,month etc. in the AVWAP you can p
VWAP Indicator
LUC JACOBUS A VERHEECKE
4.13 (23)
Volume Weighted Average Price (VWAP) The volume weighted average price (VWAP) is a  trading   benchmark  used by traders that gives the average price a security has traded at throughout the day, based on both volume and price. It is important because it provides traders with insight into both the trend and value of a security. This indicator VWAP V2 is free and is the manual version of the extended Easy VWAP indicator (30 Euro), where the date and time properties are automatically entered. With
FREE
Here I present you this awesome indicator I made. This is a nique combination witch puts you in the same level as MM's. So you can surf a lot of waves and identify the rally time, breakouts, and the perfect time to get in the market. ---- The SSL Channel is a great all-rounder based on 2 Simple Moving Averages, one of recent Highs, one of recent Lows. The calculation prints a   channel   on the chart consisting of 2 lines. This strategy gives a Long signal when price closes above the top of the
VWAP Daily
Anton Polkovnikov
Weighted average price indicator or VWAP. The well-known standard VWAP with the beginning of the day is added with the function of selecting the periodization. It can be calculated both every day and on other periods. Also the indicator allows to exclude the volume from the calculation, which will allow using it on the cryptocurrencies and forex. There is an alert for a VWAP price crossing. There are 1 and 2 standard deviation. Settings: Volume: turning volume on and off in the calculation mecha
HLC bar MT5 Wyckoff
Eduardo Da Costa Custodio Santos
El indicador "HLC_bar_MT5 Wyckoff" para MT5 se creó para facilitar el análisis en el momento de la negociación. La barra HLC fue utilizada por Richard Wyckoff y actualmente se usa ampliamente en operaciones "VSA" . Wyckoff descubrió que el uso de High, Low y Close hacía que el gráfico fuera mucho más limpio y fácil de analizar. El indicador " HLC_bar_MT5 Wyckoff " permite: # Cambiar el ancho de la barra; # Deja la barra del mismo color; # Y resalte la barra que abrió y cerró al mismo precio. Los
The   Visual Volatility Clustering   indicator clusters the market based on volatility. The indicator does not redraw and gives accurate data, does not use closing prices. Uses the opening prices or the highs or lows of the previous completed bar. Therefore, all information will be clear and unambiguous. The essence of the indicator is to divide the price market into certain areas according to a similar type of volatility. This can be done in any way. In this example, the indicator is configure
Introduction One of the patterns in "RTM" is the "QM" pattern, also known as "Quasimodo". Its name is derived from the appearance of "Hunchback of Notre-Dame" from Victor Hugo's novel. It is a type of "Head and Shoulders" pattern.   Formation Method   Upward Trend In an upward trend, the left shoulder is formed, and the price creates a new peak higher than the left shoulder peak . After a decline, it manages to break the previous low and move upward again. We expect the pric
The Accumulation / Distribution is an indicator which was essentially designed to measure underlying supply and demand. It accomplishes this by trying to determine whether traders are actually accumulating (buying) or distributing (selling). This indicator should be more accurate than other default MT5 AD indicator for measuring buy/sell pressure by volume, identifying trend change through divergence and calculating Accumulation/Distribution (A/D) level. Application: - Buy/sell pressure: above
VWAP Bands
Rafael Caetano Pinto
This indicator uses VWAP and projects this VWAP into up to 3 levels, shifted by a percentage of the chart's symbol. How to configure: Choose the symbol and desired graphic time Set the start time of the symbol (in bovespa, WIN and WDO start at 9 o'clock). This time is used as the cutoff reference for VWAP. Check which VWAP period fits the chart better: Ideally, a period when VWAP is not too distant from the chart Set percentage levels: Ideally, you should set levels based on history, so that l
Los compradores de este producto también adquieren
TPSpro RFI Levels MT5
Roman Podpora
4.73 (11)
INSTRUCCIONES       RUSO   -   ING        Se   recomienda utilizar con un indicador.       -       TPSpro   TENDENCIA PRO -   Versión MT5 Un elemento clave en el trading son las zonas o niveles desde los que se toman las decisiones de compra o venta de un instrumento de trading. A pesar de los intentos de los principales actores de ocultar su presencia en el mercado, inevitablemente dejan rastros. Nuestra tarea era aprender a identificar estos rastros e interpretarlos correctamente. Funciones p
TPSproTREND PrO MT5
Roman Podpora
4.89 (9)
TPSpro TREND PRO  - is a trend indicator that automatically analyzes the market and provides information about the trend and each of its changes, as well as giving signals for entering trades without redrawing! The indicator uses each candle, analyzing them separately. referring to different impulses - up or down impulse. Exact entry points into transactions for currencies, crypto, metals, stocks, indices!  Version MT4               DETAILED DESCRIPTION               R ecommended to use with an
Primero que todo, vale la pena enfatizar que este Sistema de Trading es un Indicador No Repintado, No Redibujado y No Retrasado, lo que lo hace ideal tanto para el trading manual como para el automatizado. Curso en línea, manual y descarga de ajustes preestablecidos. El "Sistema de Trading Inteligente MT5" es una solución completa de trading diseñada para traders nuevos y experimentados. Combina más de 10 indicadores premium y presenta más de 7 estrategias de trading robustas, lo que lo convie
Atomic Analyst MT5
Issam Kassas
4.42 (19)
En primer lugar, vale la pena enfatizar que este Indicador de Trading no repinta, no redibuja y no se retrasa, lo que lo hace ideal tanto para el trading manual como para el automatizado. Manual del usuario: configuraciones, entradas y estrategia. El Analista Atómico es un Indicador de Acción del Precio PA que utiliza la fuerza y el impulso del precio para encontrar una mejor ventaja en el mercado. Equipado con filtros avanzados que ayudan a eliminar ruidos y señales falsas, y aumentan el poten
FX Power MT5 NG
Daniel Stein
5 (5)
Obtenga su actualización diaria del mercado con detalles y capturas de pantalla a través de nuestro Morning Briefing aquí en mql5 y en Telegram ! FX Power MT5 NG es la nueva generación de nuestro popular medidor de fuerza de divisas, FX Power. ¿Y qué ofrece este medidor de fuerza de nueva generación? Todo lo que le encantaba del FX Power original PLUS Análisis de fuerza de ORO/XAU Resultados de cálculo aún más precisos Períodos de análisis configurables individualmente Límite de cálculo persona
Quantum Trend Sniper
Bogdan Ion Puscasu
4.8 (49)
Introduciendo       Indicador Quantum Trend Sniper   , el innovador indicador MQL5 que está transformando la forma en que identificas y negocias los cambios de tendencia. Desarrollado por un equipo de comerciantes experimentados con experiencia comercial de más de 13 años,       Indicador de francotirador de tendencia cuántica       está diseñado para impulsar su viaje comercial a nuevas alturas con su forma innovadora de identificar cambios de tendencia con una precisión extremadamente alta.
Ante todo, vale la pena enfatizar que esta Herramienta de Trading es un Indicador No Repintado, No Redibujado y No Retrasado, lo que la hace ideal para el trading profesional. Curso en línea, manual del usuario y demostración. El Indicador de Conceptos de Acción del Precio Inteligente es una herramienta muy potente tanto para traders nuevos como experimentados. Combina más de 20 indicadores útiles en uno solo, combinando ideas avanzadas de trading como el Análisis del Trader del Círculo Inte
AT Forex Indicator MT5
Marzena Maria Szmit
5 (4)
The AT Forex Indicator MT5 is a sophisticated trading tool designed to provide traders with a comprehensive analysis of multiple currency pairs. This powerful indicator simplifies the complex nature of the forex market, making it accessible for both novice and experienced traders. AT Forex Indicator uses advanced algorithms to detect trends, patterns and is an essential tool for traders aiming to enhance their forex trading performance. With its robust features, ease of use, and reliable signal
TrendMaestro5
Stefano Frisetti
note: this indicator is for METATRADER4, if you want the version for METATRADER5 this is the link:  https://www.mql5.com/it/market/product/108106 TRENDMAESTRO ver 2.4 TRENDMAESTRO recognizes a new TREND in the bud, he never makes mistakes. The certainty of identifying a new TREND is priceless. DESCRIPTION TRENDMAESTRO identifies a new TREND in the bud, this indicator examines the volatility, volumes and momentum to identify the moment in which there is an explosion of one or more of these data a
Este tablero muestra los últimos   patrones armónicos   disponibles para los símbolos seleccionados, por lo que ahorrará tiempo y será más eficiente /   versión MT4 . Indicador gratuito:   Basic Harmonic Pattern Columnas del indicador Symbol:   aparecerán los símbolos seleccionados Trend :   alcista o bajista Pattern :   tipo de patrón (gartley, mariposa, murciélago, cangrejo, tiburón, cifrado o ABCD) Entry :   precio de entrada SL:   precio de stop loss TP1:   1er precio de toma de benefici
Este es un genial indicador para MT5 que ofrece señales precisas para entrar en una transacción sin redibujar. Se puede aplicar a cualquier activo financiero: fórex, criptomonedas, metales, acciones, índices. Nos dará valoraciones bastante precisas y nos dirá cuándo es mejor abrir y cerra una transacción. Eche un vistazo  al vídeo  (6:22), ¡contiene un ejemplo de procesamiento de una sola señal que ha amortizado el indicador! La mayoría de los tráders mejoran sus resultados comerciales durante l
FxaccurateLS
Shiv Raj Kumawat
WHY IS OUR FXACCCURATE LS MT5 THE PROFITABLE ? PROTECT YOUR CAPITAL WITH RISK MANAGEMENT Gives entry, stop and target levels from time to time. It finds Trading opportunities by analyzing what the price is doing during established trends. POWERFUL INDICATOR FOR A RELIABLE STRATEGIES We have made these indicators with a lot of years of hard work. It is made at a very advanced level. Established trends provide dozens of trading opportunities, but most trend indicators completely ignore them!
Advanced Supply Demand MT5
Bernhard Schweigert
4.5 (14)
¡Actualmente con 33% de descuento! ¡La mejor solución para cualquier tráder principiante o experto! Este indicador es una herramienta comercial única, de alta calidad y asequible, porque incorpora una serie de características patentadas y una nueva fórmula. Con esta actualización, podrá mostrar zonas de doble marco temporal. No solo podrá mostrar un marco temporal más alto, sino también mostrar ambos, el marco temporal del gráfico MÁS el marco temporal más alto: MOSTRANDO ZONAS ANIDADAS. A todos
TPA True Price Action indicator reveals the true price action of the market makers through 100% non-repainting signals strictly at the close of a candle! TPA shows entries and re-entries, every time the bulls are definitely stronger than the bears and vice versa. Not to confuse with red/green candles. The shift of power gets confirmed at the earliest stage and is ONE exit strategy of several. There are available now two free parts of the TPA User Guide for our customers. The first "The Basics"
Blahtech Supply Demand MT5
Blahtech Limited
4.54 (13)
Was: $299  Now: $99   Supply Demand uses previous price action to identify potential imbalances between buyers and sellers. The key is to identify the better odds zones, not just the untouched ones. Blahtech Supply Demand indicator delivers functionality previously unavailable on any trading platform. This 4-in-1 indicator not only highlights the higher probability zones using a multi-criteria strength engine, but also combines it with multi-timeframe trend analysis, previously confirmed swings
Auto Order Block with break of structure based on ICT and Smart Money Concepts (SMC) Futures Break of Structure ( BoS )             Order block ( OB )            Higher time frame Order block / Point of Interest ( POI )    shown on current chart           Fair value Gap ( FVG ) / Imbalance   -  MTF      ( Multi Time Frame )    HH/LL/HL/LH  -  MTF      ( Multi Time Frame )  Choch  MTF      ( Multi Time Frame )  Volume Imbalance     ,  MTF          vIMB Gap’s Power of 3 Equal High
Black Dragon indicator mt5
Ramil Minniakhmetov
4.81 (54)
El indicador de detección de tendencias complementará cualquier estrategia y también se puede utilizar como una herramienta independiente. Ventajas Fácil de usar, no sobrecarga el gráfico con información innecesaria; Puede usarse como filtro para cualquier estrategia; Tiene niveles integrados de soporte y resistencia dinámicos, que se pueden usar tanto para obtener ganancias como para establecer límites de pérdidas; El indicador no cambia de color después de que se cierra la vela;  Funciona
XQ Indicator MetaTrader 5
Marzena Maria Szmit
3 (2)
Step into the realm of Forex trading with confidence and precision using XQ, a cutting-edge Forex indicator designed to elevate your trading game to unprecedented heights. Whether you're a seasoned trader or just stepping into the world of currency exchange, XQ Forex Indicator empowers you with the insights and signals needed to make informed trading decisions. The signal conditions are a combination of three indicators, and XQ Forex Indicator only display  medium and long-term trends . The ind
FX Volume MT5
Daniel Stein
4.93 (14)
Obtenga su actualización diaria del mercado con detalles y capturas de pantalla a través de nuestro Morning Briefing aquí en mql5 y en Telegram ! FX Volume es el PRIMER y ÚNICO indicador de volumen que proporciona una visión REAL del sentimiento del mercado desde el punto de vista de un bróker. Proporciona una visión impresionante de cómo los participantes institucionales del mercado, como los brokers, están posicionados en el mercado Forex, mucho más rápido que los informes COT. Ver esta info
Was: $249  Now: $99   Market Profile defines a number of day types that can help the trader to determine market behaviour. A key feature is the Value Area, representing the range of price action where 70% of trading took place. Understanding the Value Area can give traders valuable insight into market direction and establish the higher odds trade. It is an excellent addition to any system you may be using. Inspired by Jim Dalton’s book “Mind Over Markets”, this indicator is designed to suit the
Gartley Hunter Multi
Siarhei Vashchylka
5 (8)
Gartley Hunter Multi - An indicator for searching for harmonic patterns simultaneously on dozens of trading instruments and on all possible timeframes. Manual (Be sure to read before purchasing) | Version for MT4 Advantages 1. Patterns: Gartley, Butterfly, Shark, Crab. Bat, Alternate Bat, Deep Crab, Cypher 2. Simultaneous search for patterns on dozens of trading instruments and on all possible timeframes 3. Search for patterns of all possible sizes. From the smallest to the largest 4. A
Este panel descubre y muestra las zonas de   Oferta   y   Demanda   en el gráfico, tanto en modo scalping como a largo plazo, dependiendo de su estrategia de trading para los símbolos seleccionados. Además, el modo de escáner del tablero le ayuda a comprobar todos los símbolos deseados de un vistazo y no perder ninguna posición adecuada /   Versión MT4 Indicador gratuito:   Basic Supply Demand Características Le permite ver las oportunidades de negociación en   múltiples pares de divisa
The Price Action Finder Multi indicator is an indicator of entry points that searches for and displays Price Action system patterns on dozens of trading instruments and on all standard time frames: (m1, m5, m15, m30, H1, H4, D1, Wk, Mn). The indicator places the found patterns in a table at the bottom of the screen. By clicking on the pattern names in the table, you can move to the chart where this pattern is located. Manual (Be sure to read before purchasing) | Version for MT4 Advantages 1. Pa
Matrix Arrow Indicator MT5
Juvenille Emperor Limited
5 (12)
Matrix Arrow Indicator MT5   es una tendencia única 10 en 1 que sigue un indicador   100% sin repintado   de marcos temporales múltiples que se puede usar en todos los símbolos/instrumentos:   divisas ,   materias primas ,   criptomonedas ,   índices ,   acciones .  Matrix Arrow Indicator MT5  determinará la tendencia actual en sus primeras etapas, recopilando información y datos de hasta 10 indicadores estándar, que son: Índice de movimiento direccional promedio (ADX) Índice de canales de prod
Golden Spikes Premium
Kwaku Bondzie Ghartey
5 (1)
Golden Spikes Detector Acknowledgement and Dedications:  The name of this indicator was Inspired by an Original; Mr Grant Koopman; a Knowledgeable and experienced Synthetics trader. I dedicate this indicator to Mr Grant.  Overview: The Golden Spikes Premium is a groundbreaking trading indicator meticulously crafted for the Boom and Crash indices on the Deriv market. Tailored to meet the needs of discerning traders, this powerful tool operates exclusively on the one-minute timeframe, providin
MetaForecast M5
Vahidreza Heidar Gholami
5 (2)
MetaForecast predice y visualiza el futuro de cualquier mercado basándose en las armonías de los datos de precios. Aunque el mercado no siempre es predecible, si existe un patrón en el precio, MetaForecast puede predecir el futuro con la mayor precisión posible. En comparación con otros productos similares, MetaForecast puede generar resultados más precisos al analizar las tendencias del mercado. Parámetros de entrada Past size (Tamaño del pasado) Especifica el número de barras que MetaForecas
Market Overview MT5
Mehran Sepah Mansoor
Optimice sus decisiones de trading con nuestro indicador de fuerza y sentimiento del mercado y deje de operar contra tendencia! Diseñado meticulosamente para los operadores serios que valoran la información precisa y oportuna, nuestro indicador proporciona una vista de pájaro de los 28 pares principales de una manera muy sencilla. Esta herramienta es capaz de clasificar los pares de divisas basándose en términos de popularidad, fuerza de tendencia alcista o bajista y porcentaje de compradores y
Boom and Crash Trend Detector is a  Non-Repaint   MT5 trading system usually being sold for 50 0$ . Most people use this for Deriv but can be used to forex too. The boom and crash spike indicator is a spike detecting software, with Multiple features, these features include. Spike Alert ( from 10 to 100-second warning before spike) Continues spike Alert (for double or continuous spikes at a time) supports all Boom/crash Indices M6 time frame works best here . Bigger time frame trend pointer f
Nuestro innovador   Panel Básico de Patrones de Velas   está diseñado específicamente para identificar patrones de velas rentables en el gráfico de forma automática. Este panel utiliza algoritmos avanzados para escanear los gráficos de precios en tiempo real y detectar una amplia gama de patrones de velas, desde los más clásicos hasta los más complejos. Además, tiene una interfaz fácil de usar que le permite visualizar los patrones detectados en diferentes marcos de tiempo, por lo que es fácil t
Trend Forecaster
Alexey Minkov
5 (6)
The Trend Forecaster indicator utilizes a unique proprietary algorithm to determine entry points for a breakout trading strategy. The indicator identifies price clusters, analyzes price movement near levels, and provides a signal when the price breaks through a level. The Trend Forecaster indicator is suitable for all financial assets, including currencies (Forex), metals, stocks, indices, and cryptocurrencies. You can also adjust the indicator to work on any time frames, although it is recommen
Otros productos de este autor
Levels Mult OHLC
Cinthia Regina De Moraes
Considerando que os preços de OHLC de períodos anteriores são regiões importantes de negociação, criei um indicador que traça linhas de Open, High, Low e Close do dia, semana ou mês anterior no gráfico atual. Além de marcar essas regiões, linhas extras foram inseridas como opção que marcam os MEIOS (50%) dessas regiões e uma linha que marca a ABERTURA do dia. O usuário pode configurar a exibição das linhas que achar mais expressivas. Configurações: PERIOD RANGE Timeframe = Período de referência
Filtro:
No hay comentarios
Respuesta al comentario
Versión 2.0 2023.08.25
Inserido opção de exibir linhas que marcam 50% dos canais percentuais criados.