FVG Imbalance Zones
- Indicadores
- Pierre Alexis Blond
- Versión: 1.0
- Activaciones: 5
Descripción del Indicador de Zonas de Desequilibrio FVG
El Indicador de Zonas de Desequilibrio FVG es una poderosa herramienta diseñada para identificar posibles desequilibrios de precios en los gráficos financieros. Desarrollado por Pierre-Alexis Blond, este innovador indicador marca las áreas donde la oferta y la demanda pueden divergir significativamente, proporcionando a los traders información valiosa sobre posibles puntos de reversión en el mercado.
Características principales:
-
Detección de Desequilibrios: Las Zonas de Desequilibrio FVG identifican posibles desequilibrios de precios en el mercado al detectar áreas donde la oferta y la demanda pueden divergir significativamente. Estas áreas son cruciales para comprender posibles puntos de reversión y rupturas de precios.
-
Parámetros Personalizables: Los traders pueden ajustar fácilmente el tamaño de la ventana de análisis para adaptarse al marco de tiempo seleccionado. El indicador ofrece flexibilidad para seleccionar la ventana óptima y analizar los datos del mercado.
-
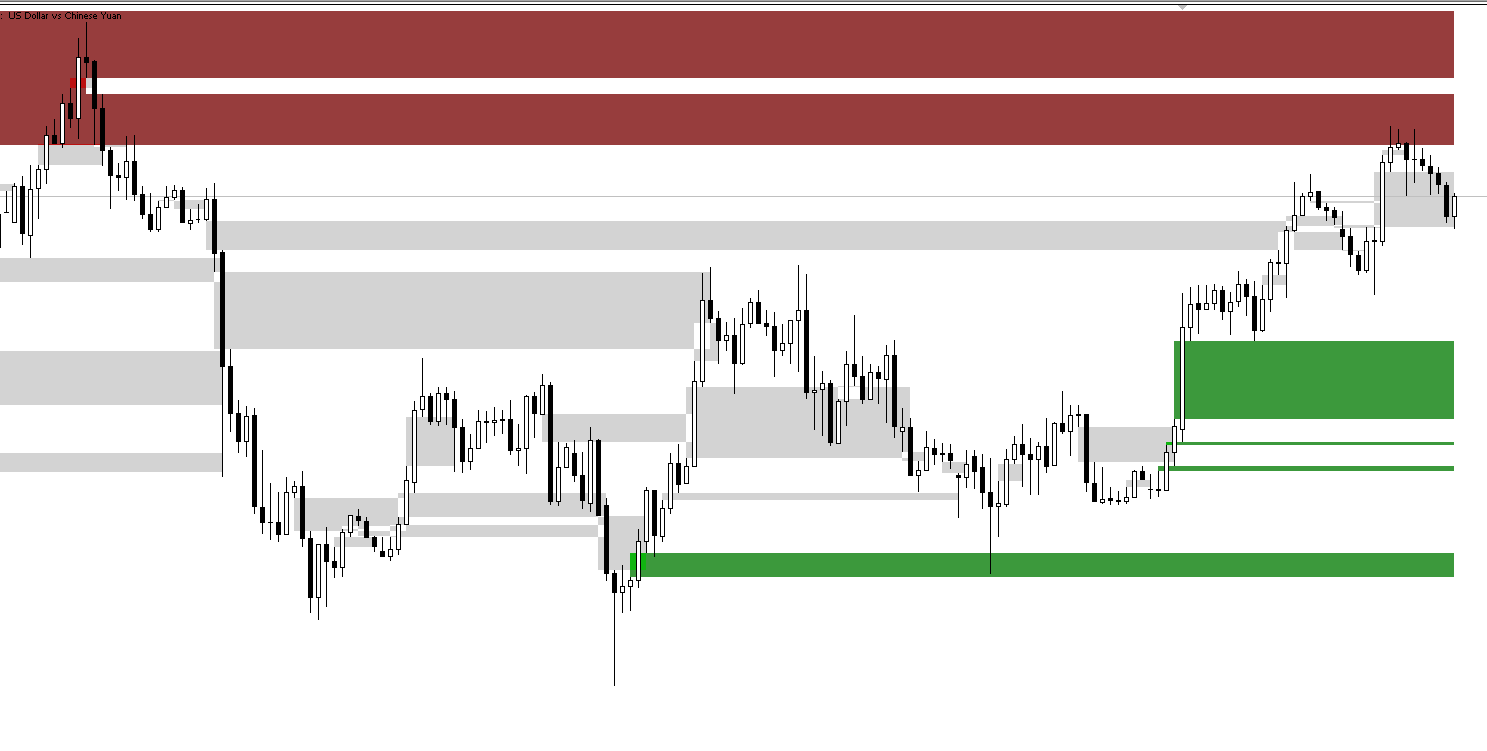
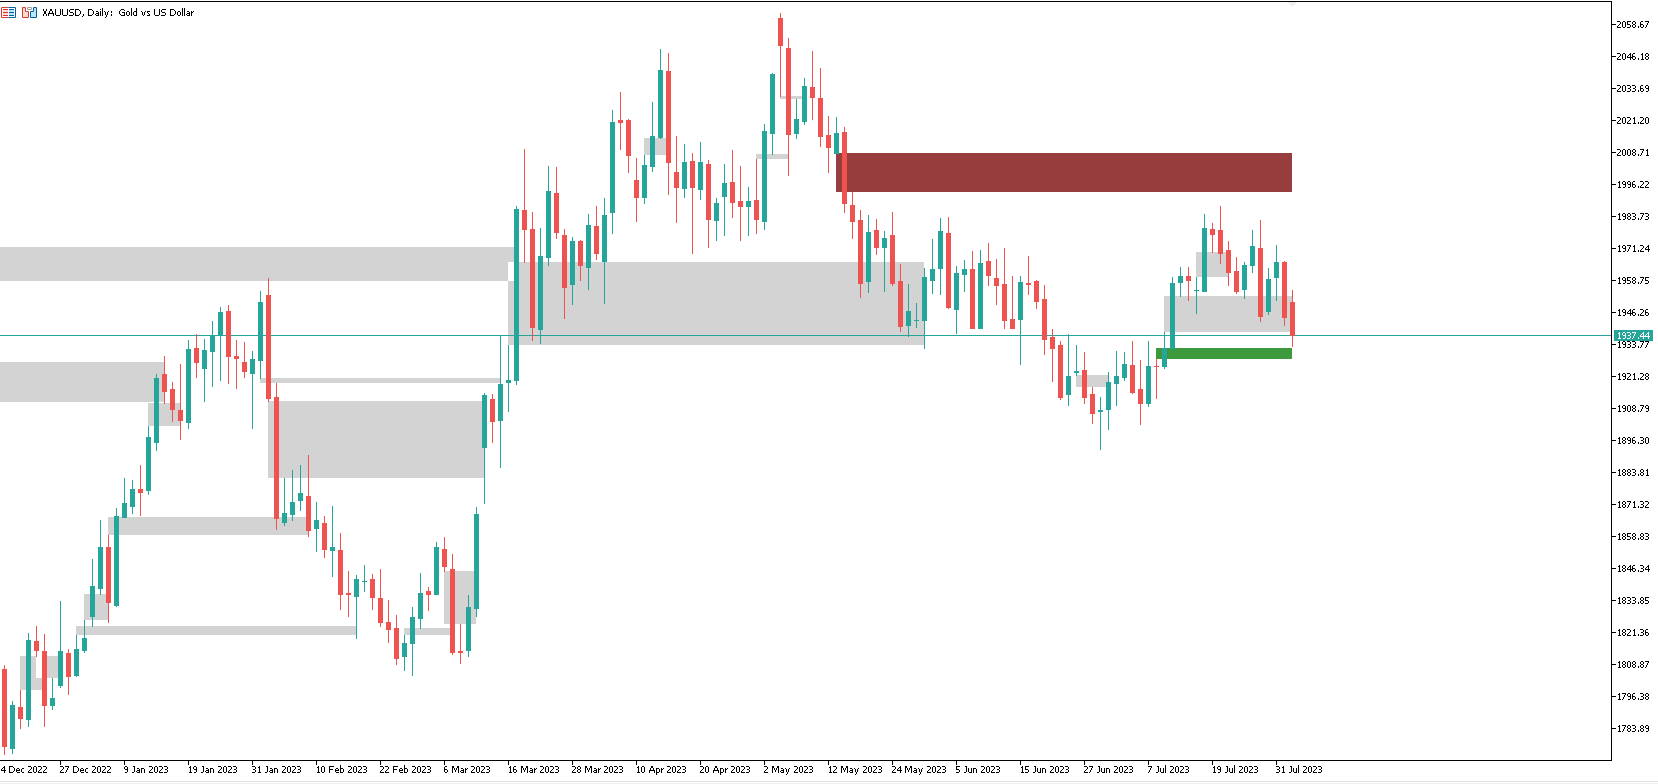
Representación Visual: El indicador marca rectángulos directamente en el gráfico de precios, destacando claramente las áreas de desequilibrio identificadas. Estos rectángulos están coloreados para indicar desequilibrios confirmados, lo que ayuda a los traders a tomar decisiones más rápidas y bien informadas.
-
Interfaz Intuitiva: Con una interfaz sencilla, los traders pueden comprender rápidamente la información esencial, centrándose en las estrategias de trading y las oportunidades del mercado.
-
Actualizaciones Dinámicas: Las Zonas de Desequilibrio FVG se actualizan constantemente a medida que llegan nuevos datos de precios, proporcionando a los traders acceso a información actual y control sobre la evolución del mercado.
Cómo utilizar las Zonas de Desequilibrio FVG:
-
Identificar Zonas de Desequilibrio: Observe los rectángulos en el gráfico que indican posibles zonas de desequilibrio. Los rectángulos verdes indican desequilibrios alcistas, mientras que los rojos indican desequilibrios bajistas.
-
Señales de Confirmación: Preste atención a los rectángulos rellenos, que indican desequilibrios confirmados. Estas áreas pueden actuar como niveles de reversión de precios confiables o puntos de ruptura de tendencia.
-
Ajustar el Tamaño de la Ventana: Adapte el tamaño de la ventana del indicador según su marco de tiempo preferido para el análisis, ya sea que esté haciendo day trading o estrategias a más largo plazo.
-
Combinar con Otros Indicadores: Las Zonas de Desequilibrio FVG se pueden utilizar con éxito en combinación con otros indicadores técnicos para desarrollar estrategias de trading sólidas.
El Indicador de Zonas de Desequilibrio FVG ofrece una perspectiva única sobre la dinámica del mercado, proporcionando a los traders información oportuna sobre posibles movimientos de precios. Al identificar los desequilibrios potenciales de antemano, los traders pueden tomar decisiones informadas, mejorando su éxito en el trading y su comprensión general del mercado. Pruebe el poder de las Zonas de Desequilibrio FVG para mejorar su trading hoy mismo.