PZ Volatmeter
- Indicadores
- PZ TRADING SLU
- Versión: 2.2
- Actualizado: 24 noviembre 2021
- Activaciones: 20
This indicator measures volatility in a multi-timeframe fashion aiming at identifying flat markets, volatility spikes and price movement cycles in the market.
[ Installation Guide | Update Guide | Troubleshooting | FAQ | All Products ]
- Trade when volatility is on your side
- Identify short-term volatility and price spikes
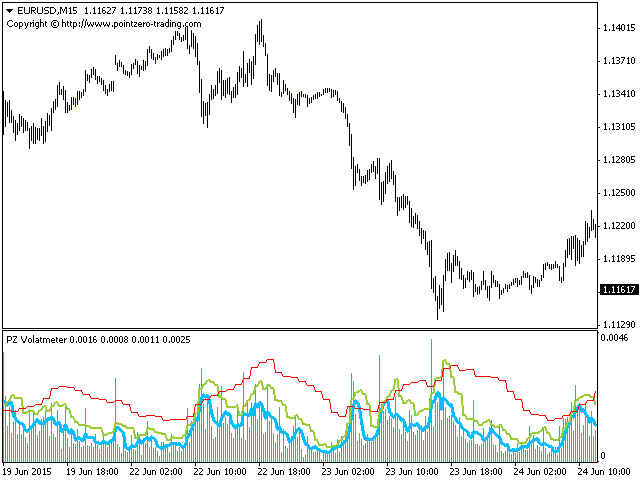
- Find volatility cycles at a glance
- The indicator is non-repainting
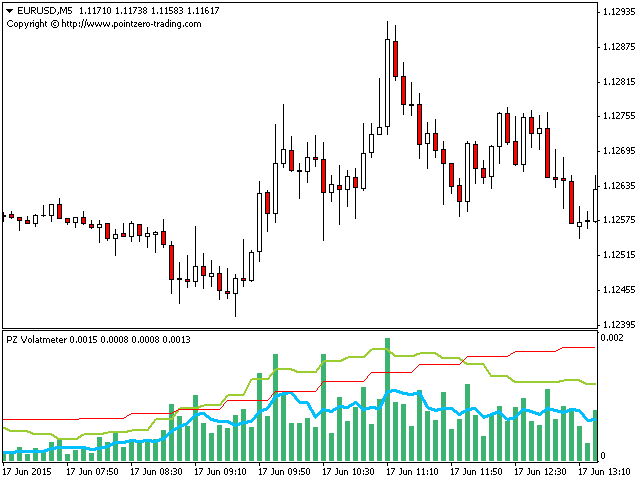
The ingredients of the indicator are the following...
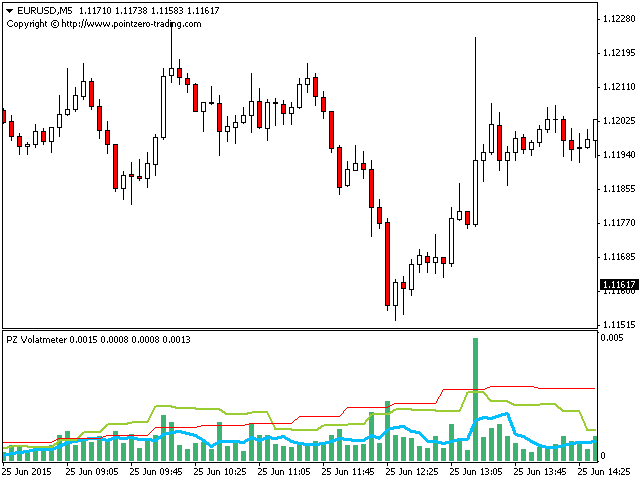
- The green histogram is the current bar volatility
- The blue line is the fast volatility value
- The orange line is the slow volatility value
- The red line is the higher timeframe volatility
...and have straightforward trading implications:
- If the green histogram is above two lines, short-term volatility is extreme
- If the blue line is above the orange line, volatility is generally high
- If the orange line is above the red line, the market volatility is high
-
Zoom out the chart to see the volatility cycle reflected on the red line
Parameters
The only functional parameters of the indicator are the following.
- Fast ATR Period: ATR period for the current timeframe
- Slow ATR Period: ATR period for higher timeframes
Author
Arturo López Pérez, private investor and speculator, software engineer and founder of Point Zero Trading Solutions.




El usuario no ha dejado ningún comentario para su valoración