Vertical Volume
- Indicadores
- Kim Yonghwa
- Versión: 1.3
- Actualizado: 2 septiembre 2023
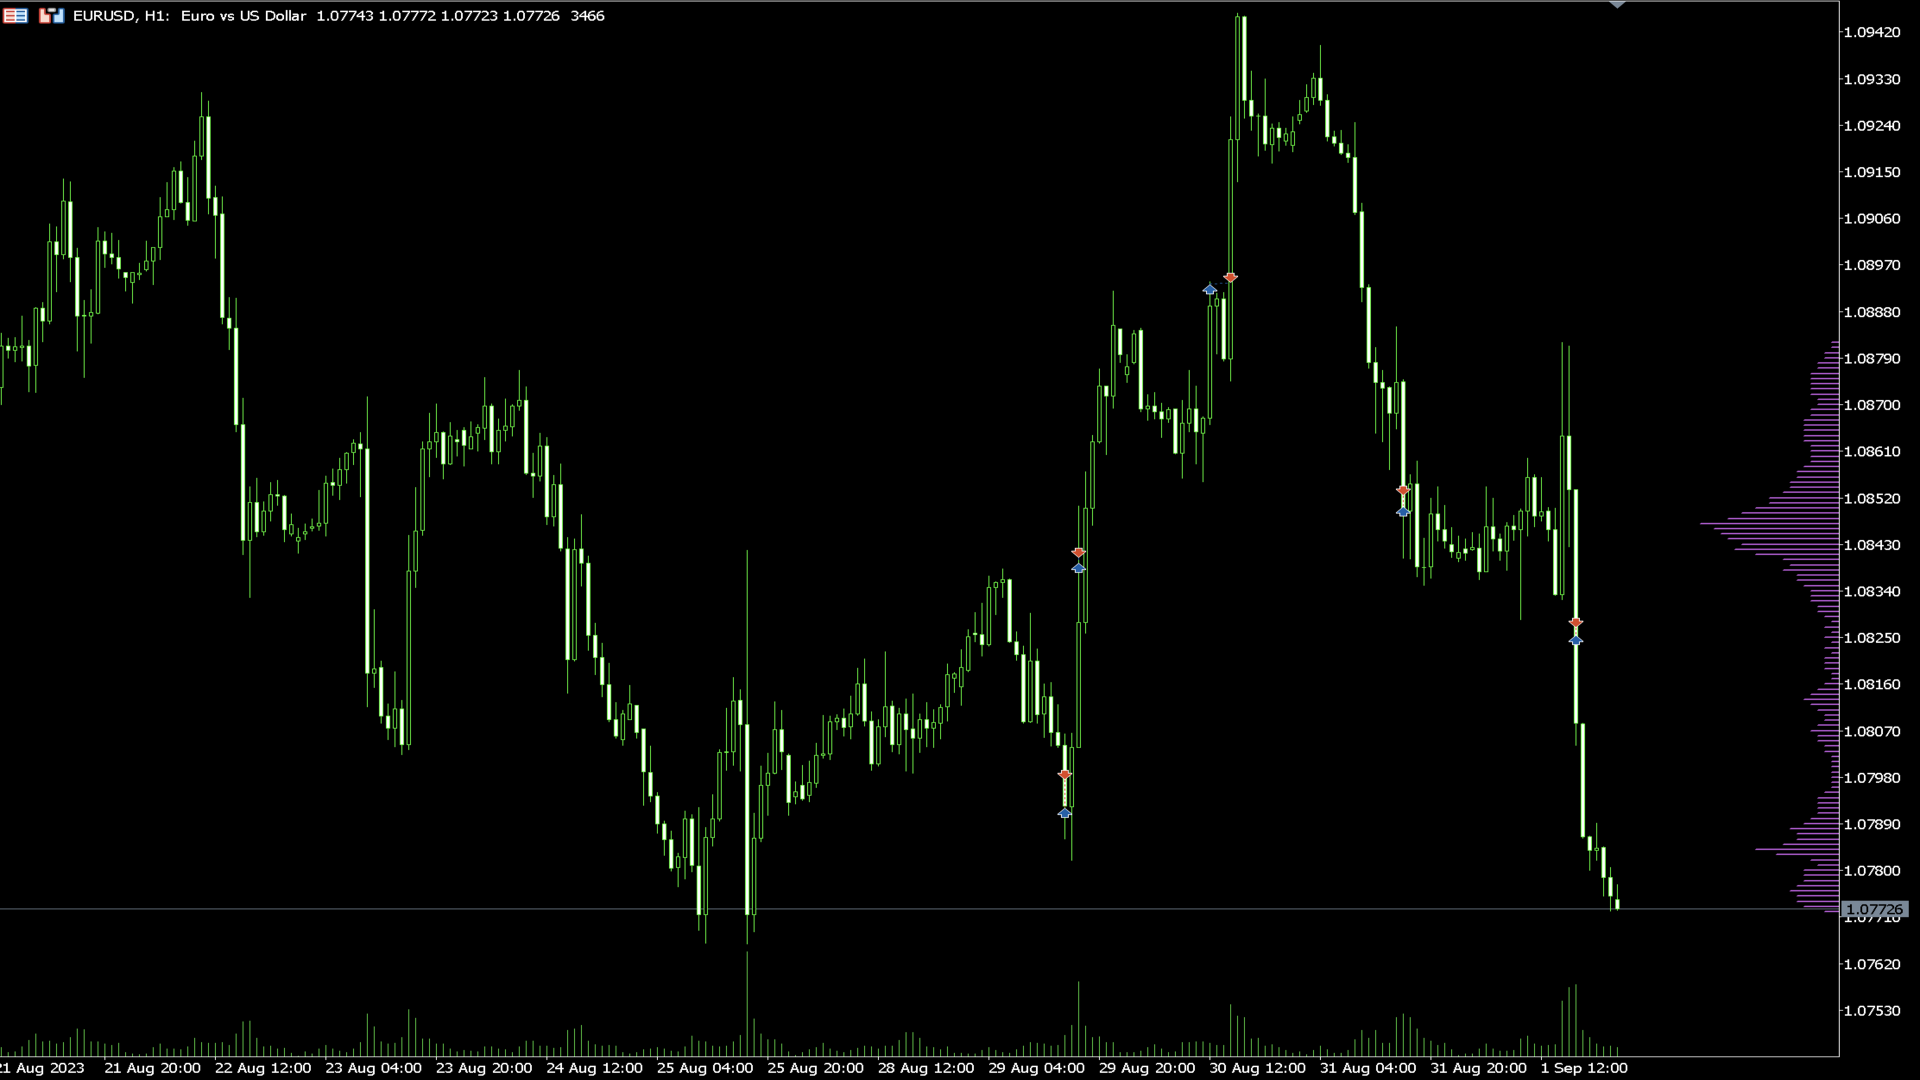
Características
- Indicador para verificar el volumen por precio.
- Funciona principalmente para EURUSD, en otros pares de divisas puede no funcionar o el cálculo puede llevar mucho tiempo.
- Para un uso fluido, activa la opción "Desplazar el borde final del gráfico desde el borde derecho", como se muestra en la captura de pantalla.
- Cuando aparece una nueva barra, se reinician los datos.
Variables
- COlOR: Configuración del color del indicador
- WIDTH: Configuración del ancho del indicador
- PERIOD: Determina el período de tiempo para calcular los datos


not bad