ABCD Harmonic Pattern
- Indicadores
- Davoud Moghaddam
- Versión: 1.0
- Activaciones: 20
| All Symbols AND All Time frames Scan |
|---|
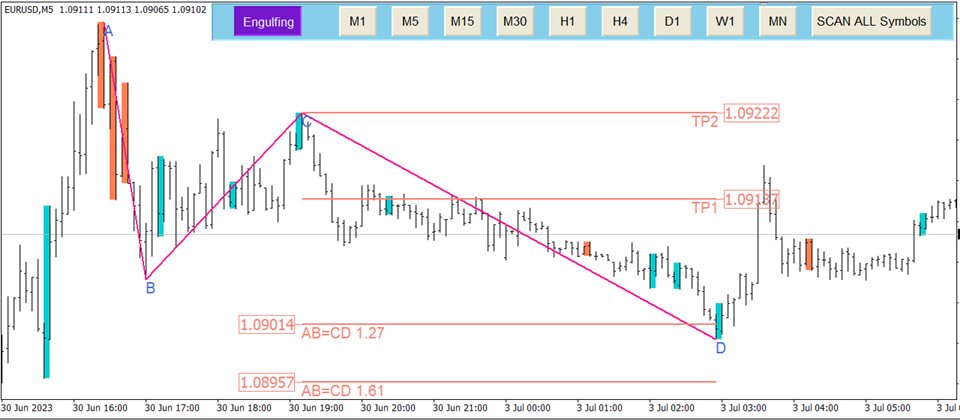
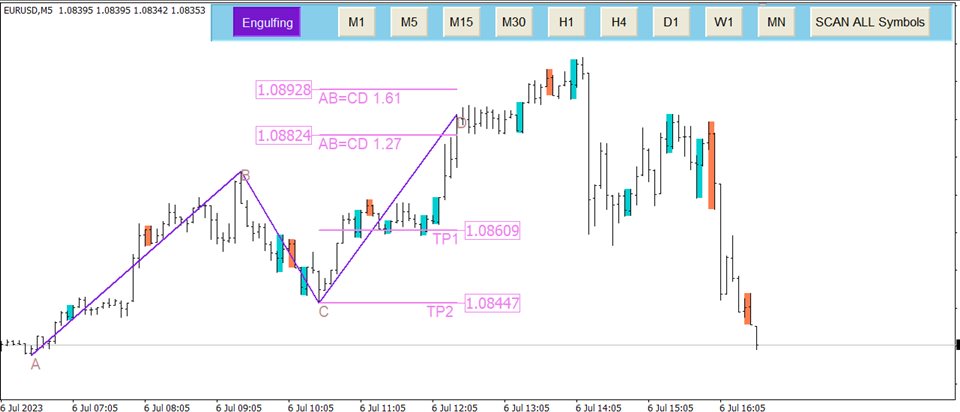
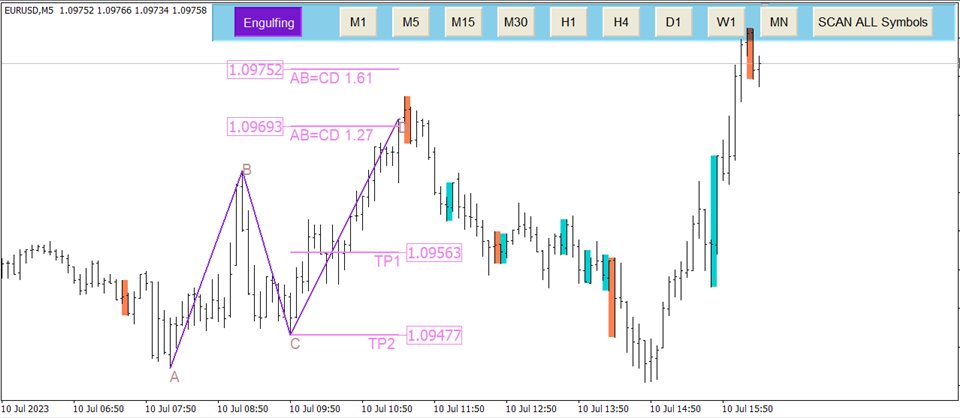
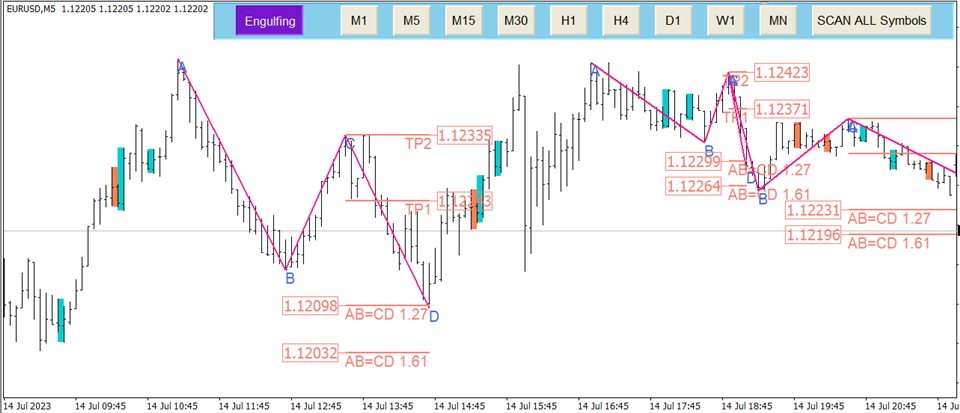
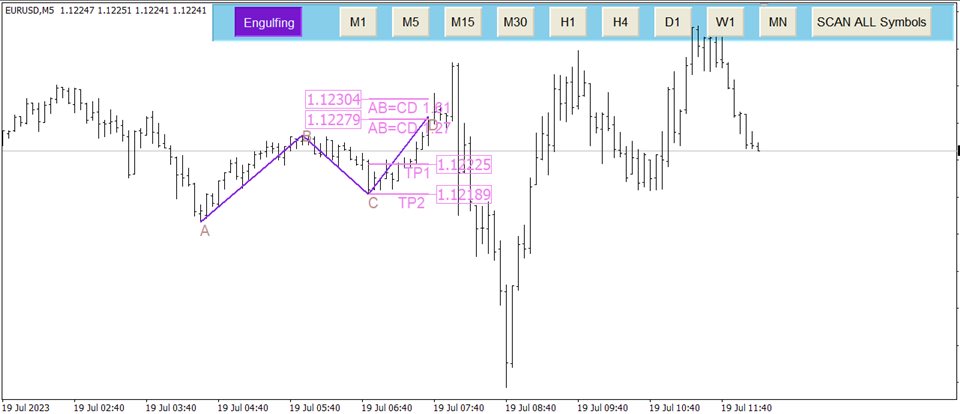
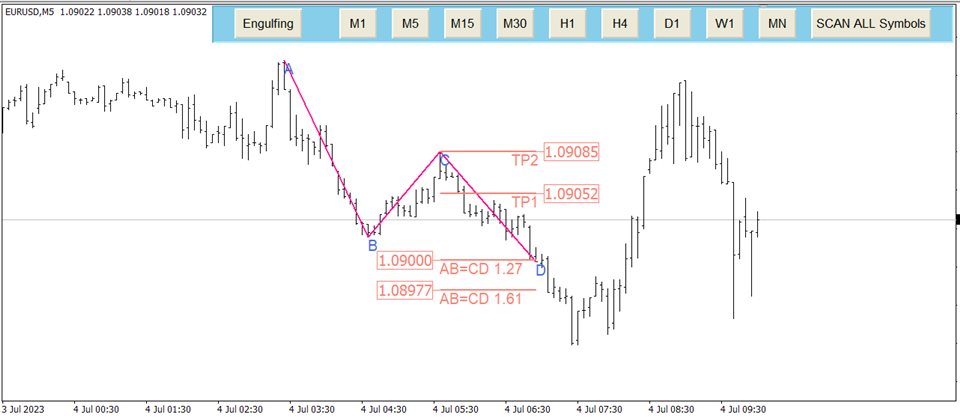
The ABCD is a basic harmonic pattern. The ABCD pattern is a visual, geometric chart pattern comprised of three consecutive price swings. It looks like a diagonal lightning bolt and can indicate an upcoming trading opportunity. This is a valuable pattern to know, as it reflects the rhythmic style in which the market often moves. Essentially, it is made up of four significant highs and lows on the chart. This can appear in both a buy form and a sell form, across any market (including forex, stocks, and more), any condition (rangebound, uptrends, and downtrends), and any timeframe.
engulfing, Bullish and bearish engulfing candlesticks are a key part of technical analysis, often used to identify reversals in the price of an asset commonly Forex.
| Main Features |
|---|
- Easy-to-use and user-friendly indicator
- NO repaint
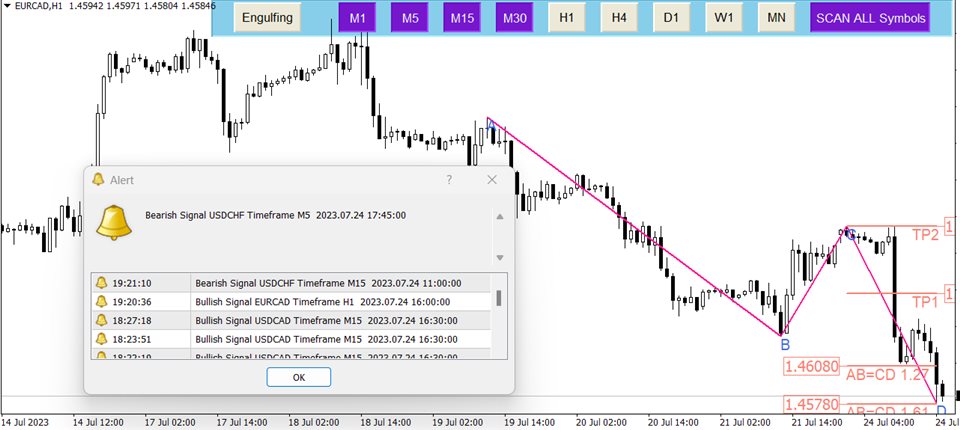
- Sending the alert and push notification and Email
- Fibonacci level is added automatically
- Scan All charts
- Select and deselect time frames button for scan (M1,M5,M15,M30,H1,H4,D1,W1,MN)
- pattern setting
| Input Parameters |
|---|
Display / Style Option
- Changing the color of the bullish breakout , bearish breakout,TP,SL
- Changing line thickness
Alert Settings
- Display Alert, Enable or disable Alert
- Display Notification, Enable or disable Notification
- Send Email, Enable or disable Email
|
|

