• Información general
  • Comentarios
  • Discusión (3)

Daily Highs and Lows

El Indicador Dinámico de Soporte y Resistencia es una herramienta versátil que combina niveles de soporte y resistencia con la dinámica del mercado en tiempo real. Al incorporar máximos y mínimos diarios anteriores, proporciona información valiosa sobre la psicología del mercado e identifica áreas potenciales de inversión de précis o rupturas. Con su capacidad para adaptarse a las condiciones cambiantes del mercado y opciones personalizables, los operadores pueden anticipar las tendencias y tomar decisiones informadas. Este indicador es adecuado para diferentes estilos y marcos temporales de trading, dotando tanto a operadores experimentados como principiantes con una ventaja competitiva.


Key Use Cases :


Una estrategia de trading posible utilizando el Indicador Dinámico de Soporte y Resistencia es la Estrategia de Rompimiento. Esta estrategia tiene como objetivo capturar posibles rupturas de precios cuando el mercado supera niveles clave de soporte o resistencia.


Así es cómo se puede implementar la Estrategia de Rompimiento:


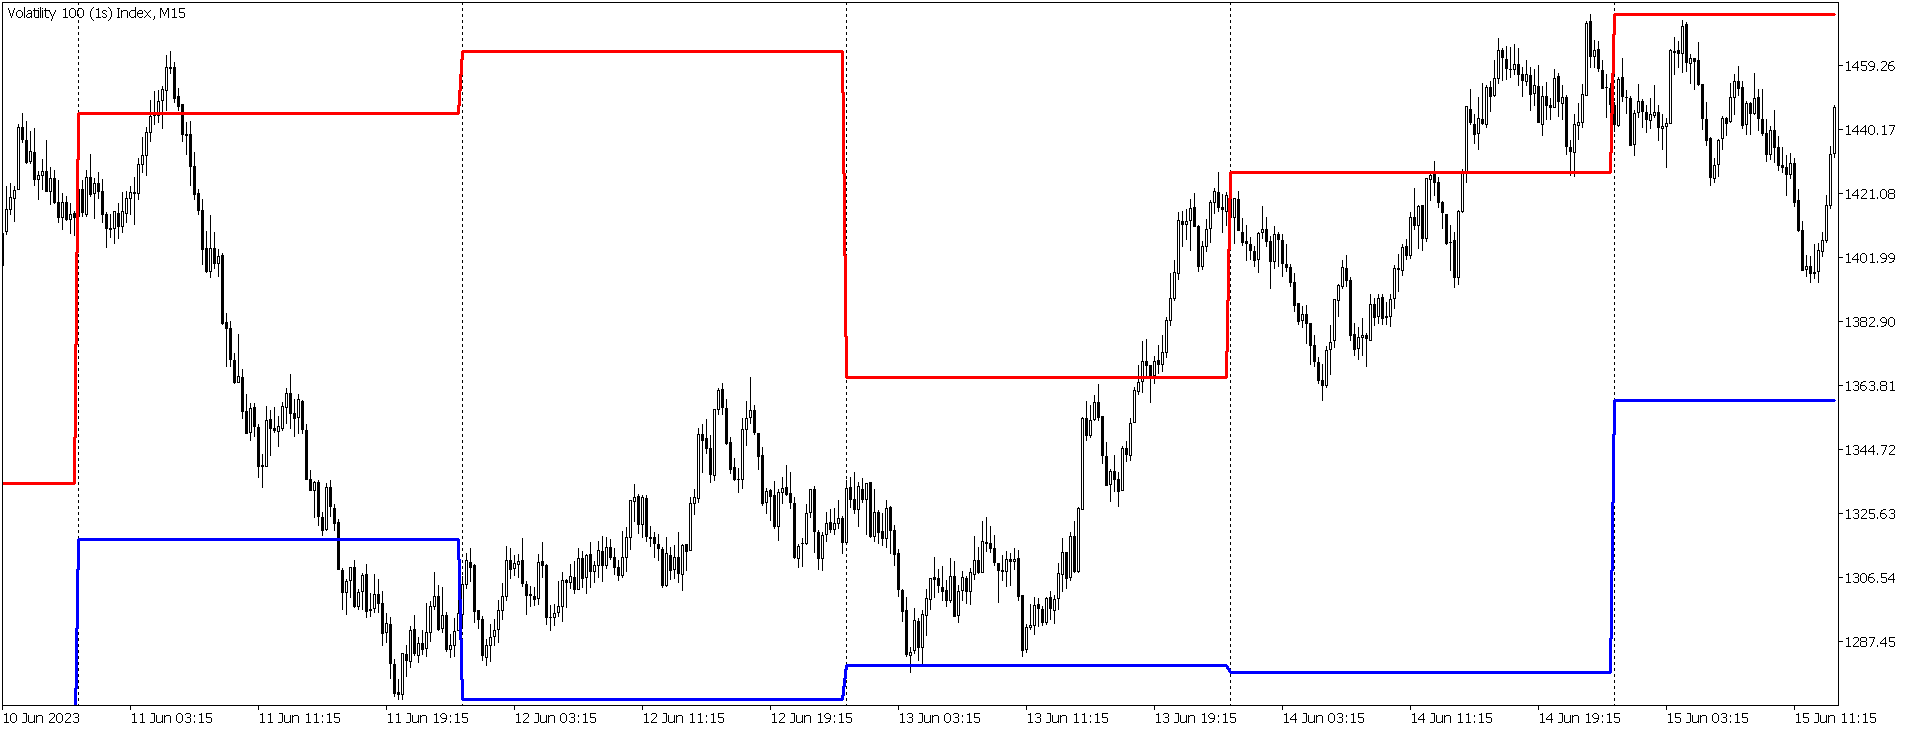
1. Identificar los Niveles Dinámicos de Soporte y Resistencia: Configura el indicador para mostrar los niveles dinámicos de soporte y resistencia basados en los máximos y mínimos diarios anteriores.


2. Esperar la Consolidación: Observa la acción del precio para identificar un período de consolidación donde el precio esté operando dentro de un rango relativamente estrecho. Esto indica que los participantes del mercado no han decidido la dirección próxima.


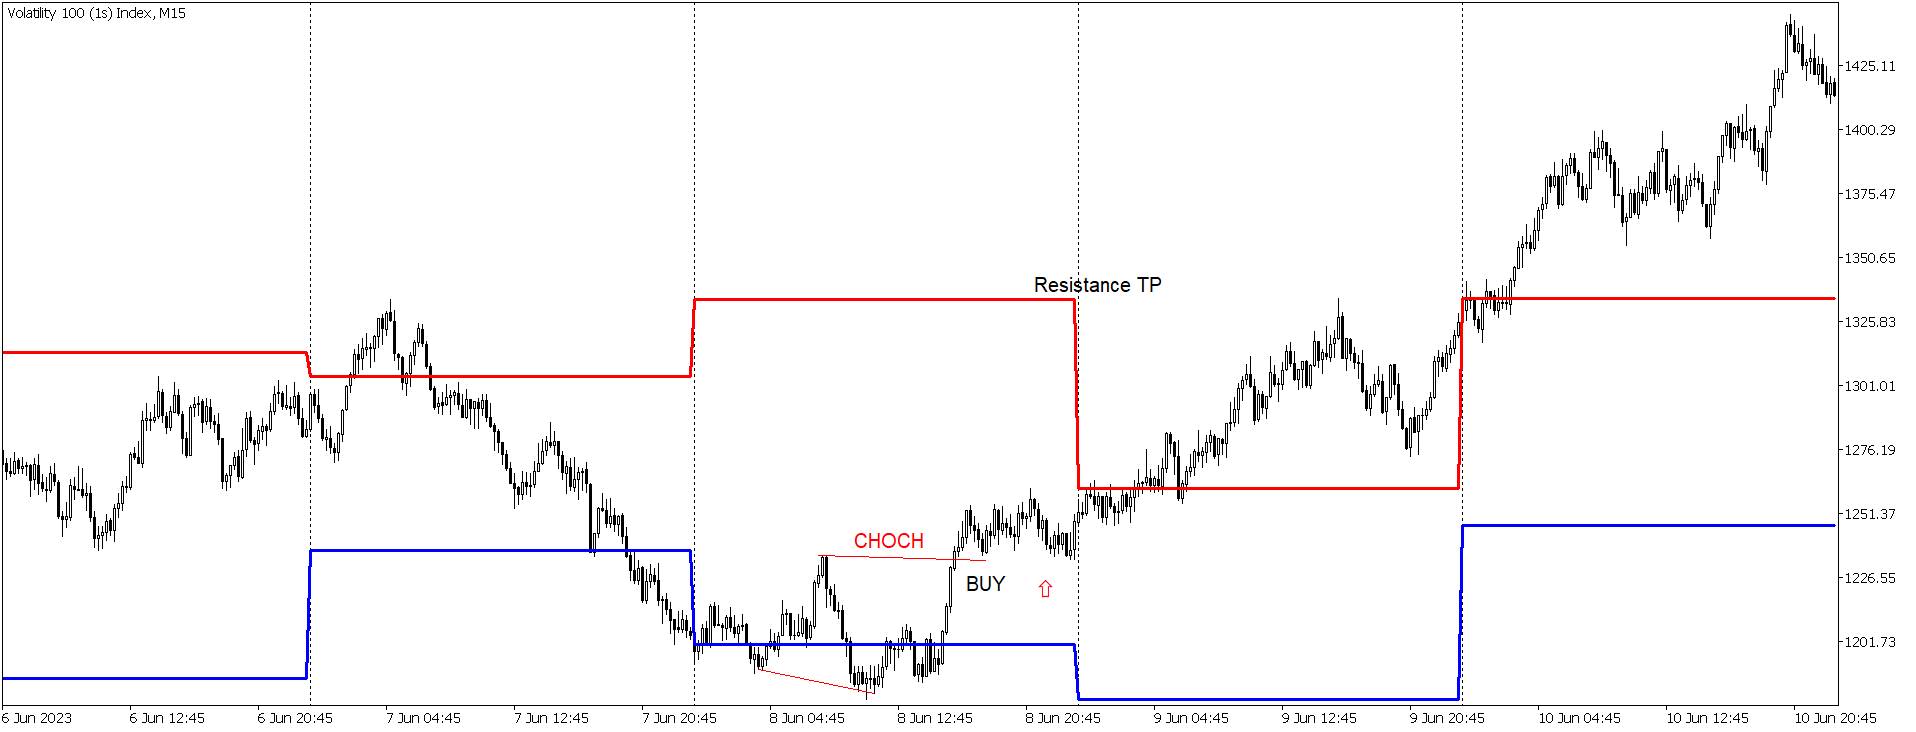
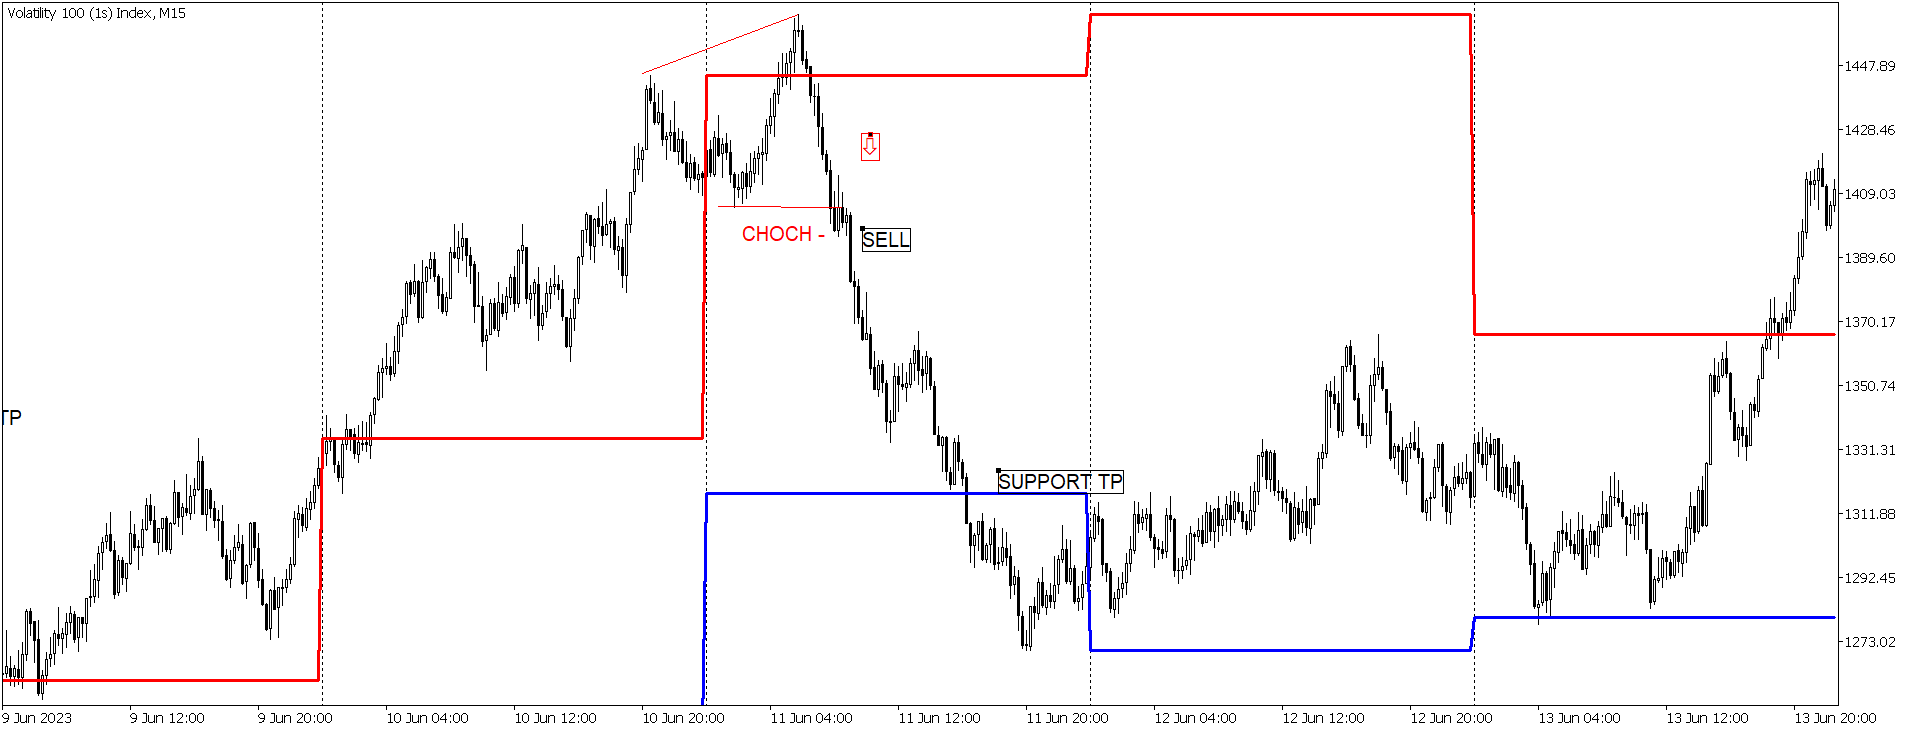
3. Establecer Órdenes de Entrada: Coloca órdenes de compra ligeramente por encima del nivel de resistencia dinámico o órdenes de venta ligeramente por debajo del nivel de soporte dinámico. Esto asegura que si el precio rompe el rango de consolidación, las órdenes se activarán, capturando el posible movimiento de ruptura.


4. Implementar Niveles de Stop Loss y Take Profit: Para gestionar el riesgo, establece una orden de stop loss por debajo del nivel de ruptura para las órdenes de compra o por encima del nivel de ruptura para las órdenes de venta. Esto ayuda a limitar posibles pérdidas en caso de que la ruptura falle. Además, determina un nivel de take profit basado en tu relación riesgo-recompensa o identificando el próximo nivel significativo de soporte o resistencia.


5. Monitorear y Gestionar la Operación: Una vez que ocurre la ruptura y se activa la operación, monitorea la operación de cerca. Ajusta el nivel de stop loss a medida que el precio se mueva a tu favor para proteger las ganancias y potencialmente mover el stop loss para asegurar ganancias.


6. Evaluar los Resultados: Después de que se cierre la operación, evalúa los resultados de la ruptura. Analiza si la ruptura fue exitosa o falsa, e identifica cualquier patrón o condición de mercado que pueda mejorar tu estrategia en el futuro.


Recuerda que es esencial combinar esta estrategia con técnicas adecuadas de gestión de riesgos, como el tamaño de posición y la diversificación de la cartera. Además, realizar pruebas retrospectivas y pruebas en tiempo real de la estrategia con datos históricos y en tiempo real puede proporcionar información valiosa sobre su efectividad antes de comprometer fondos reales.

Productos recomendados
Round Level MT5
Szymon Palczynski
5 (1)
The fact that round number levels have a significant influence on the market cannot be denied and should not be overlooked. These psychological levels are used by both retail Forex traders and major banks that deal in Forex.  Very simple and effective indicator and most importantly free. ////////////////////////////////////////////////////////////////////////////////////////////////////////////////////////////////////////////////////////////// The program does not work in the strategy tester.
FREE
Bollinger Bands Max Free MT5
John Louis Fernando Diamante
5 (1)
A flexible BB indicator You're no longer limited to the built in default of using BB off a SMA method, now you can choose from: SMA - SMMA - EMA - LWMA - ADAPTIVE - FRACTAL ADAPTIVE - DEMA - TEMA - VARIABLE INDEX DYNAMIC You now also have 2 standard deviation levels. A more featured version is available with 5 deviation levels, color gradients to lines and filling as well as candles, with full alerts too: Bollinger Bands Max MT5 Options: - MTF - 9 choices of MA to base the BB off -  2 adjust
FREE
Description The base of this indicator is an ZigZag algorithm based on ATR and Fibo retracement. This indicator is not redrawing in sense that the ZigZag's last shoulder is formed right after the appropriate conditions occur on the market. The shoulder doesn't change its direction afterwards (can only continue). Note:  An indicator with advanced possibilities is also available. Indicator input parameters The input parameters allow to change the sensitivity of the ZigZag. ATR period ATR mul
FREE
Easy GOLD MT5
Franck Martin
4.5 (18)
Easy Gold is the latest addition to the BotGPT family. It is surprising and very powerful. It is ideal for beginners due to its simplicity.  There is absolutely nothing to do, it's 100% automated, simply indicate the percentage of risk you want to take per trade and the EA is ready. Whatever your capital, the EA takes care of everything. Optimized on (XAUUSD).  Unleash all the power with the professional version (AGI Gold) and its connection to the neural network, available in my store. My othe
FREE
Media Móvel Grátis para uso em conjunto ao Diamond Indicator Atenção. Essa é a mm para conjugar ao indicador.  Esse não é o indicador.  Comprem o indicador que está tendo ótimos resultados.  A seguir informações sobre o indicador: Indicador Para Opções Binarias. Usa dois gales. Instalar em mt5 Esse indicador é para ser usado no tempo de vela de 5 minutos e em M5. Este também funciona em M1, porém é mais eficiente em M5. Só descompactar e copiar os arquivos na pasta de dados do seu MT5. Arquivos
FREE
El indicador ROMAN5 Time Breakout traza automáticamente los bloques de la ruptura del soporte o resistencia. Permite al usuario elegir la dirección de la operación. Esta utilidad también tiene incorporada la función del aviso sonoro cuando aparece una nueva señal. Aparte, está disponible la función de avisos vía e-mail. Su dirección del e-mail, así como los parámetros del servidor SMTP tienen que estar indicados en los ajustes del terminal MetaTrader 5 (la pestaña "Correo electrónico"). Flecha a
FREE
After purchasing, you can request and receive any two of my products for free! После покупки вы можете запросить и получить два любых моих продукта бесплатно! Expert Advisor for manual and automatic trading on the trend lines of the indicator       Bollinger Bands. The Expert Advisor draws trend lines from the middle band for a specified number of candles. Important!!! - you need to test the adviser in visual mode. You may be interested in my other products: https://www.mql5.com/ru/users/vy
FREE
Este EA comercia utilizando cruces de medias móviles. Ofrece configuraciones totalmente personalizables, configuraciones flexibles de gestión de posiciones, además de muchas características útiles como sesiones de negociación personalizables y un modo martingala y martingala inversa. [ Guía de instalación | Guía de actualización | Solución de problemas | Preguntas frecuentes | Todos los productos ] Fácil de usar y supervisar Configuraciones de promedio móvil totalmente personalizables Implementa
FREE
Vegas indicador
Valter Cezar Costa
3.5 (2)
Esse Indicador é uma boa opção para quem gosta de operar a longo prazo e com paciência. Ele trabalho com os níveis de fibo na media de 200 são  9 níveis  onde você pode operar nas reversões o mercado partir do níveis abaixo.    Level 1 = 550 pontos    Level 2 = 890 pontos    Level 3 = 1440 pontos    Level 4 = 2330 pontos    Level 5 = 3770 pontos    Level 7 = 9870 pontos    Level 8 = 15970 pontos   Level 9 = 25840 pontos      Level 6 = 6100 pontos
FREE
Heiken Ashi DA
Vitaly Dodonov
4.5 (2)
Что такое Heiken Ashi?    Heiken Ashi — это метод построения графиков, который можно использовать для прогнозирования будущего движения цены. Он похож на традиционные свечные графики. Однако в отличие от обычного свечного графика, график Heiken Ashi пытается отфильтровать часть рыночного шума для лучшего определения трендовых движений на рынке. Как рассчитать Heiken Ashi? Heiken Ashi использует формулу COHL, которая означает «Закрытие, Открытие, Максимум, Минимум». Это четыре компонента, кото
FREE
The custom Bollinger Bands Height indicator measures and displays the current state of the Bollinger Bands indicator, showing whether the bands are widening (moving away from each other) or narrowing (starting to converge). Contraction, indicated by the narrowing of the bands, suggests that the current market movement is losing momentum and hints at the potential start of a new strong movement. This can be a signal to look for an opportune moment to enter a position, as a sharp price change ma
FREE
About the Bollinger Bands The Bollinger Bands indicator was invented by John Bollinger in the 1980s. The Bollinger Bands consist of a Moving Average, an Upper and a Lower Band and is included in Metatrader 5. The default settings are 20 for the period and 2 for the deviation. EasyBot Bollinger Bands is an expert advisor developed with the idea to be useful for traders who love to trade using the popular indicator Bollinger Bands. EasyBot Bollinger Bands has very simple trading logic. When the
FREE
Santa Bollinger
Marco Aurelio Cestari
4.33 (6)
Santa Bollinger Indicator  is an efficient way to detect price retracement in any market. A common approach is to identify overbought or oversold market conditions. When the price of the asset breaks below the lower band of the Bollinger Bands, prices have perhaps fallen too much and are due to bounce. On the other hand, when price breaks above the upper band, the market is perhaps overbought and due for a   pullback . Advantages Generates instant buy and sell signals. Never repaints, never back
FREE
Multi-timeframe trend indicator based on the ADX / ADXWilder indicator with Fibonacci levels The indicator shows trend areas using ADX or ADXWilder indicator data from multiple timeframes. The impulse mode of the indicator allows you to catch the beginning of a trend, and several "Screens" with different timeframes allow you to filter out market noise. Fibonacci levels are added to the price chart, which have flexible settings. How the indicator works: if PDI is greater than NDI, then   it`
FREE
Simple VWAP
Abraao Moreira
4 (1)
Fundamentação teórica A VWAP é uma média móvel ajustada pelo volume, ou seja o peso de cada preço corresponde ao volume de ações negociadas no período, dando mais importância ao período em que se tenha mais negociações. [1] VWAP = sum(price[i]*volume[i]) / sum(volume[i]) Metodologia É possível configurar o período que será utilizado para o calculo da VWAP, a cor, a espessura e o estilo da linha. A linha é desenhada desde a o começo da série disponível apenas uma vez para economizar recursos com
FREE
Bollinger Bands B
Flavio Javier Jarabeck
5 (3)
John Bollinger created this indicator in 2010 as a way to read the original indicator (Bollinger Bands) in a more "technical" way, shown as an oscillator. The typical range of the Bollinger Bands %B is 0 - 0.5 - 1.0, where "0" represents the lower band, the "0.5" the middle band, and "1" the upper band. The line on the indicator represents the Closing prices. As simple as that. SETTINGS Bollinger Bands period of analysis Standard Deviation multiplier Shift Price type to be analyzed If you
FREE
Supports and Macd
Massimo Boncompagni
5 (2)
Embark on an exploration of an unparalleled strategy: "Support and MACD." Meticulously designed for USD/CHF on a one-hour timeframe, this intelligent strategy harnesses the power of robust support levels and the unwavering reliability of MACD indicators. While the number of trades executed might be limited, each trade executed is nothing short of exceptional in its impact and potential. Free until the next update. For any information, contact me.
FREE
Trend Master Chart MT5
Frederic Jacques Collomb
5 (2)
Trend Master Chart es el indicador de tendencia que necesita. Se superpone al gráfico y utiliza códigos de colores para definir diferentes tendencias/movimientos del mercado. Utiliza un algoritmo que combina dos medias móviles y diferentes osciladores. Los periodos de estos tres elementos son modificables. Funciona en cualquier período de tiempo y en cualquier par. De un vistazo podrás identificar una tendencia alcista o bajista y los diferentes puntos de entrada a esta tendencia. Por ejemplo
FREE
RFOC Mini Chart Simple
Ronaldo Franco De Oliveira Cardoso
The RFOC Mini Chart was created to project a macro view of the market, which the option to select the timeframe of interest other than the main chart, it is possible to include 2 indicators: In the full version it is possible to include 2 indicators: 1 - Moving average channel On the mini chart, the moving average will be created based on the prices of the selected time frame for the RFOC Mini Chart. The moving average period must be selected in the indicator settings pannel. 2 - Boillinger Ba
FREE
Quarter EMA
Jithin Sajan Sajan
5 (1)
Kindly rate and comment about the product for upgradation & Support The 5 EMA is plotted in green color ( Lime ). The 14 EMA is plotted in red color ( Red ). The 20 EMA is plotted in blue color ( Blue ). The 200 EMA is plotted in yellow color ( Yellow ). The Quarter EMA that provided calculates and plots four Exponential Moving Averages (EMAs) on the chart using different periods: 5, 14, 20, and 200. Each EMA is represented by a different color on the chart. Here's a description of each
FREE
Quintet EMA
Jithin Sajan Sajan
Kindly rate and comment about the product for upgradation & Support The   5 EMA   is plotted in   green   color ( Lime ). The  14 EMA  is plotted in  red  color ( Red ). The   20 EMA   is plotted in   blue   color ( Blue ). The  200 EMA  is plotted in  black  color ( Black ). The   200 EMA   is plotted in   yellow   color ( Yellow ). The Quarter EMA that provided calculates and plots four Exponential Moving Averages (EMAs) on the chart using different periods: 5, 14, 20, and 200. Each EMA
FREE
LT Force
Thiago Duarte
5 (6)
For those who like trend the Force will be a very useful indicator. This is because it is based on the famouse ADX, which measure the strenght of a trend, but without its 3 confusing lines. Force has its very simple interpretation: if the histogram is above zero level the trend is up, otherwise it is down. You can use it to find divergences too, which is very profitable. Thanks to Andre Sens for the version 1.1 idea. If you have any doubt or suggestion, please, contact me. Enjoy! This is a fre
FREE
Jackson trendlines
Mthandeni Mnyandu
3.33 (3)
Jackson trendline scanner   it a powerful   price action   tool which draw   accurate trendlines   and   alert   a   breakout signals . As we all know that trendlines it a most powerful tool in price action by providing  us with different chart patterns. e.g. Bullish flag, Pennant, Wedges and more...It not easy to draw trend lines, Most successful traders use trendlines to predict the next move based on chart pattern and breakout. Drawing a wrong trendline it a common problem to everyone, wrong
FREE
PipFinite Trend Laser MT5
Karlo Wilson Vendiola
3 (3)
The Pioneer Of Trend Detection! A Powerful Indicator That Avoids Whipsaws And Uncertain Market Noise. Functions mainly as a filter to help you trade in the direction of the trend. It works in any pair or timeframe. Features Advanced trend detection software using complex algorithms that can be used as the supporting tool or system. Unique trend detection that avoids whipsaws and uncertain market noise Analyzes statistics of maximum profits and calculates possible targets for the next signal Fl
PZ The Zone MT5
PZ TRADING SLU
5 (1)
This indicator displays buy or sell signals according to Bill Williams' definition of the Trading Zone. [ Installation Guide | Update Guide | Troubleshooting | FAQ | All Products ] Easy to use and understand Avoid trading flat markets Deterministic indicator with clear rules The indicator is non-repainting It implements alerts of all kinds It has straightforward trading implications. A blue arrow is a buy signal A red arrow is a sell signal According to Bill Williams trading in the zone helps t
FREE
Easy ICT SP500 is an Expert Advisor meticulously crafted to execute trading strategies based on the simplified ICT Bullet Strategy, incorporating Fair Value Gap analysis for precise position entries. Tailored specifically for the SP500, this EA aims to provide traders with a reliable and optimized tool for navigating the dynamic landscape of the stock market. Distinguished Strategy: this EA distinguishes itself by employing a sophisticated yet simplified version of the ICT Bullet Strategy, stra
FREE
Bollinger Bands (BB) are similar to Envelopes. The difference between them is that the boundaries of the Trade Bands (Envelopes) are located above and below the moving average curve at a fixed percentage distance, while the Bollinger Bands are plotted at distances equal to a certain number of standard deviations. Since the magnitude of the standard deviation depends on volatility, the bands themselves adjust their width: it increases when the market is unstable, and decreases in more stable per
ZigZag Support Resistance
Emmanuel Tshepang Mosweu
5 (3)
This indicator uses the Zigzag indicator to identify swing highs and swing lows in the price chart.  Once it has identified the swing highs and swing lows, it can use them to determine potential support and resistance levels. A support level is formed when the price drops and bounces back up from a swing low, indicating that there is buying pressure at that level. A resistance level is formed when the price rises and reverses downward from a swing high, suggesting selling pressure at that level.
FREE
PZ Three Drives MT5
PZ TRADING SLU
3.11 (9)
This indicator finds Three Drives patterns. The Three Drives pattern is a 6-point reversal pattern characterised by a series of higher highs or lower lows that complete at a 127% or 161.8% Fibonacci extension. It signals that the market is exhausted and a reversal can happen. [ Installation Guide | Update Guide | Troubleshooting | FAQ | All Products ] Customizable pattern sizes Customizable colors and sizes Customizable breakout periods Customizable 1-2-3 and 0-A-B ratios It implements visua
FREE
Boom and crash smasher
Lesedi Oliver Seilane
4.53 (38)
Boom and crash smasher free indicator that works on all timeframe from the one minute to the monthly timeframe. the indicator is 100% non-repaint. the indicator come with sound alerts and email push notification the indicator appears on the current candle stick for faster entries can be used on all charts and renko charts orange dot is your sell signal blue dot is your buy signal
FREE
Los compradores de este producto también adquieren
Atomic Analyst MT5
Issam Kassas
5 (14)
En primer lugar, vale la pena enfatizar que este Indicador de Trading no repinta, no redibuja y no se retrasa, lo que lo hace ideal tanto para el trading manual como para el automatizado. Manual del usuario: configuraciones, entradas y estrategia. El Analista Atómico es un Indicador de Acción del Precio PA que utiliza la fuerza y el impulso del precio para encontrar una mejor ventaja en el mercado. Equipado con filtros avanzados que ayudan a eliminar ruidos y señales falsas, y aumentan el poten
Primero que todo, vale la pena enfatizar que este Sistema de Trading es un Indicador No Repintado, No Redibujado y No Retrasado, lo que lo hace ideal tanto para el trading manual como para el automatizado. Curso en línea, manual y descarga de ajustes preestablecidos. El "Sistema de Trading Inteligente MT5" es una solución completa de trading diseñada para traders nuevos y experimentados. Combina más de 10 indicadores premium y presenta más de 7 estrategias de trading robustas, lo que lo convie
Quantum Trend Sniper
Bogdan Ion Puscasu
4.91 (43)
Introduciendo       Indicador Quantum Trend Sniper   , el innovador indicador MQL5 que está transformando la forma en que identificas y negocias los cambios de tendencia. Desarrollado por un equipo de comerciantes experimentados con experiencia comercial de más de 13 años,       Indicador de francotirador de tendencia cuántica       está diseñado para impulsar su viaje comercial a nuevas alturas con su forma innovadora de identificar cambios de tendencia con una precisión extremadamente alta.
FX Power MT5 NG
Daniel Stein
5 (5)
Obtenga su actualización diaria del mercado con detalles y capturas de pantalla a través de nuestro Morning Briefing aquí en mql5 y en Telegram ! FX Power MT5 NG es la nueva generación de nuestro popular medidor de fuerza de divisas, FX Power. ¿Y qué ofrece este medidor de fuerza de nueva generación? Todo lo que le encantaba del FX Power original PLUS Análisis de fuerza de ORO/XAU Resultados de cálculo aún más precisos Períodos de análisis configurables individualmente Límite de cálculo persona
Gold Stuff mt5
Vasiliy Strukov
4.89 (178)
Gold Stuff mt5: un indicador de tendencia diseñado específicamente para el oro, también se puede usar en cualquier instrumento financiero. El indicador no se vuelve a dibujar ni se retrasa. El marco de tiempo recomendado es H1. IMPORTANTE! Póngase en contacto conmigo inmediatamente después de la compra para obtener instrucciones y bonificación!   Puede obtener una copia gratuita de nuestro indicador Strong Support y Trend Scanner, por favor envíe un mensaje privado. ¡a mí! PARÁMETROS Draw
Trend Screener Pro MT5
STE S.S.COMPANY
4.88 (64)
Desbloquee el poder del comercio de tendencias con el indicador Trend Screener: ¡su solución definitiva para el comercio de tendencias impulsada por lógica difusa y un sistema multidivisa!Mejore su comercio de tendencias con Trend Screener, el revolucionario indicador de tendencias impulsado por lógica difusa. Es un poderoso indicador de seguimiento de tendencias que combina más de 13 herramientas y funciones premium y 3 estrategias comerciales, lo que lo convierte en una opción versátil para co
Ante todo, vale la pena enfatizar que esta Herramienta de Trading es un Indicador No Repintado, No Redibujado y No Retrasado, lo que la hace ideal para el trading profesional. Curso en línea, manual del usuario y demostración. El Indicador de Conceptos de Acción del Precio Inteligente es una herramienta muy potente tanto para traders nuevos como experimentados. Combina más de 20 indicadores útiles en uno solo, combinando ideas avanzadas de trading como el Análisis del Trader del Círculo Inte
FX Volume MT5
Daniel Stein
4.94 (17)
Obtenga su actualización diaria del mercado con detalles y capturas de pantalla a través de nuestro Morning Briefing aquí en mql5 y en Telegram ! FX Volume es el PRIMER y ÚNICO indicador de volumen que proporciona una visión REAL del sentimiento del mercado desde el punto de vista de un bróker. Proporciona una visión impresionante de cómo los participantes institucionales del mercado, como los brokers, están posicionados en el mercado Forex, mucho más rápido que los informes COT. Ver esta info
Reversal First Impulse levels (RFI)      INSTRUCTIONS        RUS       -       ENG              R ecommended to use with an indicator   -   TREND PRO -  Version MT4                 A key element in trading is zones or levels from which decisions to buy or sell a trading instrument are made. Despite attempts by major players to conceal their presence in the market, they inevitably leave traces. Our task was to learn how to identify these traces and interpret them correctly. Main functions:: Di
Bill Williams Advanced
Siarhei Vashchylka
5 (5)
Bill Williams Advanced is designed for automatic chart analysis using Bill Williams' "Profitunity" system. The indicator analyzes four timeframes at once. Manual (Be sure to read before purchasing) Advantages 1. Automatically analyzes the chart using the "Profitunity" system of Bill Williams. The found signals are placed in a table in the corner of the screen. 2. Equipped with a trend filter based on the Alligator indicator. Most of the system signals are recommended to be used only accordi
TPSproTREND PrO MT5
Roman Podpora
4.88 (8)
TPSpro TRENDPRO  - is a trend indicator that automatically analyzes the market and provides information about the trend and each of its changes, as well as giving signals for entering trades without redrawing! The indicator uses each candle, analyzing them separately. referring to different impulses - up or down impulse. Exact entry points into transactions for currencies, crypto, metals, stocks, indices!  -  Version MT4               DETAILED DESCRIPTION               R ecommended to use with
AW Trend Predictor MT5
AW Trading Software Limited
4.78 (58)
La combinación de niveles de tendencia y ruptura en un sistema. Un algoritmo de indicador avanzado filtra el ruido del mercado, determina la tendencia, los puntos de entrada y los posibles niveles de salida. Las señales indicadoras se registran en un módulo estadístico, que le permite seleccionar las herramientas más adecuadas, mostrando la efectividad del historial de señales. El indicador calcula las marcas Take Profit y Stop Loss. Manual e instrucciones ->   AQUÍ   / Versión MT4 ->   AQUÍ Có
ICT, SMC, SMART MONEY CONCEPTS, SMART MONEY, Smart Money Concept, Support and Resistance, Trend Analysis, Price Action, Market Structure, Order Blocks, BOS/CHoCH,   Breaker Blocks ,  Momentum Shift,   Supply&Demand Zone/Order Blocks , Strong Imbalance,   HH/LL/HL/LH,    Fair Value Gap, FVG,  Premium  &   Discount   Zones, Fibonacci Retracement, OTE, Buy Side Liquidity, Sell Side Liquidity, BSL/SSL Taken, Equal Highs & Lows, MTF Dashboard, Multiple Time Frame, BigBar, HTF OB, HTF Market Structure
Easy By Sell is a market indicator for opening and closing positions. It becomes easy to track market entries with alerts. It indicates trend reversal points when a price reaches extreme values ​​and the most favorable time to enter the market. it is as effective as a Fibonacci to find a level but it uses different tools such as an algorithm based on ATR indicators and Stochastic Oscillator. You can modify these two parameters as you wish to adapt the settings to the desired period. My othe
Conviértase en un Breaker Trader y obtenga beneficios de los cambios en la estructura del mercado a medida que se invierte el precio. El indicador de ruptura de bloque de órdenes identifica cuándo una tendencia o movimiento de precio se acerca al agotamiento y está listo para revertirse. Le alerta sobre cambios en la estructura del mercado que generalmente ocurren cuando una reversión o un retroceso importante están a punto de suceder. El indicador utiliza un cálculo patentado que identific
The Volume by Price Indicator for MetaTrader 5 features Volume Profile and Market Profile TPO (Time Price Opportunity). Volume and TPO histogram bar and line charts. Volume Footprint charts. TPO letter and block marker collapsed and split structure charts. Session filtering and grouping. Static, dynamic and flexible range segmentation and compositing methods with relative and absolute visualizations. Graphical layering, positioning and styling options to suit the user's analytic and aesthetic n
Este es un genial indicador para MT5 que ofrece señales precisas para entrar en una transacción sin redibujar. Se puede aplicar a cualquier activo financiero: fórex, criptomonedas, metales, acciones, índices. Nos dará valoraciones bastante precisas y nos dirá cuándo es mejor abrir y cerra una transacción. Eche un vistazo  al vídeo  (6:22), ¡contiene un ejemplo de procesamiento de una sola señal que ha amortizado el indicador! La mayoría de los tráders mejoran sus resultados comerciales durante l
"Piranha" - an autonomous trading system that determines overbought and oversold levels on the chart. Red and blue zones represent overbought and oversold levels respectively. Entry points are marked with arrows: a downward arrow in the red zone for "sell" and an upward arrow in the blue zone for "buy". The Take profit level is indicated by the green moving average. Key features: Adjusting the Take profit level as the green moving average changes position. Averaging ability when a new market e
Quantum Heiken Ashi PRO MT5
Bogdan Ion Puscasu
4.5 (8)
Presentamos el   Quantum Heiken Ashi PRO Diseñadas para brindar información clara sobre las tendencias del mercado, las velas Heiken Ashi son reconocidas por su capacidad para filtrar el ruido y eliminar las señales falsas. Diga adiós a las confusas fluctuaciones de precios y dé la bienvenida a una representación gráfica más fluida y confiable. Lo que hace que Quantum Heiken Ashi PRO sea realmente único es su fórmula innovadora, que transforma los datos de velas tradicionales en barras de colore
Legacy of Gann for MT5
Pavel Zamoshnikov
5 (6)
The indicator very accurately determines the levels of the possible end of the trend and profit fixing. The method of determining levels is based on the ideas of W.D.Gann, using an algorithm developed by his follower Kirill Borovsky. Extremely high reliability of reaching levels (according to K. Borovsky  - 80-90%) Indispensable for any trading strategy – every trader needs to determine the exit point from the market! Precisely determines targets on any timeframes and any instruments (forex, met
** All Symbols x All Timeframes scan just by pressing scanner button ** ***Contact me after purchase to send you instructions and add you in "123 scanner group" for sharing or seeing experiences with other users. After 17 years of experience in the markets and programming, Winner indicator is ready. I would like to share with you! Introduction The 123 Pattern Scanner indicator with a special enhanced algorithm is a very repetitive common pattern finder with a high success rate . Interestingly,
Advanced Supply Demand MT5
Bernhard Schweigert
4.53 (15)
¡Actualmente con 33% de descuento! ¡La mejor solución para cualquier tráder principiante o experto! Este indicador es una herramienta comercial única, de alta calidad y asequible, porque incorpora una serie de características patentadas y una nueva fórmula. Con esta actualización, podrá mostrar zonas de doble marco temporal. No solo podrá mostrar un marco temporal más alto, sino también mostrar ambos, el marco temporal del gráfico MÁS el marco temporal más alto: MOSTRANDO ZONAS ANIDADAS. A todos
IX Power MT5
Daniel Stein
5 (3)
IX Power   lleva por fin la insuperable precisión de FX Power a los símbolos que no son de Forex. Determina con exactitud la intensidad de las tendencias a corto, medio y largo plazo de tus índices, acciones, materias primas, ETF e incluso criptodivisas favoritas. Puede   analizar todo lo   que su terminal le ofrece. Pruébalo y experimenta cómo   tu timing mejora significativamente   a la hora de operar. Características principales de IX Power Resultados de cálculo 100% precisos y sin rep
El indicador de reversión de ADR le muestra de un vistazo dónde se cotiza actualmente el precio en relación con su rango diario promedio normal. Recibirá alertas instantáneas a través de una ventana emergente, correo electrónico o push cuando el precio exceda su rango promedio y los niveles por encima de su elección para que pueda saltar rápidamente a retrocesos y reversiones. El indicador dibuja líneas horizontales en el gráfico en los extremos del rango promedio diario y también extensiones p
Gartley Hunter Multi
Siarhei Vashchylka
5 (7)
Gartley Hunter Multi - An indicator for searching for harmonic patterns simultaneously on dozens of trading instruments and on all possible timeframes. Manual (Be sure to read before purchasing) | Version for MT4 Advantages 1. Patterns: Gartley, Butterfly, Shark, Crab. Bat, Alternate Bat, Deep Crab, Cypher 2. Simultaneous search for patterns on dozens of trading instruments and on all possible timeframes 3. Search for patterns of all possible sizes. From the smallest to the largest 4. A
¡La mejor solución para cualquier operador novato o experto! Este indicador es una herramienta única, de alta calidad y asequible porque hemos incorporado una serie de características propias y una nueva fórmula. ¡Con sólo UN gráfico puede leer la Fuerza de la Divisa para 28 pares de Divisas! Imagínese cómo mejorará su operativa porque podrá señalar el punto exacto de activación de una nueva tendencia o de una oportunidad de scalping. Manual del usuario: haga   clic aquí Ese es el primero
Fractal Advanced MT5
Siarhei Vashchylka
5 (3)
Fractal Advanced - displays Fractal and Alligator indicators on the price chart. Has wide options for settings and customization. It is also equipped with alerts and a hotkey system. Manual (Be sure to read before purchasing) | Version for MT4 Advantages 1. The indicator does not fill the entire chart with fractals, but allows you to display only relevant signals. 2. The number of fractals is adjusted by scrolling the mouse while holding down the Shift key. 3. Instantly show/hide the Alligator
FxaccurateLS
Shiv Raj Kumawat
WHY IS OUR FXACCCURATE LS MT5 THE PROFITABLE ? PROTECT YOUR CAPITAL WITH RISK MANAGEMENT Gives entry, stop and target levels from time to time. It finds Trading opportunities by analyzing what the price is doing during established trends. POWERFUL INDICATOR FOR A RELIABLE STRATEGIES We have made these indicators with a lot of years of hard work. It is made at a very advanced level. Established trends provide dozens of trading opportunities, but most trend indicators completely ignore them!
TPA True Price Action indicator reveals the true price action of the market makers through 100% non-repainting signals strictly at the close of a candle! TPA shows entries and re-entries, every time the bulls are definitely stronger than the bears and vice versa. Not to confuse with red/green candles. The shift of power gets confirmed at the earliest stage and is ONE exit strategy of several. There are available now two free parts of the TPA User Guide for our customers. The first "The Basics"
Este tablero muestra los últimos   patrones armónicos   disponibles para los símbolos seleccionados, por lo que ahorrará tiempo y será más eficiente /   versión MT4 . Indicador gratuito:   Basic Harmonic Pattern Columnas del indicador Symbol:   aparecerán los símbolos seleccionados Trend :   alcista o bajista Pattern :   tipo de patrón (gartley, mariposa, murciélago, cangrejo, tiburón, cifrado o ABCD) Entry :   precio de entrada SL:   precio de stop loss TP1:   1er precio de toma de benefici
Otros productos de este autor
Introducing the Ultimate Scalping and Swing Trading EA - Unlock the Power of ZigZag and Fibonacci Retracements! Risk Management Settings: - Lot Size: 0.01 (automatically calculated based on your account balance) - Risk Stop Loss (SL): 1.5% of price - Take Profit (TP): 1:1.5 risk-reward ratio Are you tired of traditional trading methods that yield mediocre results? Do you seek an EA that can navigate the complexities of the forex market with precision and finesse? Look no further! Our cuttin
Filtro:
No hay comentarios
Respuesta al comentario