Average Trade Levels
- Indicadores
- Makarii Gubaydullin
- Versión: 1.35
- Actualizado: 10 agosto 2023
- Activaciones: 5
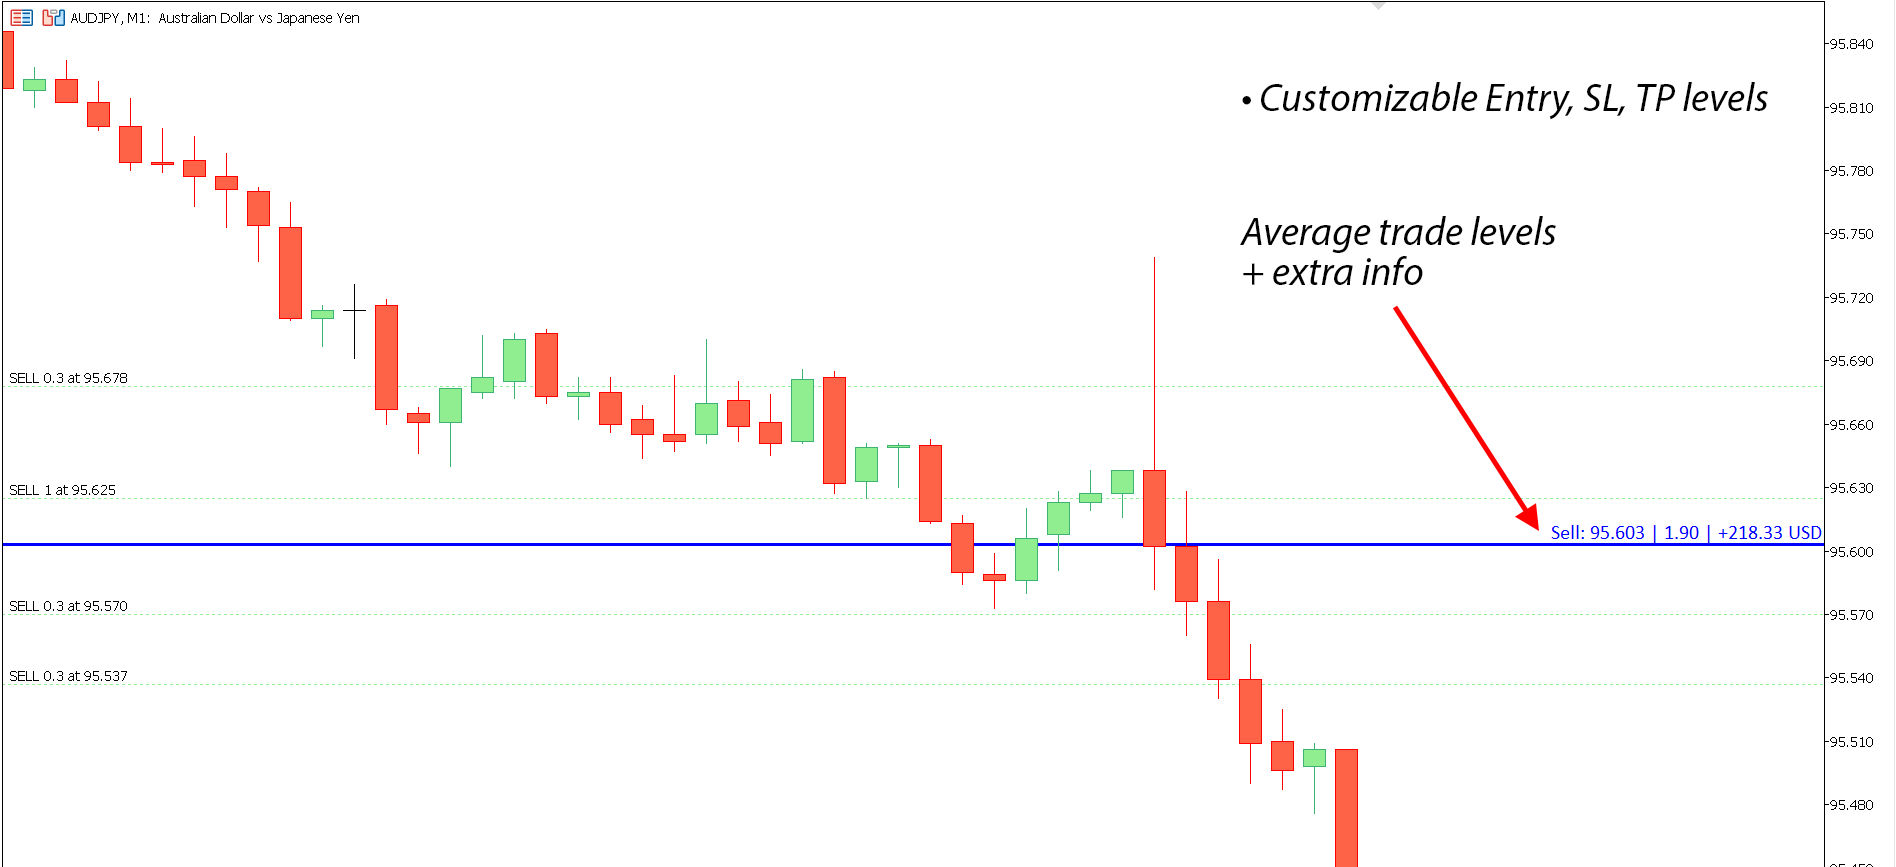
Los niveles promedio de entrada, SL y TP de todas las operaciones en el símbolo.
Los niveles pueden calcularse juntos o por separado para operaciones de compra y venta.
Puedes mostrar opcionalmente información adicional: precio del nivel, tamaño total del lote, P/L flotante.
Los estilos y colores de los niveles son personalizables.
Utilidad multifuncional: incluye 66+ funciones | Contáctame si tienes alguna pregunta | Versión para MT5
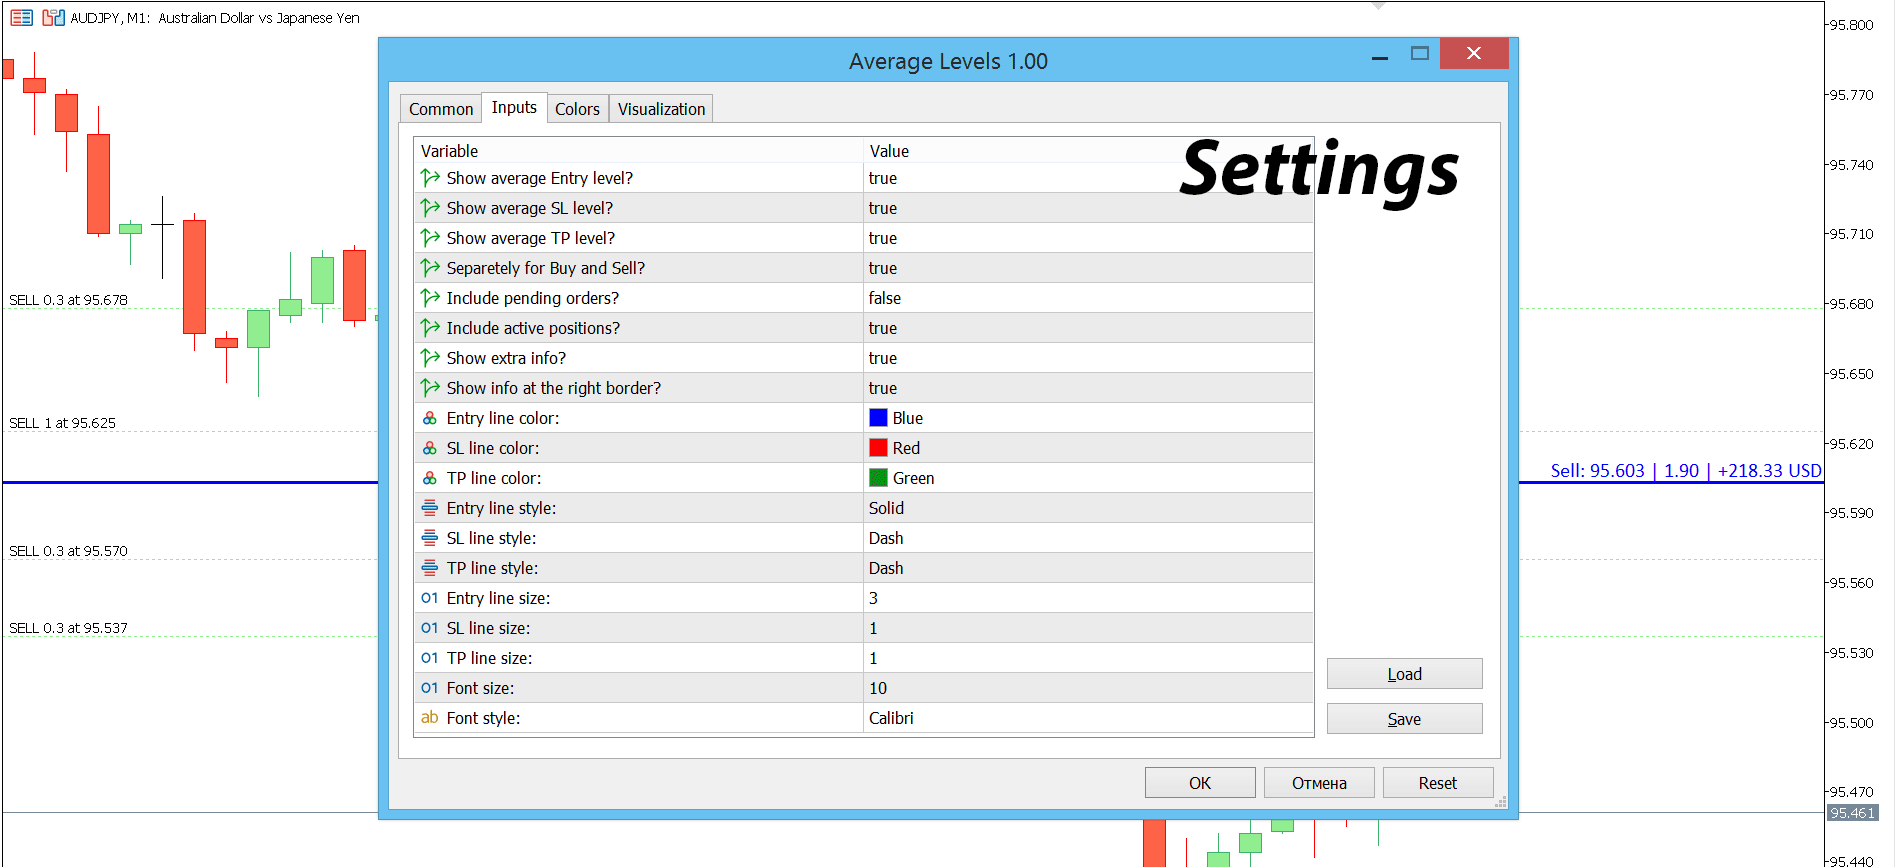
En la configuración del indicador, puedes configurar:
- Nivel de entrada promedio: encendido/apagado;
- Nivel de SL promedio: encendido/apagado;
- Nivel de TP promedio: encendido/apagado;
- Por separado para compras y ventas: si se selecciona 'false' - los niveles se calcularán juntos para compras y ventas.
- Incluir órdenes pendientes: encendido/apagado;
- Incluir posiciones activas: encendido/apagado;
- Mostrar información extra: encendido/apagado;
- ¿Mostrar información en el borde derecho? si 'false': la información extra se mostrará en el borde izquierdo;
- Color de línea y texto: para entrada, SL y TP;
- Estilo de línea: para niveles de entrada, SL y TP;
- Tamaño de línea: para niveles de entrada, SL y TP;
- 'Tamaño de fuente' y 'Estilo de fuente': si se habilita 'Mostrar información extra'.
El archivo del programa debe colocarse en el directorio "Indicators".