• Información general
  • Comentarios
  • Discusión

AI Binary Sniper

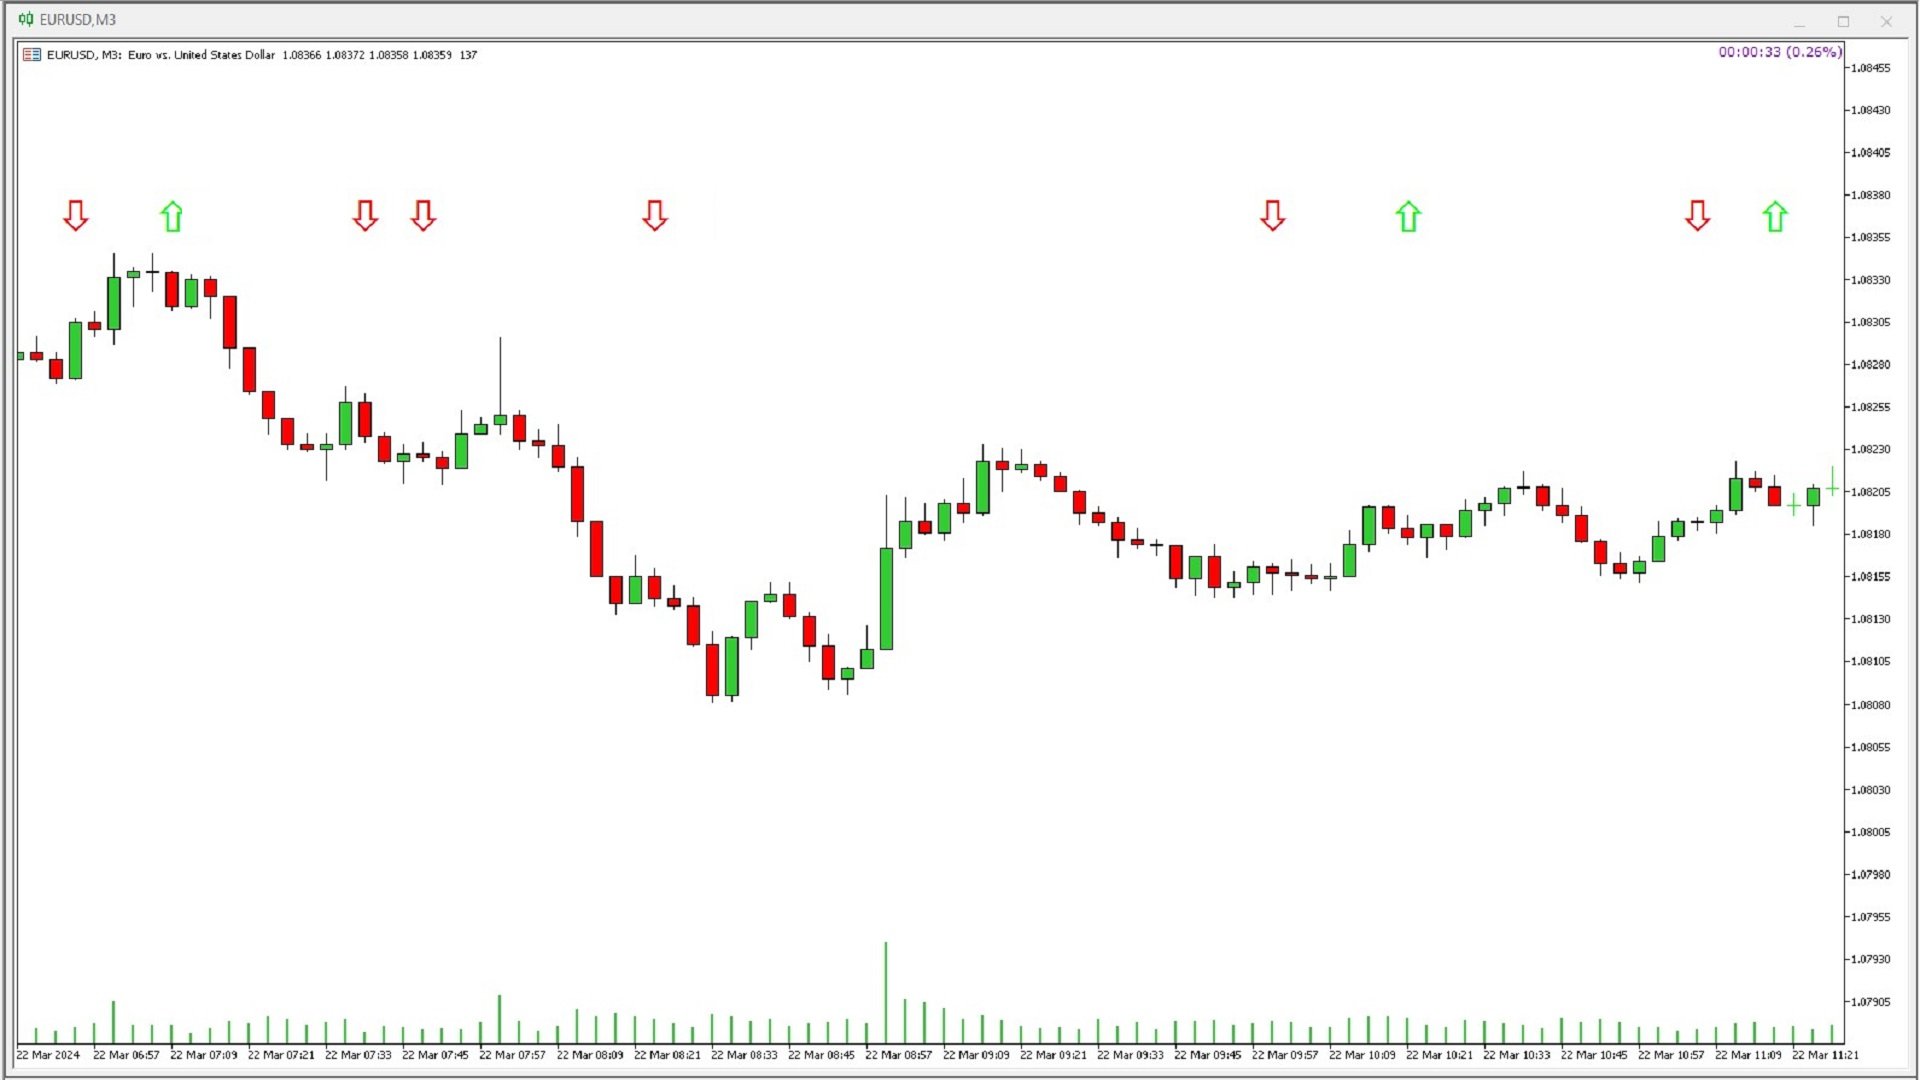
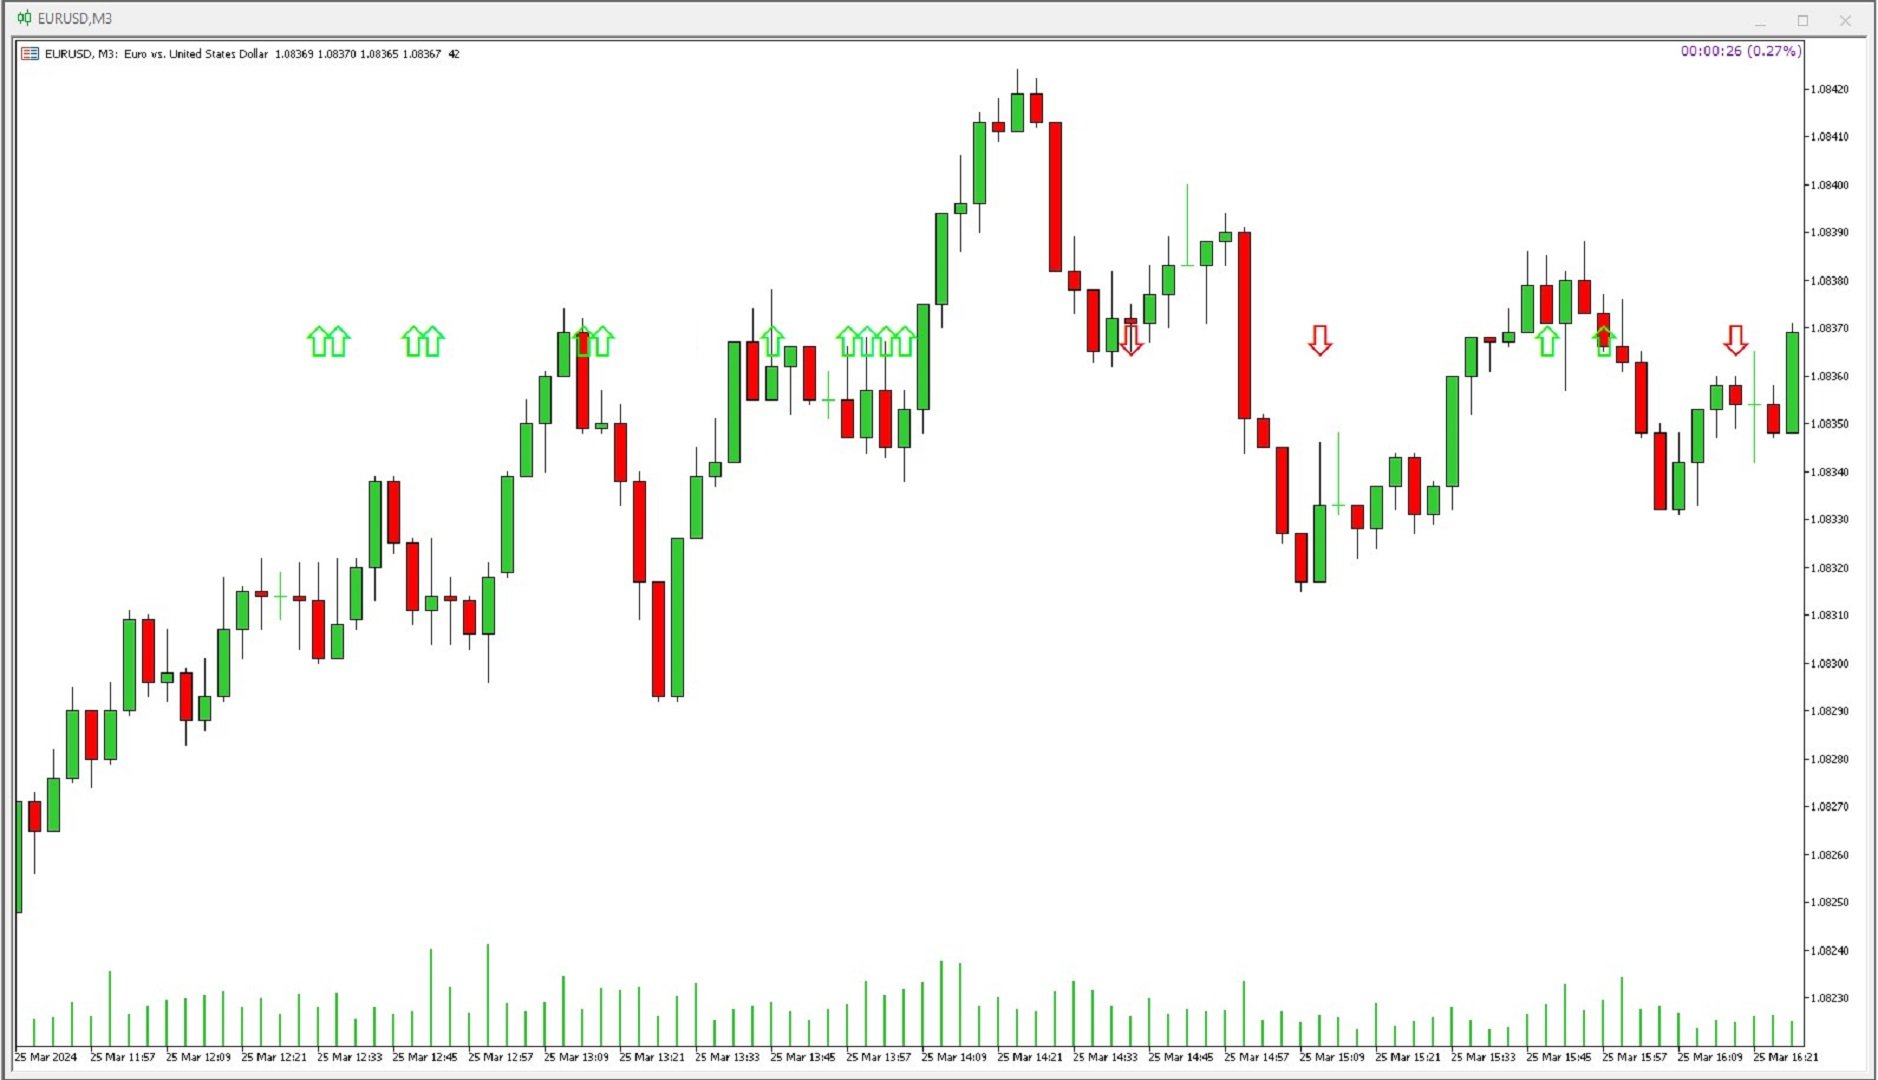
INDICADOR basado en INTELIGENCIA ARTIFICIAL que genera posibles entradas de compra y venta de opciones binarias.

El indicador funciona con 3 estrategias diferentes:

1) al leer volúmenes, envía una señal cuando el precio debería revertirse

2) a través de la divergencia entre precio y volumen, envía una señal de cuándo la tendencia debe continuar o revertirse

3) a través de la convergencia entre precio y volumen, envía una señal de cuándo debe continuar la tendencia.


el indicador funciona en todos los plazos, pero los mejores resultados se obtienen en plazos de 3 o 5 minutos (porque la agresión institucional se ve en plazos bajos).

el mejor horario es el de mayor liquidez, es decir, de las 7 GMT a las 18 GMT.


aunque el indicador genera más del 70% de señales correctas, puede suceder que te encuentres con una batalla entre instituciones que manipulan el precio o se rechazan entre sí, generando así una serie de señales falsas, por lo que RECOMENDAMOS USAR UNA ADECUADA GESTIÓN DEL DINERO (ejemplo Masaniello )
Productos recomendados
KT Candlestick Patterns Scanner is a Multi-Symbol and Multi-Timeframe scanner that fetches and shows various candlestick patterns on 28 currency pairs and 9 time-frames concurrently . The scanner finds the candlestick patterns by loading the KT Candlestick Patterns indicator as a resource in the background. Features The scanner can find the candlestick patterns on 252* combinations of symbols and time-frames from a single chart. Open the signal's chart loaded with a predefined template with
ESTE INDICADOR, BASADO EN INTELIGENCIA ARTIFICIAL, identifica posibles puntos de reversión del mercado leyendo la huella y señala CON ANTICIPACIÓN pequeños movimientos del mercado antes de que ocurran. A diferencia de los indicadores de precio y volumen, que generan entradas "tardías", es decir, cuando ya se ha producido una confirmación en el precio o en el volumen de un cambio de dirección y, por lo tanto, a menudo el movimiento ya ha terminado, este indicador señala, basándose en lo que lee
My PVSR
Ashok Kumar Singha
My PVSR   is based on All Type of Pivot Points. Use this Indicator to get proper Support / Resistance Zone and Trade accordingly.. Recommendation: Use this Indicator along with my another Indicator --->>> Dr. Trend   <<<--- Click Here ; To get the best output result feel free to contact me ; Best of Luck It can be used for: All Pairs: Forex, Cryptocurrencies, Metals, Stocks, Indices etc. All Timeframe All Brokers All type of Trading Style like Scalping, Swing, Intraday, Short-Term, Lon
TREND HARMONY MT5 – Multi Timeframe Trend and Phase and Pullback Level Visualizer indicator for Metatrader5 The TREND HARMONY indicator automates deep trend analysis and generates visualizations for you. Take control of your trades by eliminating uncertainty! Revolutionize your trading experience with precision and insight through the TREND HARMONY Multi Timeframe indicator – your ultimate MT5 trend visualization indicator. [  Features and Manual   | MT4 version |   All Products   ] Are you t
Market Markers EA
Tshepo Michael Motaung
This EA is sessions trading robot that allows you to trade the trading session of yours choice as it waits for market markers to make decision for the direction of the day before taking any trades. It has 3 entry signals that uses candle stick patterns, Moving Averages and Range Break to maximize profits and to take advantage of the trending market. The EA practices risk management and has the ability to grow account by risking certain percentage of your account(risk percentage) each time there
Introduction to Fractal Pattern Scanner Fractal Indicator refers to the technical indicator that makes use of the fractal geometry found in the financial market. Fractal Pattern Scanner is the advanced Fractal Indicator that brings the latest trading technology after the extensive research and development work in the fractal geometry in the financial market. The most important feature in Fractal Pattern Scanner is the ability to measure the turning point probability as well as the trend probabil
The indicator scans for TD Combo signals in multiple timeframes for the all markets filtered and shows the results on Dashboard. Key Features Dashboard can be used for all markets It can scan for signals on MN1, W1, D1, H4, H1, M30, M15 ,M5, M1 timeframes Parameters UseMarketWatch: Set true to copy all symbols available in market watch MarketWatchCount : Set the number of symbols that you want to copy from the market watch list. CustomSymbols: Enter the custom symbols that you want to be availa
It's a multi-symbol and multi-timeframe scanner for our indicator - ACB Breakout Arrows . With default settings, it scans for the buy/sell signals on 28 currency pairs and 9 time-frames concurrently.   Features It can scan 252* combinations of symbols and time-frames from a single chart. Open the signal's chart loaded with a predefined template with a single click.  Easy drag n drop anywhere on the chart. Real-time alerts with popup, sound, push-notifications and email alerts.  Input Para
Hitech MT5
Salavat Yulamanov
5 (5)
De alta tecnología!!! ¡Poderoso sistema de comercio estable! Opere únicamente desde niveles globales de soporte y resistencia. Además, se utilizan filtros en indicadores propietarios. ¡Para obtener el máximo beneficio, se incluye una cuadrícula de pedidos con cierre parcial de pedidos!   Señales     MT5           https://www.mql5.com/ru/signals/1842919?source=Site +Profile+Vendedor     MT4           https://www.mql5.com/ru/signals/1776144?source=Site +Profile+Vendedor   Pares de divisas:
The Plasma Trend indicator is a simple technical indication that is used to determine the current trend direction in the market. The Plasma Trend indicator is a powerful tool for determining the direction of the trend in the Forex market. It is based on both standard technical indicators and proprietary mathematical calculations, which provides a more accurate and reliable trend determination. Its implementation in the form of lines of two colors simplifies the visual determination of a change
Havana EA
Bailey John Wickens
4.75 (4)
Presentamos Havana EA: un algoritmo sofisticado diseñado para traders de todos los niveles, con un énfasis particular en el trading de US30. Esta estrategia de ruptura identifica patrones y tendencias únicos para capturar rupturas óptimas desde niveles específicos. Havana es fácil de usar, con una configuración sencilla y pocos parámetros de entrada para garantizar la simplicidad. Al colocar una operación, Havana emplea un avanzado Sistema de Trailing Stop Loss (TSL) para gestionar el riesgo cor
Dear traders and investors, Introducing   Vikopo Fractal MT5 , Developed by a team of experienced traders with trading experience of over 15 years. MT4 Version : https://www.mql5.com/en/market/product/114993 products List : https://www.mql5.com/en/users/vikopoadvise/seller Strategy Introduction : When utilizing this robot, we have harnessed the power of cutting-edge neural plugins to enhance its capabilities. By integrating these neural plugins, our trading robot is equipped with
El indicador EYeQ es una herramienta poderosa para ofrecer señales de entrada en STEP INDEX, VOLATILITY 10, 25,50,75 100, BOOM y CRUSH. Es más efectivo para atrapar PINCHOS en BOOM y CRUSH 300, 500 y 1000. El indicador EYeQ analiza los mercados en múltiples períodos de tiempo y encuentra los puntos de entrada más adecuados en función de las tendencias. Solo necesita activar las alertas de escritorio para que pueda recibir una notificación cuando se emitan señales. Permita las notificaciones
Rapid X
Tatiana Savkevych
Rapid strategy for working in the Forex market with a scalping base. The algorithm involves carrying out a trading operation in the shortest possible time. As a rule, this period of time is seconds and is only sometimes limited to several minutes. There is an opinion that scalping is for beginners. But in fact, it is wrong. In order to carry out a trading operation correctly and profitably, a trader needs to learn scalping, otherwise the result may be negative. This is why using a bot is mo
RubdFx Perfect Reversal , The reversal indicator is used to determine areas of support and resistance by Drawing an arrow with a level of supply and demand ( ReversalZones ). - You will catch more swings by reducing the period, and less swings if you increase period - Mobile, computer and email alerts available . it is not pushed by price which means the arrow will stay in one place,suitable for scalping and long term trading  Also Compatible with all forex paris , BUY RULES;  open a buy positio
Genotype
Tatiana Savkevych
Genotype : Your reliable guide in the world of Forex Genotype is an advanced Forex trading bot specifically designed for traders seeking efficient and automated trading. This innovative tool offers a wide range of features and capabilities to enable traders to effectively manage their trades and strategies. Special offer for early adopters: price reduced, but will be increased in the future. Tools for work: EURUSD, AUDCAD, AUDCHF, AUDJPY, AUDNZD, AUDSGD, AUDUSD, CADCHF, CADJPY, GBPSEK, GBPS
Skiey
Vitalii Zakharuk
Skiey - Indicator of easy solutions! Using this indicator is very simple, since the simplest is to look at the chart and act according to the color arrows. Such a calculation option takes into account intraday price fluctuations and focuses on measuring the "candlestick" share in the trend. The algorithm takes into account the measurement of prices, this method also emphasizes the measurement of each of the price drops (H / C, H / O, LC, LO) - which gives more detailed information but also mo
We present to you a unique offer - an innovative product called Space Cake that will change your approach to trading in the market! This product is designed specifically for experienced traders and investors who want to increase their efficiency and reduce risks. Thanks to its unique functions and features, it will become an indispensable assistant in your trading activities. Without martingale, grids, and other high-risk strategies. MT4 Version - Click Main advantages : 1 - Trade only at cer
El indicador ayuda a entrar en una operación siguiendo la tendencia, al mismo tiempo, después de alguna corrección. Encuentra fuertes movimientos de tendencia de un par de divisas en un número determinado de barras y también encuentra niveles de corrección para esta tendencia. Si la tendencia es lo suficientemente fuerte y la corrección se vuelve igual a la especificada en los parámetros, entonces el indicador lo señala. Puede establecer diferentes valores de corrección, 38, 50 y 62 (niveles de
Aquí están los resultados de la prueba forward. (MT4 ver.) USDJPY Trend Surfer es una herramienta de trading innovadora diseñada como un EA (Asesor Experto) de seguimiento de tendencias. Este EA captura con precisión la tendencia del USDJPY combinando múltiples SMA (Medias Móviles Simples), RSI (Índice de Fuerza Relativa) y StdDev (Desviación Estándar). Al usar múltiples SMA, analiza simultáneamente las tendencias en diferentes periodos y, al combinar indicadores como el RSI y el StdDev, detecta
The indicator determines a special pattern of Joe Dinapoli. It gives very high probability buy and sell signals. Indicator does not repaint. Indicator Usage Buy Signal ''B'' Entry : Market buy order at signal bar close Stop : Low of signal bar Take Profit : First swing high Sell Signal ''S'' Entry : Market sell order at signal bar close Stop : High of signal bar Take Profit : First swing low Indicator Parameters Fast EMA : External Parameter (should be kept as default) Slow EMA: External Param
The indicator is designed to close positions on the market in time. For example: to take profits ahead of schedule if the price has not reached TakeProfit, and the market is turning around. The indicator analyzes the momentum, not the trend. He does not give any information about the trend. The indicator is well suited for finding divergence. The Ershov 38 Parrots indicator dynamically adjusts to the market and detects price movement impulses of medium and high amplitude. It almost does not rea
Limitless MT5
Dmitriy Kashevich
Limitless MT5 is a universal indicator suitable for every beginner and experienced trader. works on all currency pairs, cryptocurrencies, raw stocks Limitless MT5 - already configured and does not require additional configuration And now the main thing Why Limitless MT5? 1 complete lack of redrawing 2 two years of testing by the best specialists in trading 3 the accuracy of correct signals exceeds 80% 4 performed well in trading during news releases Trading rules 1 buy signa
Premium Reserved Bank :  Overview: This EA is crafted with four (4) resistance and support strategies patterns based on past candles. This executes trades on a   20M TIMEFRAME . Key Features: Affordable Pricing:   Accessible for all budget levels.  Focused Pairs:   Optimized specifically for XAUUSD.  Proven Performance:   Developed, Tested and Verified.  Easy Installation:   Quick setup with only the lot size needing adjustment. Concealed Take Profit Mechanism:   Secures all positions with a
ÚSALO SÓLO CON LOS ARCHIVOS ESTABLECIDOS QUE PUBLICÉ EN LA SECCIÓN DE COMENTARIOS. Vídeo de Youtube: https://www.youtube.com/watch?v=kQN5LTd91rk&amp ;amp;t=2s Esta es la mayor actualización en la vida de Imperium Pattern EA, tiene nuevas características y motor. ---Obtuvo el sistema de motor TheNomadTrader Dynamic oficial junto con una buena relación riesgo:recompensa ---Nueva característica que permite a los comerciantes decirle al EA después de cuánto tiempo (valor X en minutos) el EA puede ce
This is a simple arrow system based on Engulfing Candlestick Pattern. It gives you alerts on your smartphone when there is an engulfing candlestick pattern happens. Which type of alerts available? 1. It paints on chart Up/Down Arrows. 2. Popup message and sound alert in trading terminal window. 3. Push notification or Alert on your Android and IOS mobile phones (requires MT4 or MT5 app installed!) *Note: Use it on higher timeframes like H4 (4 hours), D1 (1 Day) then find trade opportunities on s
Niubility Trend  Niubility Trend  displays the trend direction for all time frames in real time. You'll see at a glance at which direction the trends are running, how long they last and how powerful they are. All this makes it an easy-to-use trend trading system for beginners, advanced and professional traders. Features Easy to trade Customizable colors and sizes It is non-repainting and non-backpainting It is fantastic as a trailing stop method It implements alerts of all kinds
Rejection Block
Usiola Oluwadamilol Olagundoye
The "Rejection Block" MetaTrader 5 Indicator offers traders a comprehensive tool for identifying and visualizing rejection candlestick patterns, commonly known as rejection blocks. These patterns are pivotal in discerning potential market reversals or continuations, making them invaluable for traders seeking to enhance their analysis. Key Features: Rejection Block Detection: The indicator diligently scans price data, pinpointing instances of rejection candlestick patterns. These patterns typical
FREE
Révolutionnez votre trading avec PowerPro Volatility : une précision automatisée à votre service Êtes-vous prêt à transformer votre approche du trading d’indices synthétiques ? Présentation de PowerPro Volatility, la solution ultime pour ceux qui cherchent à maximiser leurs gains tout en minimisant les efforts. Grâce à   Automatisation avancée et technologie de pointe, ce robot de trading est conçu pour offrir des performances exceptionnelles sans aucune intervention humaine. Découvrez les avan
This EA trade with CFDs of Stocks. The EA can be used in any stock market, by default, the EA is configured with symbols of the US Stock Market. The minimal balance recommended is 3.000 USD. Backtest and Live Setup: please, look the video or go to the webpage for more information. The default parameters works with ICMarkets.  The names of the symbols can change in each broker, and each broker can have different CFDs. Please, contact me for help with other brokers. ORDER SIZE PARAMETERS Max.
Los compradores de este producto también adquieren
IVISTscalp5
Vadym Zhukovskyi
5 (5)
Te presentamos el indicador iVISTscalp5, que no solo es único sino también efectivo en operaciones de trading. Este indicador se basa en datos temporales y es el resultado de muchos años de experiencia y análisis profundo de los mercados financieros. El indicador iVISTscalp5 es una excelente herramienta para el trading manual. La conveniencia, simplicidad y visualización, toda la complejidad está oculta en su interior. Hemos simplificado al máximo la configuración y uso del indicador iVISTscalp5
EQ Cutrim Theory
Marco Aurelio Santos Costa
Ronal Cutrim has been a dedicated mathematician for 14 years and has more than 10 years of experience in the financial market. The concept of the theory is simple, find imbalance between buyers and sellers. Which makes a lot of sense, because nothing goes up forever, nothing falls forever.   When you find an asset with a mathematical probability of unbalanced equilibrium, it is a great way to get into trading:  TUTORIAL: Turn on the subtitles, the video is subtitled
NIVELES CRITICOS DE RAD Los procesos de Acumulación y Distribución de Volumen generan los soportes y resistencias naturales del mercado.  A medida que estos proceso se generan, los niveles en los que el volumen relevante se posiciona se convierten en zonas de difíciles de franquear al alza o a la baja. El indicador RAD,   rastrea el Volumen Relevante en tiempo real, identificando los  procesos de acumulación y distribución, graficándolos como  zonas de SOPORTE o RESISTENCIA.  Mediante el uso de
Weis Wave with Alert MT5
Trade The Volume Waves Single Member P.C.
4.93 (15)
Rental/Lifetime Package Options and Privileges  * For optimum results the yearly or lifetime package is suggested due to live training ! Rent Monthly Six Months   Yearly/Lifetime Weis Wave with Speed with Alert+Speed Index x x x Manual  x x x Quick Set up Video x x x Blog x x x Lifetime Updates x x x Setup and Training Material x x Free Rectangle Break Alert Tool      x Discord Access Channel "The SI traders" x 2-hour live methodology training x How to trade with it:    http://
VTrende Pro
Andrii Diachenko
5 (1)
VTrende Pro - MTF indicator for trend trading with a display panel for MT5 *** Videos can be translated into any language using subtitles (video language - Russian) Although the signals of the VTrende Pro indicator can be used as signals of a full-fledged trading system, it is recommended to use them in conjunction with the Bill Williams TS. VTrende Pro is an extended version of the VTrende indicator. Difference between Pro version and VTrende: - Time zones - Signal V - signal 1-2 waves
Average Cost Price helps you keep track of your open positions on the chart. In doing so, it provides lines and explanations on the chart. This line is the average price value of the Bid or Ask. If you wish, you can see the average cost price by adding SWAP and COMMISSION to the average price value. *** You can add commission manually per lot. The legend below the Average Cost Price line gives you: * Average Buy or Sell price line, * Swap Amount, * Commission Amount, * Total Profit or Los
Fibonacci Suavizado
Cesar Juan Flores Navarro
Indicador en MQL5, que obtiene el promedio de 10 EMAS, que son alineadas según Fibonacci, obteniendo un promedio, que sera suavizado.  Se puede ingresar un numero desde 2 a N, que multiplica a los EMA-Fibonacci. Funciona en cualquier criptomoneda, etc. etc... pudiendo calcular el futuro segun la tendencia de las EMAS. Funciona excelentemente en tramos largos, determinando exactamente el mejor inicio/salida. El precio inicial por apertura sera por un periodo de tiempo, luego aumentará.
WanaScalper
Isaac Wanasolo
1 (1)
A scalping indicator based on mathematical patterns, which on average gives signals with relatively small SL, and also occasionally helps to catch big moves in the markets (more information in the video) This indicator has three main types of notifications: The first type warns of a possible/upcoming signal on the next bar The second type indicates the presence of a ready signal to enter the market/open a position The third type is for SL and TP levels - you will be notified every time price r
Smooth price for Monarch
Konstantin Gruzdev
5 (1)
The Smooth Price technical indicator is used for plotting a smoothed line as close to the price of the financial instrument as possible, and serves to eliminate its noise components. The indicator is part of the Monarch trading system, but here it is presented as an independent technical analysis tool. The indicator is based on the cluster digital filter , which, unlike the ClusterSMA , is applied directly to the price time series. Smooth Price does not redraw (except the very last, zero bar) an
Классификатор силы тренда. Показания на истории не меняет. Изменяется классификация только незакрытого бара. По идее подобен полной системе ASCTrend, сигнальный модуль которой, точнее его аппроксимация в несколько "урезанном" виде, есть в свободном доступе, а также в терминале как сигнальный индикатор SilverTrend . Точной копией системы ASCTrend не является. Работает на всех инструментах и всех временных диапазонах. Индикатор использует несколько некоррелируемых между собой алгоритмов для класси
¡El nivel Premium es un indicador único con más del 80% de precisión de predicciones correctas! ¡Este indicador ha sido probado por los mejores especialistas en comercio durante más de dos meses! ¡El indicador del autor no lo encontrarás en ningún otro lugar! ¡A partir de las capturas de pantalla, puede ver por sí mismo la precisión de esta herramienta! 1 es ideal para operar con opciones binarias con un tiempo de vencimiento de 1 vela. 2 funciona en todos los pares de divisas, accion
Pendiente de Precio
Cesar Juan Flores Navarro
Indicador en base a la pendiente de la linea de precio, dibuja una línea de color cuando sube a base de los precios que previamente has sido procesados o linealizados, y cuando baja la pendiente la linea linealizada toma otro color. En este caso se a considerado 6 lineas de diferentes procesos desde pendientes largas hacia las cortas, observándose que cuando coincidan las pendientes se produce un máximo o mínimo, lo que a simple vista nos permitirá hacer una COMPRA O VENTA.
Индикатор Coefficient Of Determination (COD) представляет собой значение коэффициента детерминации или квадрат коэффициента корреляции между зависимой переменной — ценой и объясняющей переменной — тиковым объемом. Что это дает нам на практике? COD отлично распознает кульминацию трендовых движений, что позволяет подбирать оптимальные точки и ловить развороты рынка. Как использовать индикатор: Наиболее популярная торговая стратегия строится совместно с трендовым индикатором Moving Average (MA), пе
Fibonacci Multiple 12
Cesar Juan Flores Navarro
Fibonacci Múltiple 12, utiliza la serie fibonacci plasmado en el indicador fibonacci, aumentadolo 12 veces según su secuencia. El indicador fibonacci normalmente muestra una vez, el presente indicador se mostrara 12 veces empezando el numero que le indique siguiendo la secuencia. Se puede utilizar para ver la tendencia en periodos cortos y largos, de minutos a meses, solo aumentado el numero MULTIPLICA.
Recommended TimeFrame >= H1. 100% Non Repainted at any moment.  Use it carefully, only with Trend Direction. Trading Usage: 2 Variants: as Range System or as BreakOut System (Both Only With Trend Direction)::: (Always use StopLoss for minimise Risk); [1] as Range System: (Recommended) in UP TREND:  - BUY in Blue Line , then if price goes down by 50 points (on H1) open Second BUY.   Close in any Profit you wish: TrailingStop(45 points) or Close when Price touches upper Gold Line. in DOWN TR
En base a cálculos matemáticos de determino una linea Horizontal que cruza a todas las señales de trading, mostrando los máximos y mínimos. La linea horizontal parte en dos las subidas y bajadas de las señales de trading, de tan manera que es fácil identificar los máximos y mínimos, y es inteligente por que es sensible a las subidas y bajadas, afín de no quedarse en un solo lado por siempre, trabaja excelentemente con otros indicadores suavizadores ya que les garantiza que en un intervalo de tie
Spike Detector
Tete Adate Adjete
este indicador es un indicador de detector de picos, está especialmente diseñado para intercambiar Boom 1000, Boom 500, Crash 1000 y Crash 500 Recomendamos usarlo solo en índices Deriv Boom y Crash Su configuración es intuitiva, familiar y fácil de usar. tiene funciones de notificación; notificaciones sonoras y notificaciones push. esta herramienta es fácil de usar, fácil de manejar Esta actualización se basa en diferentes estrategias para picos.
El indicador rastrea la tendencia en 5 tiempos de gráfico diferentes para el mismo activo, en base a 6 señales para cada tiempo de gráfico. El objetivo principal del indicador es mostrarnos la tendencia mayoritaria del activo financiero en el que se colocó. El sistema transmite la información de las tendencias en varios tiempos gráficos, de esta forma el usuario puede tener una visión amplia del movimiento del activo, este tipo de herramienta hace que el usuario tenga una mayor tasa de acier
Panel Visao axetrend
Danilo Maia Siqueira
panel de vista de tendencias; Tendencia de Autoseñales El indicador rastrea la tendencia en 5 tiempos de gráfico diferentes para el mismo activo, basándose en 6 señales para cada tiempo de gráfico. El principal objetivo del indicador es mostrarnos la tendencia mayoritaria del activo financiero en el que se colocó. El sistema transmite la información de las tendencias en diferentes tiempos gráficos, de esta manera el usuario es capaz de tener una visión amplia del movimiento del acti
Escalera Inteligente
Cesar Juan Flores Navarro
Indicador en MQL5, recibe la información del precio SUAVIZADO, lo procesa anulando los picos inteligentemente, y el resultado lo envía al desarrollo de la escalera que iniciara y subirá o bajara según el peldaño o INTERVALO ingresado Ingreso PERIODO = 50 (variar segun uso) Ingreso MULTIPLICA AL PERIODO = 1 (variar segun uso) Segun la configuración la escalera puede pegarse o separarse de los precios,, Se aplica toda la linea de tiempo, y a todas las divisas, etc.  
Seconds Charts
Aleksandr Goryachev
Micro  ******************* Секундные графики MT5 ********************** Более точного инструмента для входа в сделку вы не найдёте. Входные параметры: Timeframe, sek - период построения графика, секунды Displayed bars - отображаемые бары Step of price levels, pp, 0-off - шаг отрисовки ценовых уровней, пункты Scale points per bar, 0-off - масштаб в пунктах на бар Show lines - отображение текущих уровней Show comment - отображение комментария Standard color scheme - стандартная цветовая сх
QuantXSTocks Trading Range Indicator for MT5: INSTRUCTIONS TO USE OUR INDICATOR:- User needs to take trade on Arrow or after an Arrow CandleStick, You can achieve up-to 35-125 pips target by this Indicator. Best Timeframes for Stocks and Indices are M30 and H1: AMAZON M30 (50 pips) TESLA M30 (50 pips) APPLE M30 (50 pips) ADOBE M30 (50 pips) NASDAQ100 H1 (125 pips) The above are the approximate amount of pips you can achieve by this Indicator, Green arrow appears to be buy arrow while the Red a
Super Suavizador
Cesar Juan Flores Navarro
Indicador en MQL5 que obtiene el promedio de 10 EMAS que son alineadas y procesadas según Fibonacci luego el promedio es suavizado"  Se ingresa un número de 2 a N que multiplica los EMA-Fibonacci y por consiguiente aumenta los fibonacci, resultando un promedio.   Se ingresa un número que suaviza los EMA-Fibonacci. Considerando los números 1/1 seria la suavización minima. Considerando los números 3/5 seria la suavización media. Considerando los números 10/30 seria la suavización alta.....etc
Trend and Signals MT5  indicator scans  30 trading Instruments (Forex, Metals and Indices).     It uses special algorithm on the  current market   based on   Pure Price Action   and display the overall trend and signal on the dashboard. When signals are produced the indicator sends alert and notification. Strategy for Signals This indicator uses the daily timeframe to determine the direction of the trend. The hourly timeframe is used to identify possible entries. Main trend and is determined by
Cycles Forecast
Pooriya Alirezaee
This indicator is based on a mathematical formula and an ANN combined, designed to make a model(using previous prices) of the most recent market condition (any chart*) in order to use the model as a forecasting tool. *This indicator can operate on any chart/timeframe, but it's suggested you use multiple timeframes for each trade because this method relies solely on the time factor, you can not use this indicator to predict price volatility, but if it's fit correctly it will show you when the nex
This indicator is based on the crossing of two Moving Average with the RSI It is intended for scalpers Specially designed for Boom and Crash syhtetic indices from Binary.com/Deriv.com It is easy to use and intuitive. We recommend its use on M1 and is equipped with three types of notification Email alert Sound notification Push notification these parameters can be activated and deactivated.
Este indicador ofrece un sólido método de análisis de mercado centrado en el concepto de 'Herramienta de Canal de Regresión'. Al aprovechar esta herramienta, los traders pueden obtener un control excepcional sobre el canal de regresión de sus gráficos, lo que les permite tomar decisiones comerciales más informadas. La Herramienta de Canal de Regresión es un instrumento poderoso en el arsenal de un trader. Está diseñada para proporcionar información valiosa sobre las tendencias de precios y los p
Use with JUMP 25. However it can can with the volatility indices as well because it is a modified version. It is advisable to use create a healthy account management. Measure your risk and happy trading. Other experts to be loaded soon. These are modified in order to optimise profits. Ideal candidates are high risk, high returns individuals who hold trades at a maximum of 1 - 2 hours
This indicator is a scalping indicator intended solely for the Boom and Crash indices of the Deriv Limited market It supports Boom 500, Boom 1000, Crash 500 and Crash 1000 Not repaint and no bug The settings are intuitive and easy to use The product activation number is 20 The Time Frame used depends on the user If you are an aggressive scalper then just use M1 For long trades use M15 If you are conservative use M5 Please contact me for more details of its use
RadioMedia
Cesar Juan Flores Navarro
Indicador de MQL5 basado en 3 EMAs, en función del precio. El precio influye en las EMAs, de tal forma que los Máximos y Mínimos solo la alteran minimamente, este influjo lo llame radio. Considerando la influencia del radio como constante, por lo que no tiene valores de entrada. Ideal para todas las criptomonedas. Funciona en todos los tiempos. Se sugiere operar cuando el precio este abajo y en bajada.... o cuando el precio este encima y en subida.
Otros productos de este autor
ESTE INDICADOR, BASADO EN INTELIGENCIA ARTIFICIAL, identifica posibles puntos de reversión del mercado leyendo la huella y señala CON ANTICIPACIÓN pequeños movimientos del mercado antes de que ocurran. A diferencia de los indicadores de precio y volumen, que generan entradas "tardías", es decir, cuando ya se ha producido una confirmación en el precio o en el volumen de un cambio de dirección y, por lo tanto, a menudo el movimiento ya ha terminado, este indicador señala, basándose en lo que lee
El indicador genera señales de entrada para OPCIONES BINARIAS, dibujando una flecha en el gráfico y emitiendo una alerta audible. HORARIO DE FUNCIONAMIENTO: 6:00 GMT/ 17:00 GMT (no recomendado después de las 17:00 GMT y durante la noche debido a la volatilidad demasiado baja y la falta de volúmenes) PARES: EUR/USD (@EU6), GBP/USD (BP6). Plazos: 1,2,3,5,10,15 minutos Mejor marco de tiempo: 3 minutos CADUCIDAD: 1 vela El indicador necesita volúmenes reales (sin volúmenes de ticks) para
DELTA DE VOLUMEN Volscalping Este indicador, para cada vela de precio, dibuja una vela Delta, que es la diferencia entre los contratos comprados y vendidos. La vela será roja y negativa si los contratos negociados en la oferta (vendidos) superan a los de la demanda, por el contrario, la vela será verde y positiva si los contratos negociados en ASK (comprados) superan a los de la oferta. ATENCIÓN: El indicador solo funciona con corredores que proporcionan un flujo de datos de mercado real y q
este indicador detecta la diferencia entre los contratos alcanzados en oferta y demanda (agresión) para cada vela individual. el indicador muestra en la ventana dedicada debajo del gráfico de precios, velas dadas precisamente por la diferencia entre los contratos vendidos y comprados, que generan la fuerza volumétrica del mercado. es posible (ver en las capturas de pantalla) cómo seleccionar solo el gráfico delta de velas acumulativas, o incluso con una línea de tendencia de las propias vel
este indicador muestra la fortaleza del volumen real frente al precio. si el gráfico de precios y la tendencia del volumen tienen la misma tendencia, significa que todo es regular. si el indicador diverge del gráfico de precios, significa que la reversión está cerca. cuando el precio sube y el gráfico de "convergencia de volumen" baja, significa que el dinero está saliendo del mercado, los vendedores están vendiendo al alza y el precio pronto comenzará a caer en picado. por el contrario, si el
Filtro:
No hay comentarios
Respuesta al comentario