Cendol Bender
- Asesores Expertos
- Gede Hendra Saputra
- Versión: 6.1
- Actualizado: 7 diciembre 2023
- Activaciones: 5
Overview
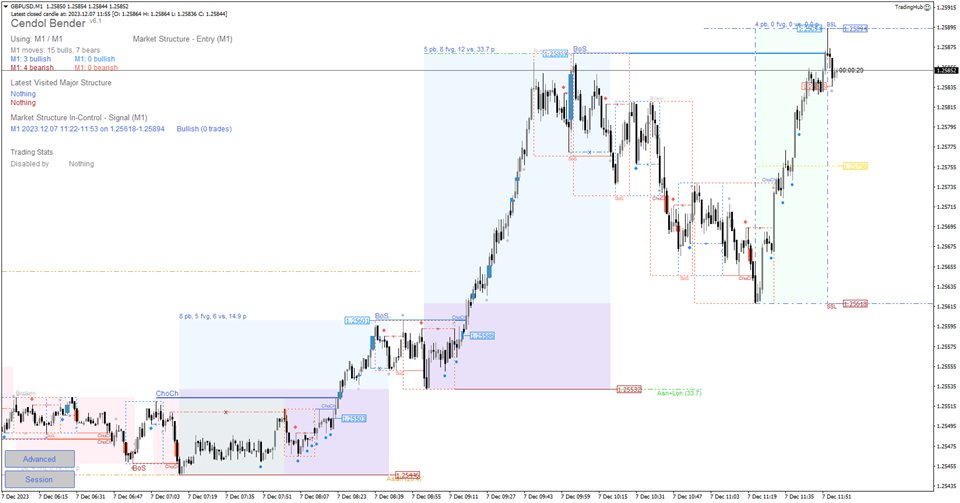
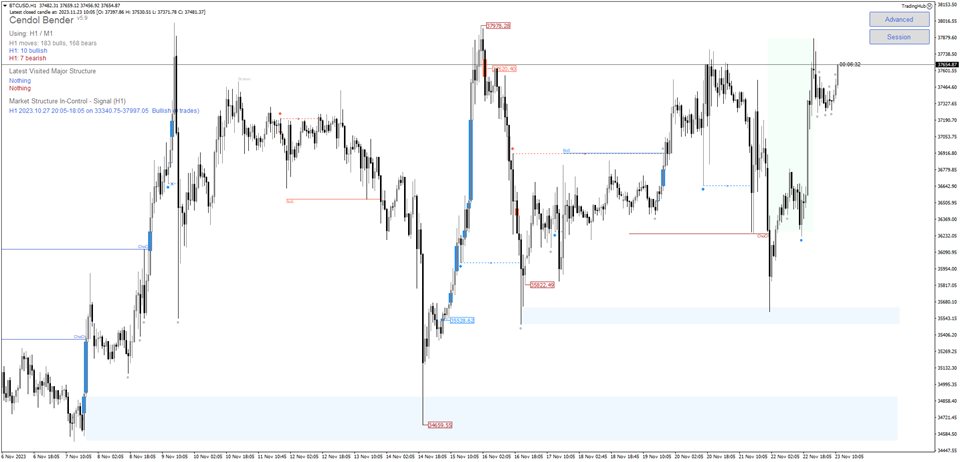
Cendol Bender is one of its kind of SMC/ICT market structure and market shift identification automation, it gives an unprecedented edge on your market structure analysis by automatically identifies valid market structure using smart and powerful structure mapping mechanism by following criteria:
- Impulsive and corrective movement of the market
- Identification of valid pullback across all impulsive and corrective market movement
- Validation of single bearish or bullish leg move
- Identification of valid market structure based on validated market move
- Major and internal structure within the major structure
- Fair Value Gap (Regular, Implied, Volume and Gap) identification within a structure
- Institutional Funding Candle to boost your confidence
- Independent bullish and bearish market structure identification across 3 timeframes: HTF, MTF, and LTF
- Contextual market structure in-control from independent market structure identification on HTF and MTF
- Identify market structure In-Control on HTF and MTF
- Identify and draw market structure on MTF for entry signal
- Identify LTF confirmation market structure important event such as ChoCh, BoS, and Pullback
Details
Each objects rendered in your chart represents:
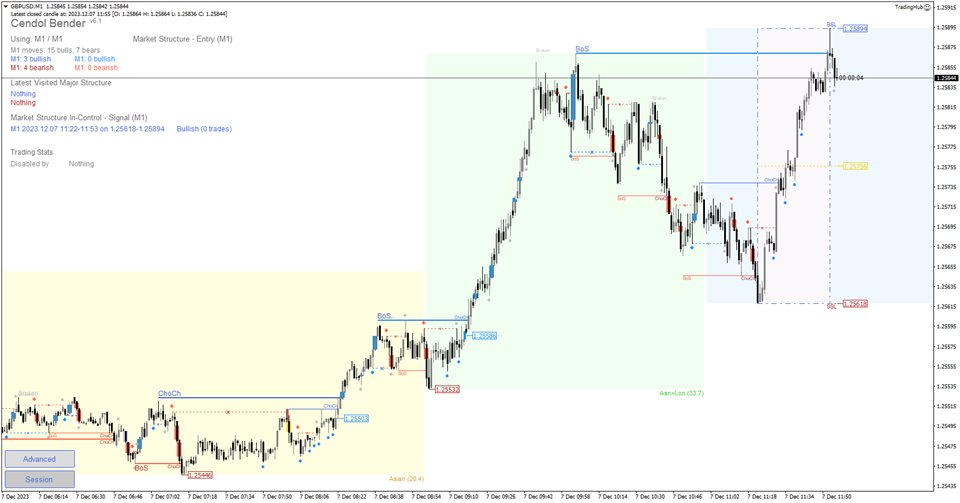
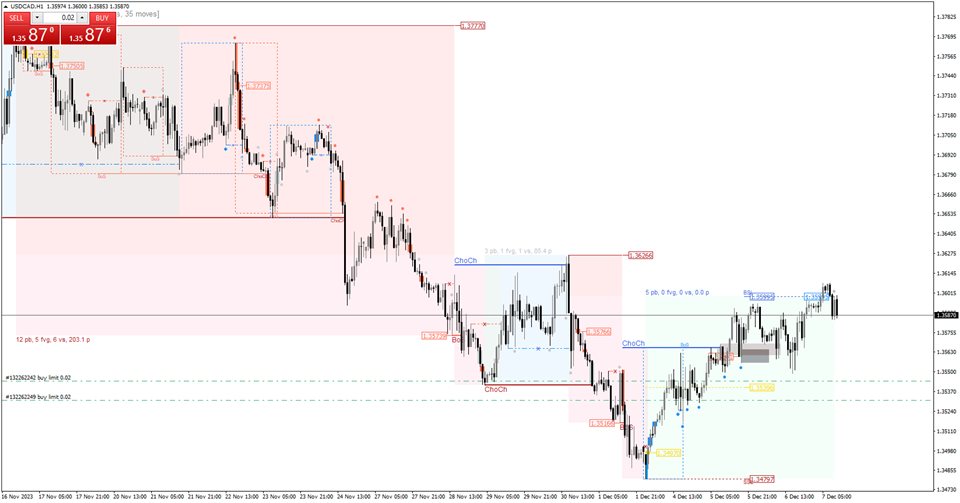
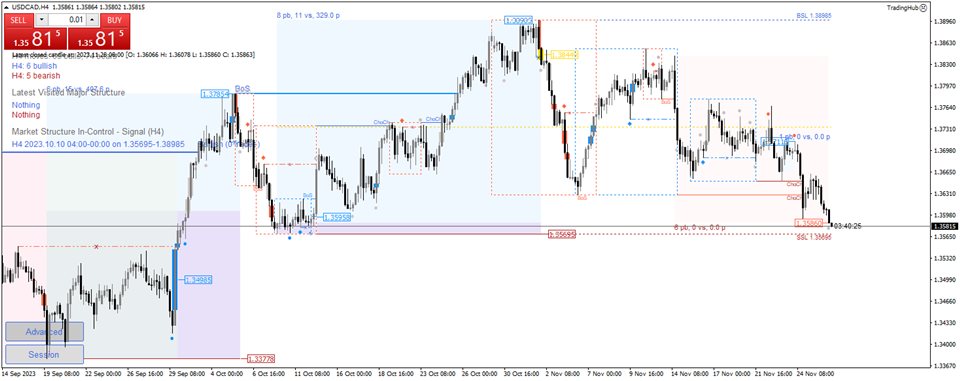
- Alice Blue: Rectangle represents Major Bullish Structure
- Lavender Blush: Rectangle represents Major Bearish Structure
- Lavender: Rectangle represents Internal Bullish Structure
- Misty Rose: Rectangle represents Internal Bearish Structure
- Tomato/Dodger Blue: Dot of arrows located above/below shadows represents Valid Pullbacks
- Fire Brick/Dodger Blue: Line represent Change of Character and Break of Structure
- Tomato/Dodger Blue: Rectangle around the candle represents Fair Value Gap within market structure
- Gold: Represents Institutional Funding Candle
- Tomato/Dodger Blue: Rectangle under gold FVG represents Order Block followed by Fair Value Gap
- Manual trade is using top-down analysis based on method explained by ICT/SMC guru (Mr. Kahn from Trading Hub)
- HTF: H4/D1 to gain insight of market structure in control whether its bullish or bearish market to capture session high/low, IFCs, pullback areas
- MTF: H1/M30/M15 as short term trend analysis to understand main and internal market structure movement
- LTF: M1/M5 as the entry criteria on IFC or pullback within ~0.5 range of the signal structure itself
- Automated trade system tested on XAUUSD and GBPUSD 2019-01-2023-06 using 99.90% quality of ticks data from TDS (DukasCopy) using H4 as trend in-control, M15 as signal and M5 as entry -- it capable to perform automated traded, but its not something that I would advise for a small capital
- Please do report bugs and timely bug fix should be delivered
Extra Functionalities
- Flexible trading session configuration
- Telegram integration with chart image
- Terninal notification

