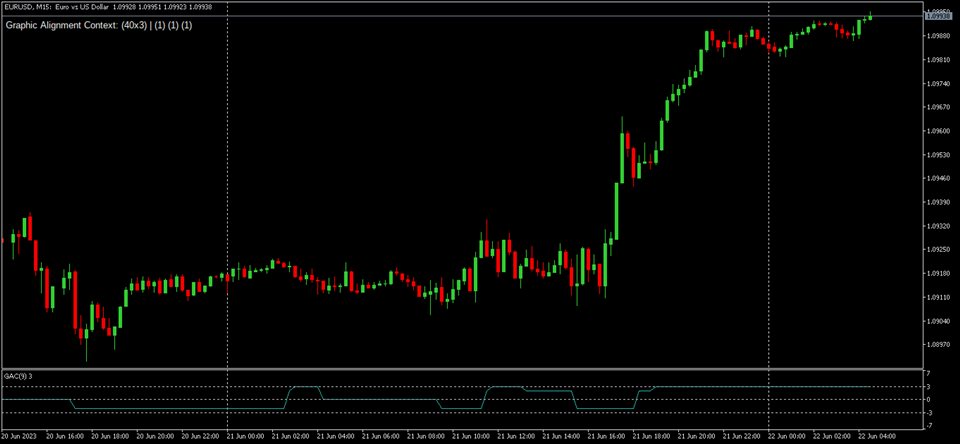
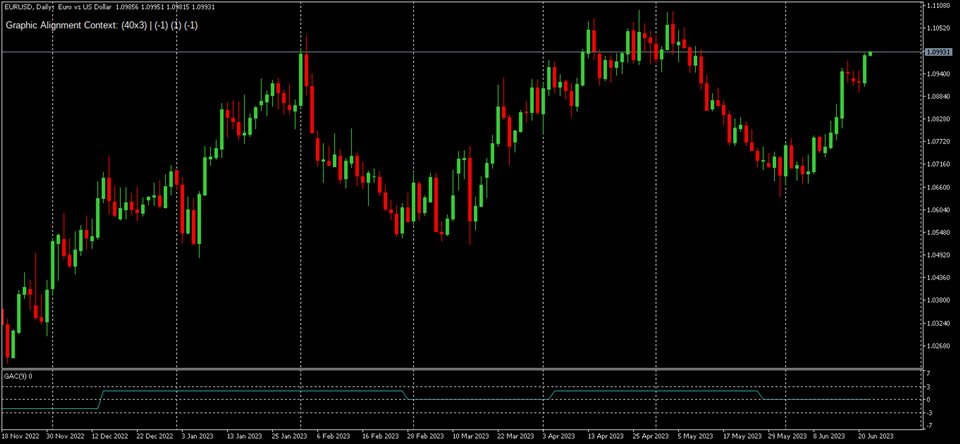
Graphic Alignment Context
- Indicadores
- Ricardo Alexandre Laurentino
- Versión: 1.0
The Graphic Alignment Context (GAC) Technical Indicator measures the vertical difference of the simple average price of a financial instrument in the context of three different timeframes determined by a defined number of bars or candles (periods) to determine the strength of the buy or sell trend. sale. Ascending average prices indicate Buying strength (1), Descending average prices indicate Selling strength (-1) and any scenario different from the previous two conditions indicates Neutrality (0).
A scoring system is applied when evaluating trend alignment between the three different timeframes with greater weight for consecutive alignments between timeframes. Graphic Alignment Context (GAC) varies in the range of integers ± 3. Value ±3 indicates a strong buy or sell trend, value ±2 indicates a medium buy or sell trend, and value ±1 indicates a weak buy or sell trend. sale. The Zero Value indicates neutrality or that there is no graphic alignment considering the set of three different times.
Construction of the indicator and calculation assumptions:
- Evaluate 3 different graphic times: Small (P), Medium (M) and Large (G);
- Set the number of bars or candles (periods) for the Small timeframe, the operating timeframe;
- Define the multiple to be applied to determine the Medium and Large timeframes;
- Define the number of periods for the Simple Average of price evaluation;
- Evaluate each timeframe for buying, selling or neutrality trends;
- Chart is Buyer (+1);
- Graph is Seller(-1);
- Graph is Neutral (0);
- By definition the graphic alignment will be measured by scores having more weight consecutive scores:
Setting P+M+G will result in the GAC Value:
- Strong Seller Alignment (-3);
- Average Salesperson Alignment (-2);
- Weak Seller Alignment (-1);
- Neutral Alignment (0);
- Weak Buyer Alignment (1);
- Average Buyer Alignment (2);
- Strong Buyer Alignment (3);
The Indicator displays in a separate window the alignment levels on the model of an oscillator varying the score from -3 to 3.
Four output buffers are generated:
- 0 = Trend for Time P;
- 1 = Trend for Time M;
- 2 = Trend for Time G;
- 3 = GAC value;


