• Información general
  • Comentarios
  • Discusión

Wave Cycle Explorer

Una herramienta de tendencias para operar y analizar y predecir la situación del mercado.
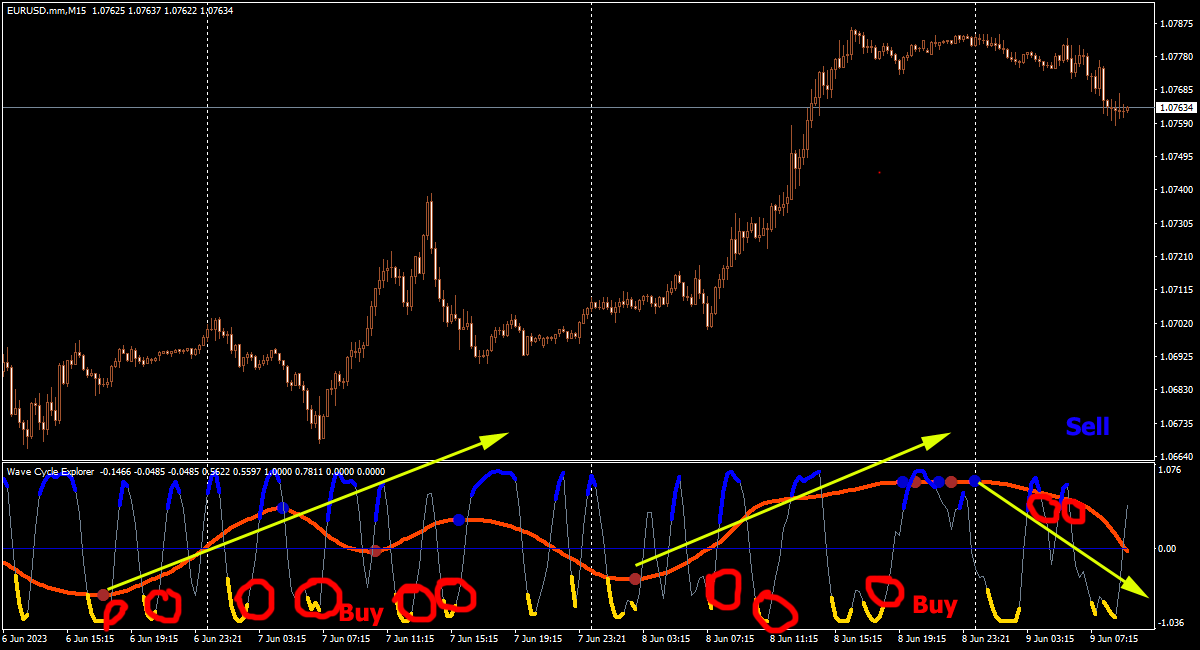
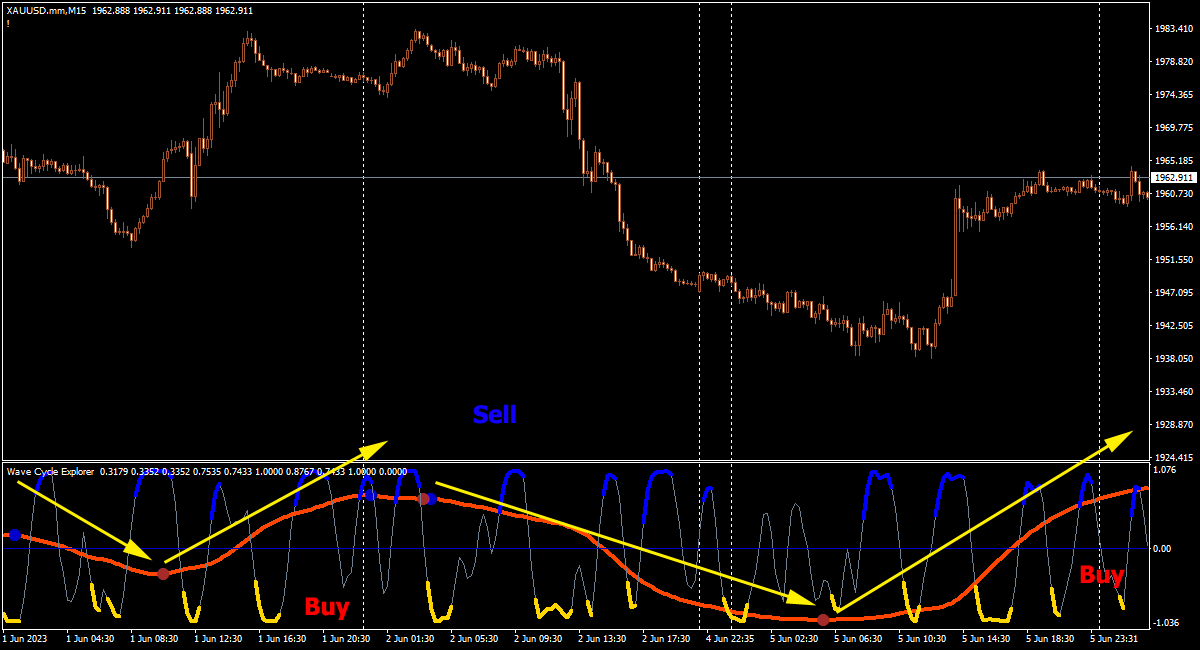
El indicador incluye una línea guía que actúa como guía para las ondas de tendencia, ya sea diaria o semanal. Y un oscilador especial que analiza los volúmenes de negociación.
Muestra períodos de mercados de sobrecompra y sobreventa y determina los puntos de entrada al comienzo de un posible movimiento de precios.
El indicador no se vuelve a dibujar y no se retrasa.
Funciona en cualquier instrumento y marco de tiempo.
El indicador no carga el gráfico, contiene solo 2 configuraciones, se puede usar como un indicador independiente para operar.

La línea naranja guía del indicador da una idea del movimiento del mercado. Cuando la línea se mueve hacia abajo, el mercado es bajista, cuando sube, el mercado es alcista, también si la línea está por encima de 0, el mercado alcista prevalece.
si la línea está por debajo de 0, prevalece un mercado bajista. Los puntos de retorno se indican mediante círculos.

El oscilador de señal es una línea gris, proporciona entradas durante los movimientos de precios de onda, funciona en el momento en que la línea sale de los rangos superior e inferior. Las zonas máximas de sobrecompra y sobreventa están coloreadas en amarillo y azul.
La salida de la línea del oscilador de la zona de sobrecompra y sobreventa muestra un posible cambio en la dirección del precio.
No opere contra el oscilador.
El indicador tiene configuraciones estándar para marcos de tiempo M5-M15, para otros marcos de tiempo necesita cambiar los parámetros.

Parámetros de entrada

  • Trend Direction : analiza el número de barras para calcular la dirección de la tendencia.
  • Signal Oscillator : analiza el número de barras para calcular el oscilador de señal.
  • Bars Count : el número de barras indicadoras en el gráfico.
Productos recomendados
VR Cub
Vladimir Pastushak
VR Cub es un indicador para obtener puntos de entrada de alta calidad. El indicador fue desarrollado para facilitar los cálculos matemáticos y simplificar la búsqueda de puntos de entrada a una posición. La estrategia comercial para la cual se diseñó el indicador ha demostrado su eficacia durante muchos años. La simplicidad de la estrategia comercial es su gran ventaja, que permite que incluso los operadores novatos negocien con éxito con ella. VR Cub calcula los puntos de apertura de posiciones
Daily Candle Predictor es un indicador que predice el precio de cierre de una vela. El indicador está destinado principalmente para su uso en gráficos D1. Este indicador es adecuado tanto para el comercio de divisas tradicional como para el comercio de opciones binarias. El indicador se puede utilizar como un sistema de negociación independiente o puede actuar como una adición a su sistema de negociación existente. Este indicador analiza la vela actual, calculando ciertos factores de fuerza dent
Cosmic Diviner X Planet
Olena Kondratenko
4 (2)
This unique multi-currency strategy simultaneously determines the strength of trends and market entry points, visualizing this using histograms on the chart. The indicator is optimally adapted for trading on the timeframes М5, М15, М30, Н1. For the convenience of users, the indicator renders the entry point (in the form of an arrow), recommended take profit levels (TP1, TP2 with text labels) and the recommended Stop Loss level. The take profit levels (TP1, TP2) are automatically calculated for
Noize Absorption Index MT4
Ekaterina Saltykova
5 (1)
Noize Absorption Index - is the manual trading system that measures the difference of pressure between bears forces and bulls forces. Green line - is a noize free index that showing curent situation. Zero value of index shows totally choppy/flat market.Values above zero level shows how powerfull bullish wave is and values below zero measures bearish forces.Up arrow appears on bearish market when it's ready to reverse, dn arrow appears on weak bullish market, as a result of reverse expectation. S
Binary Options Support Resistance Indicator This indicator is designed for binary options trading and effectively shows retracements from support and resistance levels. Signals appear on the current candle. A red arrow pointing downwards indicates a potential selling opportunity, while a blue arrow pointing upwards suggests buying opportunities. All that needs adjustment is the color of the signal arrows. It is recommended to use it on the M1-M5 timeframes as signals are frequent on these timef
Night ghost
Dmitriy Kashevich
Night Ghost - Indicador de flecha para opciones binarias. ¡Este es un asistente confiable para usted en el futuro! - Sin redibujar en el gráfico -¡Funciona muy bien en todos los pares de divisas! -Indicador de precisión de hasta el 90% (Especialmente de noche) -No es necesario configurar durante mucho tiempo (configurar perfectamente para opciones binarias) - Señales no tardías - La aparición de una señal en la vela actual. -Perfecto para el período M1 (¡No más!) - Color de ve
Retroceso de Fibonacci & Herramientas de Dibujo de Líneas Extendidas Retroceso de Fibonacci & Herramientas de Dibujo de Líneas Extendidas son aptos para la plataforma MT4 y para operadores que emplean el método de negociación de puntos y la negociación de sección áurea. Ventajas: Sin líneas excusadas ni las excesivamente largas, y es fácil de observar y descubrir oportunidades de negociación. Versión de prueba: https://www.mql5.com/zh/market/product/35884 Funciones principales: 1.
Owl smart levels
Sergey Ermolov
4.13 (23)
Versión MT5  |   FAQ El   Indicador Owl Smart Levels   es un sistema comercial completo dentro de un indicador que incluye herramientas de análisis de mercado tan populares como   los fractales avanzados de Bill Williams , Valable ZigZag que construye   la estructura de onda correcta   del mercado y   los niveles de Fibonacci   que marcan los niveles exactos de entrada. en el mercado y lugares para tomar ganancias. Descripción detallada de la estrategia Instrucciones para trabajar con el indi
Trend Line Chart Pattern Signals  Is a traders Tool for Signals based on Strong  Patterns Formed By a pair of robust trend lines. They FOR WITH DIFFERENT POPULAR PATTERNS ON CHARTS LIKE – TRIANGLES, FLAGS,RANGE , ASCENDING TRIANGLES, DESCENDING PATTERNS, PENNANTS ETC. The TREND LINES  form  dynamically  on running bars. The  sensitivity  of the trend lines can be changed by custom settings. The  Buy and Sell Signals Generate upon Break Of the Trend Line + "Close" of the same bar above the previo
The Th3Eng PipFinite indicator is based on a very excellent analysis of the right trend direction with perfect custom algorithms. It show the true direction and the best point to start trading. With StopLoss point and Three Take Profit points. Also it show the right pivot of the price and small points to order to replace the dynamic support and resistance channel, Which surrounds the price. And Finally it draws a very helpful Box on the left side on the chart includes (take profits and Stop loss
Diamond Trend
Segundo Calvo Munoz
Indicador que identifica la tendencia, así como puntos de entrada. Usar para entradas a favor de tendencia. Aunque este indicador es muy preciso identificando entradas, siempre se recomienda usar otro indicador de soporte para confirmar. Recuerda buscar los Activos y Timeframes que mejor se adapten a tu operativa... Válido tanto para Scalping como para entradas de Largo Plazo Por favor, utiliza un Gráfico de Barras para poder visualizar el indicador correctamente Inputs: EMA Value for Long Term
Strong Retracement Points Pro demo edition! SRP (Strong Retracement/Reversal Points) is a powerful and unique support and resistance indicator. It displays the closest important levels which we expect the price retracement/reversal! If all level are broken from one side, it recalculates and draws new support and resistance levels, so the levels might be valid for several days depending on the market! If you are still hesitating to start using this wonderful tool, you can check this link to see h
This is a trend indicator without redrawing Developed instead of the binary options strategy (by the color of the Martingale candlestick) Also works well in forex trading When to open trades (binary options) A signal will appear in the place with a candle signaling the current candle It is recommended to open a deal for one candle of the current timeframe M1 and M5 When a blue dot appears, open a deal up When a red dot appears, open a trade down. How to open trades on Forex. When a signal is rec
ROYAL DUTCH SKUNK USES THE TREND WAVE INDICATOR AND IT CAN IDENTIFY THE BEGINNING AND THE END OF A NEW WAVE TREND MOVEMENT. AS AN OSCILLATOR, THE INDICATOR IDENTIFIES THE OVERBOUGHT AND OVERSOLD ZONES. IT WORKS GREAT TO CATCH THE SHORT TERM PRICE REVERSALS AND USES A MARTINGALE STRATEGY TO CLOSE ALL TRADES IN PROFIT. USE DEFAULT SETTINGS ON H1 OR HIGHER TIME FRAME ON ANY PAIR FOR MORE ACCURATE TRADES WHY THIS EA : Smart entries calculated by 6 great strategies The EA can be run on even a $20000
This is a new strategy for SUPPLY DEMAND areas It is based on a calculation using the tick volume to detect the big price action in market for both bear /bull actions this smart volume action candles are used to determine the supply and demand areas prices in between main supply and demand lines indicate sideway market  up arrows will be shown when prices moves above the main supply and the secondary supply lines Down arrows will be shown when prices moves below the main demand and the secondary
PipFinite Exit EDGE
Karlo Wilson Vendiola
4.75 (77)
Did You Have A Profitable Trade But Suddenly Reversed? In a solid strategy, exiting a trade is equally important as entering. Exit EDGE helps maximize your current trade profit and avoid turning winning trades to losers. Never Miss An Exit Signal Again Monitor all pairs and timeframes in just 1 chart www.mql5.com/en/blogs/post/726558 How To Trade You can close your open trades as soon as you receive a signal Close your Buy orders if you receive an Exit Buy Signal. Close your Sell orde
This is the FXTraderariel-TakeProfit - Stop Loss Indicator . It provides you 3 potential Take Profits and 1 Stop Loss. These potential targets are computed based on several methods . The indicator can be used on every time frame, but we advise to use it on H1, H4 and D1. Especially if you are a novice trader. Pro Traders can also you use it for scalping in smaller time frames (M1, M5 and M15). This indicator is not a complete trading system. It doesn't provide you a Signal nor can predict the m
Blahtech Market Profile
Blahtech Limited
4.46 (13)
Was: $249  Now: $99   Market Profile defines a number of day types that can help the trader to determine market behaviour. A key feature is the Value Area, representing the range of price action where 70% of trading took place. Understanding the Value Area can give traders valuable insight into market direction and establish the higher odds trade. It is an excellent addition to any system you may be using. Blahtech Limited presents their Market Profile indicator for the MetaTrader community. Ins
PZ Mean Reversion MT4
PZ TRADING SLU
2.33 (3)
Indicador único que implementa un enfoque profesional y cuantitativo para el comercio de reversión a la media. Aprovecha el hecho de que el precio se desvía y vuelve a la media de manera predecible y medible, lo que permite reglas claras de entrada y salida que superan ampliamente las estrategias comerciales no cuantitativas. [ Installation Guide | Update Guide | Troubleshooting | FAQ | All Products ] Señales comerciales claras Sorprendentemente fácil de operar Colores y tamaños personalizable
Pattern 123
Pavel Verveyko
"Pattern 123" is an indicator-a trading system built on a popular pattern, pattern 123. This is the moment when we expect a reversal on the older trend and enter the continuation of the small trend, its 3rd impulse. The indicator displays signals and markings on an open chart. You can enable/disable graphical constructions in the settings. The indicator has a built-in notification system (email, mobile terminal, standard terminal alert). "Pattern 123" has a table that displays signals from
PZ Trend Trading
PZ TRADING SLU
4.8 (5)
Trend Trading es un indicador diseñado para sacar el máximo provecho posible de las tendencias que tienen lugar en el mercado, mediante el cronometraje de retrocesos y rupturas. Encuentra oportunidades comerciales al analizar qué está haciendo el precio durante las tendencias establecidas. [ Guía de instalación | Guía de actualización | Solución de problemas | FAQ | Todos los productos ] Opere en los mercados financieros con confianza y eficiencia Aproveche las tendencias establecidas sin s
Forex Gump
Andrey Kozak
2.75 (4)
Forex Gump is a fully finished semi-automatic trading system. In the form of arrows, signals are displayed on the screen for opening and closing deals. All you need is to follow the instructions of the indicator. When the indicator shows a blue arrow, you need to open a buy order. When the indicator shows a red arrow, you need to open a sell order. Close orders when the indicator draws a yellow cross. In order to get the most effective result, we recommend using the timeframes H1, H4, D1. There
Gold Phoenix
Yaroslav Varankin
The perfect tool for Scalng in the Forex markets You can trade both from signal to signal and using take profit  The algorithm does not use Zigzag!  No redrawing!  This is a channel instrument that uses a moving average as a filter. Moving Average  There are 2 parameters for the settings Ma Period = 5 period Moving Average  Channel 1.0 distance of channel lines from the chart Price Signal Filter - calculation of signal opening and filter There is a complete set of Alert There is a multi-timefram
For sure, this indicator has become very popular amongst traders. Through coding this indicator will give you the most accurate levels possible for your trading analysis. We have also added in the ability for you to receive alerts when the price breaks above or below a Support or Resistance lines! HOW TO USE The red rectangles represent your resistance/supply zone. The green rectangles represent your support/demand zone.  BONUS FEATURES We coded this indicator with the ability to switch between
Delta Pairs
Anatolii Zainchkovskii
Delta Pairs is an indicator for pair trading, it displays the divergence of two currency pairs. Does not redraw. A useful tool for the analysis of the behavior of two currency pairs relative to each other. Purpose The Delta Pairs indicator is designed for determining the divergences in the movements of two currency pairs. This indicator is displayed as two line charts and the difference (delta) between these charts in the form of a histogram. The Delta Pairs indicator will be useful for those
QM Pattern Scanner MT4
Reza Aghajanpour
4.75 (4)
QM (Quasimodo) Pattern is based on Read The Market(RTM) concepts. The purpose of this model is to face the big players of the market (financial institutions and banks), As you know in financial markets, big traders try to fool small traders, but RTM prevent traders from getting trapped. This style is formed in terms of price candles and presented according to market supply and demand areas and no price oscillator is used in it. RTM concepts are very suitable for all kinds of investments, includi
Trend Ray
Andriy Sydoruk
The indicator shows the potential trend direction by cyclical-wave dependence. Thus, all the rays of the intersection will be optimal rays, in the direction of which the price is expected to move, taking into account the indicator period. Rays can be used as a direction for potential market movement. But we must not forget that the approach must be comprehensive, the indicator signals require additional information to enter the market.
Alpha Trend
Evgeny Belyaev
3.33 (3)
Alpha Trend is a trend indicator for the MetaTrader 4 platform; it has been developed by a group of professional traders. The Alpha Trend indicator finds the most probable tendency reversal points, which allows making trades at the very beginning of a trend. This indicator features notifications, which are generated whenever a new signal appears (alert, email, push-notification). This allows you to open a position in a timely manner. Alpha Trend does not redraw, which makes it possible to evalua
PipFinite Breakout EDGE
Karlo Wilson Vendiola
4.89 (286)
The Missing Edge You Need To Catch Breakouts Like A Pro. Follow a step-by-step system that detects the most powerful breakouts! Discover market patterns that generate massive rewards based on a proven and tested strategy. Unlock Your Serious Edge Important information here www.mql5.com/en/blogs/post/723208 The Reliable Expert Advisor Version Automate Breakout EDGE signals using "EA Breakout EDGE" Click Here Have access to the game changing strategy that will take your trading to the n
Real Magic Trend
Muhammed Emin Ugur
This   Real Magic Trend   indicator is designed for signal trading. This indicator generates trend signals. It uses many algorithms and indicators to generate this signal. It tries to generate signals from the points with the highest trend potential. This indicator is a complete trading product. This indicator does not need any additional indicators. The indicator is never repainted. The point at which the signal is given does not change.      Features and Recommendations Time Frame
Los compradores de este producto también adquieren
¡LEA LA INFORMACIÓN A CONTINUACIÓN ANTES DE COMPRAR EL PRODUCTO! ¡Apollo Pips PLUS SP es un producto único! ¡ES PARA AQUELLOS QUE QUIEREN OBTENER MI NUEVO INDICADOR "APOLLO PIPS" MÁS BONO "SUPER PACK" CON ACCESO A TODOS MIS INDICADORES COMERCIALES! Al comprar el producto Apollo Pips PLUS SP, en realidad está comprando una versión absolutamente nueva de mi indicador Apollo Pips. Esta versión del indicador tiene un algoritmo mejorado y un parámetro fácil de usar que le brinda la oportunidad de uti
Gold Channel is a volatility-based indicator, developed with a specific timing algorithm for the XAUUSD pair, which consists of finding possible corrections in the market. This indicator shows two outer lines, an inner line (retracement line) and an arrow sign, where the theory of the channel is to help identify overbought and oversold conditions in the market. The market price will generally fall between the boundaries of the channel. If prices touch or move outside the channel it is a tra
Bomb Bank Signal
Igor Pereira Calil
Señal de Bomb Bank: su indicador de confianza en MetaTrader 4 Bomb Bank Signal es un poderoso indicador para MetaTrader 4, diseñado para identificar las tendencias más relevantes en el mercado financiero. Si buscas una herramienta que anticipe los movimientos con precisión, el Bomb Bank es el aliado que necesitas. Cómo funciona: Este indicador combina tres métodos distintos (análisis de volumen, cierre de velas y tendencia simétrica) para detectar y señalar oportunidades de compra y venta
Enigmera
Ivan Stefanov
5 (2)
ENIGMERA: El núcleo del mercado https://www.enigmera.com Introducción Este indicador y sistema de negociación es un enfoque extraordinario de los mercados financieros. ENIGMERA utiliza los ciclos fractales para calcular con precisión los niveles de soporte y resistencia. Muestra la auténtica fase de acumulación y proporciona dirección y objetivos.  Un sistema que funciona tanto si estamos en una tendencia como en una corrección.  ¿Cómo funciona? ENIGMERA consta de tres líneas: la línea de s
ECM Elite Channel is a volatility-based indicator, developed with a specific time algorithm, which consists of finding possible corrections in the market. This indicator shows two outer lines, an inner line (retracement line) and an arrow sign, where the channel theory is to help identify overbought and oversold conditions in the market. The market price will generally fall between the boundaries of the channel. If prices touch or move outside the channel, it's a trading opportunity. The
NAM Order Blocks
NAM TECH GROUP, CORP.
5 (1)
Indicador de detección de Order Blocks multitimeframe para MT4. Características - Panel de control totalmente personalizable, proporciona una interacción completa. - Oculta y muestra el panel de control donde quieras. - Detecta OB en múltiples marcos de tiempo. - Permite seleccionar la cantidad de OB para mostrar. - Interfaz de usuario de diferentes OBs. - Diferentes filtros de OBs (regulares, rejection y sin capitalizar). - Alerta de proximidad de OBs. - Líneas ADR High y Low. - Servicio de not
MT My Way
Issara Seeboonrueang
Best strategy,  Easy trade ,  Support of version update in the future MT My Way:  For new traders with no experience It is a very simple trade. Open the order when there is signal and close the order when there is exit or found the next opposite signal. You can set Stop Loss at the arrow and set the distance at Arrow Gap. For experienced traders, It will be very easy to trade. indicator for trade by yourself TRADE: Forex  TIME FRAME:  All Time Frame (Not M1) SYMBOL PAIR: All Sy
Full STO
Roman Smoroda
Indicador STO completo (incluye todas las versiones de tres indicadores STO: Premium, Gold, Silver) - STABLE TRADE OPTION está diseñado para el comercio automático de opciones binarias.  ¡¡¡¡¡LEA CUIDADOSAMENTE!!!!! IMPORTANTE En un terminal cree dos plantillas con diferentes vencimientos, una plantilla para las 18:01, 18:02 con vencimientos de 1 a 15 minutos y una plantilla para las 22:00 con vencimientos de 10 a 20 minutos. Winrate: 71% en los últimos 5 años Gestión del dinero: 0,3% d
How to use Pair Trading Station Pair Trading Station is recommended for H1 time frame and you can use it for any currency pairs. To generate buy and sell signal, follow few steps below to apply Pair Trading Station to your MetaTrader terminal. When you load Pair Trading Station on your chart, Pair Trading station will assess available historical data in your MetaTrader platforms for each currency pair. On your chart, the amount of historical data available will be displayed for each currency pai
Introduction to X3 Chart Pattern Scanner X3 Cherart Pattern Scanner is the non-repainting and non-lagging indicator detecting X3 chart patterns including Harmonic pattern, Elliott Wave pattern, X3 patterns, and Japanese Candlestick patterns. Historical patterns match with signal patterns. Hence, you can readily develop the solid trading strategy in your chart. More importantly, this superb pattern scanner can detect the optimal pattern of its kind. In addition, you can switch on and off individu
Connect Indicator
Sukunthakan Ngernbamrung
Connect Indicator is a tool used for connecting indicators between the MQL market and MT4. The connected indicators are made by our group and can be used for other applications, such as sending messages to the Line application or Telegram application. If you have any questions, please don't hesitate to ask us to receive support. Function and indicator buffer Buffer one is the high price of the previous candle. Buffer two is the high price of the previous candle. Usage To connect indicators to fu
TrendMaestro
Stefano Frisetti
5 (3)
note: this indicator is for METATRADER4, if you want the version for METATRADER5 this is the link:  https://www.mql5.com/it/market/product/108106 TRENDMAESTRO ver 2.4 TRENDMAESTRO recognizes a new TREND in the bud, he never makes mistakes. The certainty of identifying a new TREND is priceless. DESCRIPTION TRENDMAESTRO identifies a new TREND in the bud, this indicator examines the volatility, volumes and momentum to identify the moment in which there is an explosion of one or more of these data a
This product is based on the methodologies of Gann, his follower Don E. Hall. The Indicator builds a working view grid, which is used to analyze graphics. The Pyrapoint tool, developed by Don Hall, is a grid based on the Pythagorean cube. In his calculations he uses the Gann Square 9 methodology and the relationship between Price and Time. This tool is used to predict changes in trend and overall market actions. More information about the method   HERE
Dragon Multi Indicator MT4
Mansour Babasafary
5 (4)
3 Indicators in 1 indicator Strategy based on price action Made specifically for the best forex currency pairs Can be used in the best time frame of the market at a very reasonable price This indicator is basically 3 different indicatos . But we have combined these 3 indicators in 1 indicator so that you can use 3 indicators at the lowest price. All three strategies are based on price action. But based on different trends. Long term, medium term and short term Attributes : No repaintin
Max Paynex
Abdulkarim Karazon
Max Payne es un indicador de señal de reversión/tendencia que proporciona señales en forma de flecha, este indicador da su señal al cerrar la misma barra, este indicador puede aparecer varias veces en el gráfico con diferentes períodos para obtener confirmación doble/triple de las señales. El indicador es altamente ajustable para adaptarse a cualquier estilo comercial y nunca se repinta ni se vuelve a pintar. Obtendrá el sistema completo en capturas de pantalla después de la compra junto con la
JULY OFFER 80% OFF next price for unlimited version will be 17000$. This is the only time you can get this institutional and professional indicator at this price for unlimited version. Don't dare to miss this. The tool I am about to introduce to you you can't compare it with other tools due to its strategy and accuracy level in predicting the next price directional movement . This tool is designed for serious traders who have decided to make a difference through trading. Be the next person to wi
4.8(25 reviews)   Rating on   gogojungle 【 TrendLinePro2 】 Indicador de ayuda para el trading de líneas MT4 (MetaTrader 4). Es una especificación muy básica que se recomienda para todos, suponiendo que sea fiel a la teoría de Dow. Reconoce tendencias basadas en la teoría de Dow y, además, dibuja automáticamente líneas de soporte, resistencia y tendencia en tiempo real. La precisión es muy alta. 【 Comprobación del comportamiento 】 En Youtube, se sube un video cada fin de semana para conf
El indicador " ZigZag on Trend " es un asistente para determinar la dirección del movimiento del precio, así como una calculadora de barras y pips. Consiste en un indicador de tendencia que monitorea la dirección del precio con una línea de tendencia presentada en forma de zigzag y un contador que calcula el número de barras pasadas en la dirección de la tendencia y el número de puntos en una escala vertical. (Los cálculos se realizan mediante la apertura de la barra) El indicador no se vuelve a
Indicator : RealValueIndicator Description : RealValueIndicator is a powerful tool designed specifically for trading on the EURUSD pair. This indicator analyzes all EUR and USD pairs, calculates their real currency strength values, and displays them as a single realistic value to give you a head start on price. This indicator will tell you moves before they happen if you use it right. RealValueIndicator allows you to get a quick and accurate overview of the EURUSD currency pair tops and bottoms,
Por supuesto, aquí tienes la traducción al español: Presentamos el Indicador de Astronomía para MT4: Tu Compañero Celestial Definitivo en el Trading ¿Estás listo para elevar tu experiencia de trading a alturas celestiales? No busques más allá de nuestro revolucionario Indicador de Astronomía para MT4. Esta innovadora herramienta trasciende los indicadores de trading tradicionales, aprovechando el poder de algoritmos complejos para proporcionarte una visión astronómica sin igual y cálculos de pre
El Indicador de Cuadrados de Gann es una herramienta poderosa de análisis de mercado basada en el artículo "Fórmula Matemática para Predicciones de Mercado" escrito por W.D. Gann, que se basa en conceptos matemáticos para el análisis. Incorpora elementos de las técnicas de Gann relacionadas con los cuadrados de 144, 90 y 52, así como el cuadrado de 9. Además, incluye el método del sobre cómo combinar el cuadrado de 9 con canales y patrones de estrellas. Manual del Usuario y Modo de Uso: Antes de
SNR LEVEL INDICATOR Accurate Snr level indicator will only display Fresh Levels that are close to the Current Market Price. This indicator is very accurate in mapping Support & resistance levels. there is an alert feature when the price TOUCHES the SNR LEVEL, WHEN CLOSE CANDLE BREAK/REJECT SNR LEVEL. INDICATOR MARKING : - SUPPORT LEVEL = V SHAPE - RESISTANCE LEVEL = APEX LEVEL - GAP RESISTANCE & GAP SUPPORT = OPEN CLOSE CANDLE - SUPPORT BECAME RESISTANCE & RESISTANCE BECAME SUPPORT INDICATOR
Introduction to EFW Analytics EFW Analytics was designed to accomplish the statement "We trade because there are regularities in the financial market". EFW Analytics is a set of tools designed to maximize your trading performance by capturing the repeating fractal geometry, known as the fifth regularity in the financial market. The functionality of EFW Analytics consists of three parts. Firstly, Equilibrium Fractal Wave Index is an exploratory tool to support your trading logic to choose which r
PTS Precision Index Oscillator V2
PrecisionTradingSystems
5 (1)
El Oscilador de Índice de Precisión (Pi-Osc) de Roger Medcalf de Precision Trading Systems La versión 2 ha sido cuidadosamente recodificada para cargar rápidamente en su gráfico y se han incorporado algunas otras mejoras técnicas para mejorar la experiencia. El Pi-Osc fue creado para proporcionar señales precisas de temporización de operaciones diseñadas para encontrar puntos de agotamiento extremos, los puntos a los que los mercados se ven obligados a llegar solo para eliminar las órdenes
Presentamos ON Trade Waves Patterns Harmonic Elliot Wolfe, un indicador avanzado diseñado para detectar diversas formas de patrones en el mercado mediante métodos tanto manuales como automáticos. A continuación, te explicamos cómo funciona: Patrones Armónicos: Este indicador puede identificar patrones armónicos que aparecen en tu gráfico. Estos patrones son esenciales para los traders que practican la teoría del trading armónico, tal como se popularizó en el libro de Scott Carney "Harmonic Tradi
This indicator is based on the mathematics of the great trader W.D. Ganna. With its help, you can easily find strong levels by analyzing swings to find the optimal entry point. The indicator works on all instruments and all timeframes. The indicator is fully manual and has control buttons. All you need to do is press the NEW button, a segment will appear, which you can place on any movement, swing or even 1 candle that you want to analyze. By placing the segment, press the OK button. A grid (th
Dear Traders this is my another tool called " Swing Master Indicator ". As the name above the indicator is designed to help you in swing trading by capturing the low and highs of the price. You may us this tool with any trading strategy and style from scalping to position trading. It is made for level of traders including newbies and advanced traders even prop-firms, hedge funds and banks to help them make sold market analysis. I create tools for serious traders who want to make a difference in
The indicator of a Professional Trader is an arrow indicator for predicting the direction of price movement. I have been working on this indicator since 2014. You can use this indicator as your main indicator, use its entry signals, and use it as your only indicator to find entry points. About the product: Recommended TF [H4-D1-W1]   . The indicator predicts the direction of the next candle. Fits a variety of tools; Flexibility in settings for different instruments and intervals through the
La VELOCIDAD DE TRANSACCIÓN es el indicador de mayor calidad que muestra dónde y cuándo se acumulan grandes órdenes en el mercado y los beneficios de ello. Detecta los cambios de tendencia en una fase muy temprana. Es a la vez un indicador y un sistema de trading. El concepto es único e increíblemente rentable. En Forex, el volumen de ticks se denomina engañosamente volumen. En realidad, se trata de la variación del precio por unidad de tiempo, que de hecho es la VELOCIDAD DE TRANSACCIÓN. Est
The Th3Eng Ninja indicator is based on an analysis of the right trend direction with perfect custom algorithms. It show the true direction and the best point of the trend. With Stop Loss point and Three Take Profit points. Also it provides a secondary entry points in dots arrows style. And Finally it draws a very helpful lines from entry level to TP1, TP2, TP3, SL levels or the reverse signal, and all current/old signals status. How to use the indicator No complicated steps ,   Just follow 2
Otros productos de este autor
Volatility Trend System - un sistema de comercio que da señales para las entradas. El sistema de volatilidad da señales lineales y puntuales en la dirección de la tendencia, así como señales para salir de ella, sin redibujar ni demoras. El indicador de tendencia monitorea la dirección de la tendencia a mediano plazo, muestra la dirección y su cambio. El indicador de señal se basa en cambios en la volatilidad y muestra entradas en el mercado. El indicador está equipado con varios tipos de ale
Scalping and Binary Signal Detector : indicador de especulación que proporciona señales direccionales para abrir posiciones a lo largo de la tendencia. El indicador es un sistema comercial completo que se puede utilizar para Forex y opciones binarias. El sistema de algoritmos permite reconocer movimientos intensos de precios en varias barras consecutivas. El indicador proporciona varios tipos de alertas para las flechas. Funciona en cualquier instrumento comercial y marco de tiempo (se recom
Scalping Entry Points - es un sistema de comercio manual que puede ajustarse a los movimientos de precios y dar señales para abrir operaciones sin volver a dibujar. El indicador determina la dirección de la tendencia por el nivel central de soporte y resistencia. El indicador de puntos proporciona señales para entradas y salidas. Adecuado para operaciones intradía manuales, reventa y opciones binarias. Funciona en todos los plazos e instrumentos comerciales. El indicador da varios tipos de aler
Volatility Trend System - un sistema de comercio que da señales para las entradas. El sistema de volatilidad da señales lineales y puntuales en la dirección de la tendencia, así como señales para salir de ella, sin redibujar ni demoras. El indicador de tendencia monitorea la dirección de la tendencia a mediano plazo, muestra la dirección y su cambio. El indicador de señal se basa en cambios en la volatilidad y muestra entradas en el mercado. El indicador está equipado con varios tipos de alertas
Un indicador técnico diseñado específicamente para el especulación que puede identificar impulsos de volatilidad y mostrar su duración. Tiene parámetros flexibles para la configuración manual, lo que le permite aplicar la funcionalidad del indicador a cualquier instrumento comercial. Los plazos recomendados para utilizar son M5, M15, M30, H1 y H4. Hay varios tipos de alertas. Todas las señales nunca cambian ni cambian de color al cierre de la vela. El indicador está configurado por paráme
El indicador " ZigZag on Trend " es un asistente para determinar la dirección del movimiento del precio, así como una calculadora de barras y pips. Consiste en un indicador de tendencia que monitorea la dirección del precio con una línea de tendencia presentada en forma de zigzag y un contador que calcula el número de barras pasadas en la dirección de la tendencia y el número de puntos en una escala vertical. (Los cálculos se realizan mediante la apertura de la barra) El indicador no se vuelve a
Un complejo de indicadores de reconocer los momentos de reversión. Detecta los picos y los huecos de acuerdo con las combinaciones de velas después de deducir de dos Ma. Aplicable para sistemas comerciales cuando se usan entradas tempranas. Puede usar una tendencia para el comercio de escala y intradía, y para detectar una tendencia en las primeras etapas. Posibilidad Los parámetros proporcionan configuraciones flexibles para cualquier tiempo FLOMS y herramientas comerciales. Hay varios t
Candle Binary Scalper es un producto de análisis técnico para forex y opciones binarias. Incluye varios indicadores técnicos combinados en un sistema de comercio. Adecuado para operaciones manuales dentro de una tendencia, para scalping y opciones binarias. Funciona en todos los plazos e instrumentos comerciales. Los marcos de tiempo recomendados para negociar M15, M30, H1 y H4, M5 y M1 deben usarse en caso de alta volatilidad. Hay varios tipos de alertas. Cómo usar el producto Ya se han
Indicador para negociación manual y análisis técnico de Forex. Consiste en un indicador de tendencia con el nivel de apertura del día de negociación y un indicador de flecha para determinar los puntos de entrada. El indicador no cambia de color; funciona cuando se cierra la vela. Contiene varios tipos de alertas para flechas de señal. Puede configurarse para funcionar en cualquier gráfico, instrumento comercial o período de tiempo. La estrategia de trabajo se basa en la búsqueda de movi
Un complejo de indicadores de reconocer los momentos de reversión. Detecta los picos y los huecos de acuerdo con las combinaciones de velas después de deducir de dos Ma. Aplicable para sistemas comerciales cuando se usan entradas tempranas. Puede usar una tendencia para el comercio de escala y intradía, y para detectar una tendencia en las primeras etapas. Posibilidad Los parámetros proporcionan configuraciones flexibles para cualquier tiempo FLOMS y herramientas comerciales. Hay varios t
Wave Reversal Indicator - determines the direction of trend waves and price reversals. The indicator shows wave movements and trend directions. It gives recommendations where to follow the trader, helps to follow the trading strategy. It is an addition to an intraday or medium-term strategy. Almost all parameters are selected for each time frame and are changed automatically, the only parameter for manual adjustment is the wavelength. Works on various trading instruments and timeframes, rec
FREE
Indicador cíclico para negociar y predecir la dirección del mercado. Muestra el comportamiento cíclico del precio en forma de oscilador. Da señales para abrir tratos al rebotar desde los límites superior e inferior del oscilador. En forma de histograma, muestra la fuerza suavizada de la tendencia. Complementará cualquier estrategia comercial, desde scalping hasta intradía. El indicador no se vuelve a dibujar. Adecuado para su uso en todos los símbolos/instrumentos. Marcos de tiempo adecuados p
Zig-Zag indicator with additional signals for inputs. Visually easy to use: The red zig-zag line is an uptrend. The blue zig-zag line is a downward trend. Arrows in the form of additional signals. Works on any trading pairs. On any timeframe. Not redrawn. Input parameters Zig-Zag Period - Zig-zag period (from 5) Signal Period - period of signal arrows (from 3) Alerts for signals Play sound - Sound alert Display pop-up message - Notification by message on the screen Send push not
FREE
Candle Power Signals es un indicador de tendencia que utiliza una estrategia de búsqueda de posibles señales volátiles para tomar decisiones comerciales. Al analizar el mercado, el indicador identifica zonas de mayor y menor volatilidad dentro del movimiento de tendencia direccional. Los principales parámetros de generación de señal ya han sido configurados, los ajustes y periodos restantes están indexados en 2 parámetros para configuración manual: 1. "Candle calculation method" : 2 modos d
Level Breakout Indicator es un producto de análisis técnico que funciona desde los límites superior e inferior, que pueden determinar la dirección de la tendencia. Funciona en la vela 0 sin redibujados ni retrasos. En su trabajo, utiliza un sistema de diferentes indicadores, cuyos parámetros ya han sido configurados y combinados en un solo parámetro: " Scale ", que realiza la gradación de períodos. El indicador es fácil de usar, no requiere ningún cálculo, utilizando un único parámetro debe se
Max Min Reversal Arrows MT5 - an arrow reversal indicator for predicting price movement. The indicator is built on the support and resistance levels at the local lows and highs of the price. Product features Arrows appear on the current candle. The indicator does not redraw. Can be used on all time frames and trading instruments. Recommended timeframes to use M30, H1, H4. The dotted lines are the support and resistance levels within the signal. Price movement from these levels means a reve
El sistema de comercio técnico de BB Reversal Arrows se ha desarrollado para predecir puntos inversos para tomar decisiones minoristas. El indicador analiza la situación actual del mercado y se estructura para varios criterios: la expectativa de momentos de reversión, posibles puntos de inflexión, señales de compra y venta. El indicador no contiene información en exceso, tiene una interfaz visual comprensible, lo que permite a los operadores tomar decisiones razonables. Todas las flechas pa
Indicador del canal de precios y generador de puntos de quiebre en su interior. Da una idea de la posición del precio en relación con el período de uso. Contiene líneas de rebote de tendencia suavizadas construidas a lo largo de los bordes del canal y puntos de rebote que determinan los momentos de entrada y salida. Funciona en varios instrumentos comerciales y marcos de tiempo. Cómo trabajar con el indicador Siga la línea de interrupción del canal, la línea azul está arriba de las entrad
Smoothed oscillator based on basic DeMarker indicators. Shows the volatility of the price direction. Can be used to determine intraday entry and exit points from the market. Suitable for use on all time frames and trading instruments. It is recommended to use on M5, M15 and M30. The green line shows the price direction up, the blue line shows the price direction down. The red line is a smoothed representation of the price. Input parameters      Period - Period of the main indicator DeMarker
FREE
Un indicador de tendencia que muestra la fuerza de los alcistas y bajistas en un rango de cotización. Consta de dos líneas: La línea verde es una condición equilibrada de sobrecompra/sobreventa. La línea roja es la dirección de la actividad comercial. No vuelve a dibujar los cálculos. Se puede utilizar en todos los Símbolos/Instrumentos/Marcos de tiempo. Fácil de usar y configurar. Cómo utilizar el indicador y qué determina. La regla básica es seguir la dirección de la línea roja: s
FREE
Lines Channel Pro
Vitalyi Belyh
5 (1)
El indicador "Lines Channel Pro" determina las reversiones de precios desde el canal High/Low. Contiene un buscador de tendencias incorporado, líneas de señal, puntos de entrada y salida. El marco de tiempo recomendado para que M15 funcione es D1. Para cada período de tiempo e instrumento comercial, dependiendo de la volatilidad, es necesario seleccionar configuraciones individuales. No vuelve a dibujar los cálculos. Parámetros de entrada Use Channel trend filter - activar/desactivar
Arrow indicator with trend filter. Generates trend input without delays or delays - on the emerging candle. Suitable for use on any trading tools and timeframes. Easy to use, contains the direction of the trend in the form of a histogram lines and signal generator. Input parameters Period Trend Line - Period of the Histogram Line Signal Generator Period - If the period is longer, then the arrows are less Play sound Display pop-up message Send push notification Send email Sound file signal -
An indicator that determines the point levels of price resistance. The arrows indicate price bounces in the indicated directions. Arrows are not redrawn formed on the current candle, shown on the previous candle for convenience.      It has one setting - the formation intensity: If the parameter is smaller, most of the signals are formed in a wide trend. If the parameter is larger, signals are formed in a narrower trend. Input parameters Formation Intensity - Arrow Formation Intensity Num
Channel Cluster
Vitalyi Belyh
5 (1)
Cluster indicator working in the price channel. For operation, the indicator builds a channel line - (dashed line). Inside the channel, cluster sections are determined that determine the direction of the price movement - (histograms in two directions), start with large arrows. Small arrows are plotted above / below each histogram - indicator increase volatility. The indicator does not redraw the values. Works on any tools and timeframes. Entrances are made when large arrows appear, inside s
A technical indicator that calculates its readings based on trading volumes. It has an oscillatory line that follows the change in volumes. Large arrows on the line indicate reversal values. A channel is built around the line with small arrows showing the strengthening of price movement in the direction of increasing volumes. The indicator does not redraw values. Works on any instrument and timeframe. It can complement any trading strategy by finding a trend or make entries in the direction of
Max Min Reversal Arrows - an arrow reversal indicator for predicting price movement. The indicator is built on the support and resistance levels at the local lows and highs of the price. Product features Arrows appear on the current candle. The indicator does not redraw. Can be used on all time frames and trading instruments. Recommended timeframes to use M30, H1, H4. The dotted lines are the support and resistance levels within the signal. Price movement from these levels means a reversal.
Scalping Entry Points - es un sistema de comercio manual que puede ajustarse a los movimientos de precios y dar señales para abrir operaciones sin volver a dibujar. El indicador determina la dirección de la tendencia por el nivel central de soporte y resistencia. El indicador de puntos proporciona señales para entradas y salidas. Adecuado para operaciones intradía manuales, reventa y opciones binarias. Funciona en todos los plazos e instrumentos comerciales. El indicador da varios tipos de aler
Binary Lines es un indicador de análisis técnico para divisas, materias primas, criptomonedas, acciones, índices y cualquier instrumento financiero. Se puede utilizar para opciones binarias o reventa de divisas. Muestra los puntos de entrada y salida a intervalos fijos y proporciona comerciantes la información necesaria sobre los resultados de posibles transacciones. Los puntos de entrada se forman al comienzo de la vela, en la dirección de la línea MA, duración las operaciones en barras se pued
Un indicador técnico que calcula sus lecturas sobre los volúmenes de negociación. En forma de histograma, muestra la acumulación de la fuerza del movimiento del instrumento comercial. Dispone de sistemas de cálculo independientes para direcciones alcistas y bajistas. Funciona en cualquier instrumento comercial y marco de tiempo. Puede complementar cualquier sistema comercial. El indicador no vuelve a dibujar sus valores, las señales aparecen en la vela actual. Es fácil de usar y no carga el gr
Line Breakouts - sistema para el comercio de tendencias. Contiene un identificador de tendencia que se puede adaptar a cualquier gráfico e instrumento comercial utilizando la función de período y suavizado. Y un determinante de los niveles de soporte y resistencia. Cuando el precio esté por debajo de la línea de resistencia, abra operaciones de Venta, y cuando el precio esté por encima de la línea de soporte, abra operaciones de Compra. El stop loss debe colocarse a pocos puntos de las líneas,
Filtro:
No hay comentarios
Respuesta al comentario