Robots comerciales e indicadores de pago para MetaTrader 5 - 64

The TickCounter indicator counts up and down ticks on each new bar.
The calculation starts from the moment the indicator is placed on the chart.
Histogram bars represent: Yellow bars - total number of ticks; Blue bars - ticks UP; Red bars - ticks DOWN. If the blue bar is not visible, then there are more down ticks and the red bar is displayed on top of the blue one (the red layer is above the blue one). MT4 version: https://www.mql5.com/en/market/product/82548
Each reinitialization of th
Este EA fue desarrollado para el mercado brasileño en "WIN" activo en todas las series del año. Se utiliza un método de confluencia de varios indicadores de medias móviles, NIIF y ATR. Utiliza la técnica de precio medio para recuperar pérdidas en una situación de reversión del movimiento, y se puede habilitar y parametrizar. El objetivo es ganar 50 puntos en cada entrada, con sólo 1 contrato el riesgo se minimiza y el beneficio es gradual. Reconoce y evita la entrada en los niveles de lateraliz

ROC Price Histogram Alert es un indicador técnico basado en el impulso que mide el cambio porcentual en el precio entre el precio actual y el precio hace un cierto número de períodos. ROC se traza con un histograma frente a cero, con el indicador moviéndose hacia arriba a territorio positivo si los cambios de precios son al alza, y moviéndose a territorio negativo si los cambios de precios son a la baja.
El paso principal para calcular el período ROC es la configuración de entrada del 'períod

Market Conditions indicators can provide support to the trader so that he can identify market trends over a given period. The purpose of this model is to allow traders to have a global vision on the exchange markets. And the formula that we develop allow to scan the major currencies in the exchange market. The model uses a purely statistical formula which is based on the historical data of the major currencies "eur, usd, gbp, jpy, aud, nzd, cad, chd". Of which 28 currency pairs are traded. It

SLTPSetter - StopLoss Take Profit Setter HOW DOES IT WORK? Risk and account management is a very critical aspect of trading. Before entering a position, you must be fully aware how much you will be willing to loss both in percentage and value. This is where SLTPSetter gets you covered.
All you need to do is attach the indicator on the chart and PRESS BUY OR SELL automatically, all parameters needed for placing the trades will be provided at the top left corner of the screen. Feel free to adjus

At first, I got my teeth into Phoenix Ultra Expert Advisor.
This Expert Advisor will support automatic close order if the direction is correct and perform recovery if the direction is wrong. If you enter an order: 1. The price goes in the right direction and hits the Min Profit Point , trailing stop 20% of the current profit. 2. The price goes in the opposite direction, the Expert Advisor will place the order with the volume is Recovery Volume Percent at the input, the distance t

El indicador Market Entropy se creó para medir el orden de los cambios de precios a lo largo del tiempo. consta de dos líneas y un histograma donde las líneas se encargan de medir el movimiento del precio y el histograma mide la fuerza del movimiento analizado. Se puede usar para encontrar una tendencia (Imagen 2) o una reversión de precios (Imagen 3).
Línea Azul: Comprar Entropía Línea Roja: Vender Entropía Historgrama: Entropía del mercado
Interpretación: La línea de compra por encima de

Informações Importantes sobre o ArrowHacker (Não repinta! Não gera sinais atrasados!)
Se você está procurando um indicador que cumpre aquilo que promete, você acabou de encontrar! O ArrowHacker irá superar todas as suas expectativas com certeza! E o melhor de tudo, é só colocar na sua conta, ligar e já começar a lucrar!
O ArrowHacker é um sistema profissional de trade criado para as plataformas MT4 & MT5 e otimizado para trabalhar com qualquer ativo na plataforma MetaTrader 5, sejam moeda

Remove comments from MQL5 and MQL4 code with a few mouse clicks using this utility. The utility processes all files in the root directory and in all folders of your project at once. Use the "Remove Comments" to protect your source code before compilation, when you publish the next version of your product in the MQL Market, or when you give an executable file to your customer. You can work with the actual source code of your project in the \MQL5\EXPERTS\ or \MQL5\INDICATORS folders. At th

40% off. Original price: $50
Advanced Bollinger Bands Scanner is a multi symbol multi timeframe Bollinger bands dashboard that monitors and analyzes the Bollinger Bands indicator from one chart. This panel scans the Bollinger bands indicator in up to 28 configurable instruments and 9 timeframes for price overbought/oversold, price consolidation (Bollinger bands squeeze), and consolidation breakout (squeeze break) with a deep scan feature to scan all market watch symbols (up to 1000 instrumen

HiLo B3 Trader é o robô de negociação automatizada para a bolsa brasileira B3, para ativos miniíndice WIN, minidólar WDO e também ativos como milho (CCM). O robô opera calculando o indicador HiLo e emitindo ordens de acordo com a tendência. Além da configuração do período do HiLo, pode-se configurar filtros de tendência, bem como ajustar o takeprofit e stoploss para fixos ou dinâmicos com o indicador ATR. Ativos recomendados: WIN, WDO, CCM. Timeframes: M10. Atenção: alterar o parâmetro BR1 para

Всем привет. Представляю Вашему вниманию Индикатор TRUE ATR. Так же есть данный индикатор для mt4 https://www.mql5.com/ru/market/product/82414 Данный индикатор работает на всех рынках. TRUE ATR высчитывает среднестатистическое движение инструмента за 1 день и показывает сколько в инструменте осталось энергии внутри дня. В отличие от классического индикатора АТР которые без разбора учитывает все бары(свечи), TRUE ATR при расчете среднестатистического движения инструмента использует ближайших 5

Informações Importantes sobre o CryptoHacker (Não repinta! Não gera sinais atrasados!)
Se você está procurando um indicador que cumpre aquilo que promete, você acabou de encontrar! O CryptoHacker irá superar todas as suas expectativas com certeza! E o melhor de tudo, é só colocar na sua conta, ligar e já começar a lucrar!
O CryptoHacker é um sistema profissional de trade criado para as plataformas MT4 & MT5 e otimizado para trabalhar com CryptoMoedas.
Nosso sistema utiliza uma poderosa
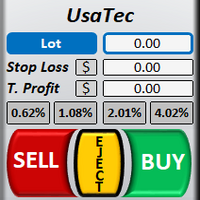
Welcome to TradeX Chart Trading
This utility allows you to send orders quickly and easily. With it you can operate directly from the chart using the shortcut keys SHIFT to buy and CTRL to sell. It is also possible to set Stop Loss and Take Profit, in price or points, directly on the TradeX. Use one of the four risk options (0,5%, 1,0%, 2,0% or 4,0%) to get the pending order volume according to the size of the last closed candlestick and the account balance. Once positioned, it offers Breakeven
The Forex grid trading strategy is a technique that seeks to make a profit on the natural movement of the market. The robot is designed to trade on GBPUSD, but can also trade on other pairs. EA has the advantage of simplicity and a unique position enhancer. What is important. Positions are opened at the close of the candle.
Input parameters: Start Trend in pips. Comment; Max Spread (Digits 5) Slippage Magic Number Stop Loss Take Profit (first position) Average Take Profit PipsStep for gr

PULLBACK HUNTER (CAZADOR DE RETROCESOS) ¿Cuál es el último sueño de todo comerciante? Para ver sin demora dónde se producirá el retroceso. Por supuesto, es una especie de magia, aunque... nada es imposible. Pero mientras tanto he preparado para usted un indicador que marca en tiempo real el final de la corrección al movimiento actual o en pocas palabras - capta los retrocesos. ¿Cuál es la idea principal? Mucha gente practica los rebotes cuando el precio se mueve en la dirección de la posición ab

Before installing the HeatMap indicator make sure you are using a broker that gives you access to the Depth of market (DOM) !!
This indicator creates a heatmap on your chart allowing you to see the buy or sell limit orders easily and in real time. You have the possibility to change the setting and the colors of the HeatMap in order to adapt to all markets and all charts. Here is an example of a setting you can use with the NASDAQ100 on the AMPGlobal broker : https://www.youtube.com/watch?v=x0

Dada la diferencia en las sesiones de negociación, el indicador muestra la dirección de la tendencia y el nivel de resistencia. Todos los eventos se marcan en el gráfico y se envían alertas. Usando SessionAlert, puede operar de manera segura y mesurada. Basta con especificar las horas de Inicio y fin de las sesiones. El indicador muestra el nivel de resistencia, la flecha indica el evento de cambio de tendencia y, además, marca el toque del precio del nivel de resistencia. El principio de funcio

Camaleão Bands B3 Trader é o robô de negociação automatizado para a bolsa Brasileira B3, tanto para trade em miniínidice WIN, quanto para trade em minidólar WDO. O robô usa as Bandas de Bollinger para análise de ordens de entradas, permitindo trades a favor ou contra a tendência, dependendo da volatilidade das bandas, afinal, quando as bandas estão estreitas, é mais provável que o mercado fique lateral, realizando mais trades contra a tendência. Porém, quando o mercado explode, as bandas se alar

Second To NoneFX Spike Catcher EA V1.1 Use This spike Catcher everyday or let it run on VPS, make profit and withdraw everyday. Very Cheap and accurate Spike Catcher... AFFORDABLE!!!
2nd To NoneFX Spike Catcher EA V1.1 -----> NEW FEATURE Multiply on loss to cover previous loss. This Robot is Also Developed To milk the BOOM and CRASH indices . It works On all Boom and Crash pairs (boom 300, 500, 1000 & Crash 300, 500, 1000) I would Highly recommend that you use this Robot to Catch spikes
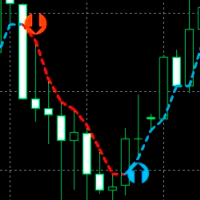
Un indicador para determinar con precisión los puntos de reversión de precios en todos los marcos de tiempo y todos los pares de divisas. Con la ayuda del análisis técnico del mercado y modelos matemáticos de diagnóstico, este indicador determina los puntos de reversión del precio y la dirección de la tendencia actual con gran eficiencia. El indicador muestra esta información en el gráfico en forma de flechas y líneas. Las flechas muestran los puntos de inversión de la tendencia y las líneas mu

British stuff The Expert Advisor tool has been developed for GBPJPY 1H based on SMA 200 and pending orders. It has been backtested on more than 18-year long tick data with 99% quality of modeling. The enclosed screenshots demonstrate the complexity. A broker with a small spread and slippage is recommended for better performance. There is no need to set up any parameters, except Magic number and Friday exit time, lot size . All other settings are already optimized and fine-tuned. Strategy worki

GBP Scalper 03 is a simple EA that can work automatically to carry out trading activities. Like the previous version (GBP Scalper 01 & GBP Scalper 02 (MT4 platform)), this EA is kept simple and only requires Lot, TP, and SL settings to use.
And because of the absence of the Buy_only and Sell_only options on the MT5 platform, an option is added to manage the activation of Buy Trade or Sell Trade
As the name implies, this EA is only suitable for trading with the GBPUSD pair, and is desi
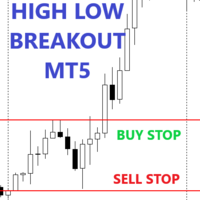
This expert advisor will make a pending order at a certain time, pending orders are made in the form of buying at the highest price and selling at the lowest price (in a predetermined time frame) you can make a pending order breakout at the highest and lowest prices according to your wishes, thus it can be used for the following strategies: - Asian Session BreakOut - European Session BreakOut - US Session Breakout - News Trading - Etc.
Main parameter description Notes : order type 4 is not par

50% off. Original price: $60 Support and Resistance zones indicator for MT5 is a multi-timeframe panel and alert that finds support and resistance zones and pivot points for all timeframes of MetaTrader 5 and gives alert when price has interaction with them. Download demo version (works on GBPUSD, EURJPY and NZDUSD symbols) Read the full description of scanner parameters in the blog page . Many unique features in one indicator: Integrating support and resistance zones and pivot points in one in
The idea of this trading system from the EMA with a Mediante price from the EMA indicators is based exactly 100% from Ripster47 trading system, me is just the person to create it on the MT5 platform, but with alerts for your own buy/sell settings. Hereby I make a copy from Ripster47 explanation for using that system: " EMA Cloud By Ripster
EMA Cloud System is a Trading System Invented by Ripster where areas are shaded between two desired EMAs. The concept implies the EMA cloud area

Supimpa B3 Trader é o robô de negociação automatizada para a bolsa brasileira B3, para os ativos miniíndice WIN e minidólar WDO. A estratégia de negociação é baseada na média VWAP - Volume Weighted Average Price - que utiliza uma média ponderada dos preços em relação ao volume de negociação em cada vela. O robô é de configuração simples, com entrada do valor do período da média de análise e do takeprofit e stoploss fixos. Além disso, pode-se configurar também o número de contratos, configuração

VWAP Volume And Price is the indicator for Volume Weighted Average Price, designed according to regular calculation. The average price is calculated using typical price - (high + low + close) / 3 - and weighted by volume for each candle. So, the indicator can be used to trend trades, balanced with volume. Try other products and expert advisors too. Any doubt, PM.
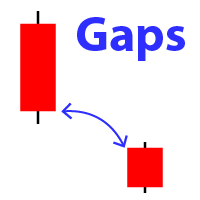
Displays the appearance of a gap on the chart (when the closing price of the previous bar differs from the opening price of the new bar). My #1 Utility: includes 65+ functions | Contact me if you have any questions In the initial settings you can configure: The gap size : gap that exceed this value will be displayed. Size type: pips / poitns / %; Arrow color : separate for up and down gaps. Terminal / Email / Push notifications When you hover the mouse over the gap arrows on the char

Informações Importantes sobre o Bra50 Index Bot (BACKTEST VISUAL desativado para proteger parte da Estratégia.)
Se você está procurando um robô que cumpre aquilo que promete, você acabou de encontrar! O Brazil Index Bot irá superar todas as suas expectativas com certeza! E o melhor de tudo, é só colocar na sua conta, ligar e já começar a lucrar! Deseja conhecer mais sobre o Bra50 Index Bot e seus resultados? Baixe agora os relatórios detalhados em: https://bit.ly/INFOSBRAZILINDEXBOT (Utilize e

Informações Importantes sobre o Brazil Index Bot (BACKTEST VISUAL desativado para proteger parte da Estratégia.)
Se você está procurando um robô que cumpre aquilo que promete, você acabou de encontrar! O Brazil Index Bot irá superar todas as suas expectativas com certeza! E o melhor de tudo, é só colocar na sua conta, ligar e já começar a lucrar! Deseja conhecer mais sobre o Brazil Index Bot e seus resultados? Baixe agora os relatórios detalhados em: https://bit.ly/INFOSBRAZILINDEXBOT (Utilize

Investopedia FIVE EA se basa en este artículo:
https://www.investopedia.com/articles/forex/08/five-minute-momo.asp
CONDICIONES COMERCIALES
- Busque el comercio de pares de divisas por debajo de la EMA y el MACD del período X para estar en territorio negativo. - Espere a que el precio cruce por encima de la EMA del período X, luego asegúrese de que el MACD esté en proceso de cruzar de negativo a positivo o haya cruzado a territorio positivo dentro de cinco barras. - Vaya largo X pips p
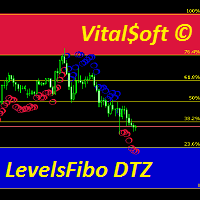
The combined Levels Ib DTZ indicator helps to determine the trend direction when trading. Displaying signals on the chart about a possible upcoming trend change. The indicator is a combination of Fibonacci levels with overbought and oversold zones and a trend indicator based on ZigZag and ATR indicators. The Levels Ib DTZ indicator helps traders predict future price movements and adjust their strategy accordingly. It works on all timeframes.

Este Asesor Experto trabaja sobre las señales del indicador Parabólico, mientras analiza las lecturas de otros indicadores, especialmente el Estocástico. Establece órdenes pendientes, por regla general, se activan cuando se produce un cambio de tendencia local. Si las condiciones comerciales se vuelven inadecuadas, puede eliminar las órdenes pendientes. Tiene muchos ajustes, el stop loss también puede moverse a lo largo de la parabólica con otros parámetros.
Plazos recomendados: M5, M15, M30,
La serie hipergeométrica se utiliza para calcular los coeficientes de peso de este filtro. Este enfoque le permite obtener un suavizado bastante interesante de la serie temporal. Los pesos del filtro hipergeométrico no decaen tan rápido como los promedios móviles ponderados lineales y exponenciales, pero sí más rápido que los promedios móviles suavizados. Debido a esto, el comportamiento de este filtro es en muchos aspectos similar al comportamiento de las medias móviles. Sin embargo, tiene var

Basato sull'indicatore RSI aiuta a capire quando il trend sta cambiando in base ai periodi impostati. E' possibile impostare intervalli di tempo personalizzati e colori delle frecce. Segui l'andamento e valuta anche in base alla volatilità dell'asset. Funziona con ogni coppia di valuta ed è da considerare come un'aiuto ad una valutazione. Puoi associarlo con altri indicatori.

Un enfoque de sentido común para la observación de precios Compre cuando los precios suban y venda cuando los precios bajen La declaración anterior de comprar cuando los precios suben o vender cuando los precios bajan puede ser demasiado amplia y, por lo tanto, puede necesitar algunas pautas y reglas, aquí es donde entran en juego los 3 patos.
El indicador Price Average Mt5 lo ayudará a identificar oportunidades de compra en la dirección de la última tendencia alcista y oportunidades de venta

Donchian Channel DC is the indicator of Donchian Channels, that plots maximum and minimum values of a specific period, besides mean value line. It´s possible to configure simple period for analysis and the indicator will plot all three values. You can trade with this indicator as trend or reversal, according to each strategy. Do not let to test others indicators as soon as others expert advisors.

Multi Chart Refresh Mt5, es un script indispensable rápido y sin problemas que permite actualizar varios gráficos simultáneamente desde uno y el mismo. La multitarea lo hace posible, ya que puede elegir de antemano qué símbolos desea actualizar. ¿Como funciona?
Abra cualquier gráfico, arrastre el script desde el navegador y suéltelo en el gráfico. Establezca los símbolos deseados y haga clic en Aceptar, ¡listo! Tenga en cuenta que este es un script y no un asesor experto, el programa se elimi

Plot History Mt5, un script indispensable para el comerciante que analiza el historial comercial de su terminal comercial y cuenta realizado por asesores expertos. El método de análisis se basa en el diagrama de símbolos en el que se ejecuta el script, así como en el número mágico, un análisis específico o completo de todas las magias utilizadas por uno o más expertos. El script analiza los datos comerciales y puede trazarlos en el gráfico, imprimir información comercial detallada en el registr

The " Stochastic Advanced " indicator displays the signals of the 'Stochastic" indicator directly on the chart without the presence of the indicator itself at the bottom of the screen. The indicator signals can be displayed not only on the current timeframe, but also on a timeframe one level higher. In addition, we have implemented a filter system based on the Moving Average indicator.
Manual (Be sure to read before purchasing) | Version for MT4 Advantages
1. Displaying the signals of the "Sto
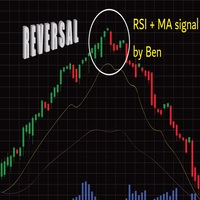
Important : have a good money management with this tpe of EA (little lot size....and avoid margin call)
The EA takes a trade when 2 conditions are met: The achievement of an RSI level, and the break of a moving average of your choice.
When the trade is initiated: the SL is positioned (in pips) the TP1 can be: the kijun, or another moving average, you can configure a value approaching the TP1 (which avoids the price shift of brokers) the partial close is done the SL after TP1 can be configur
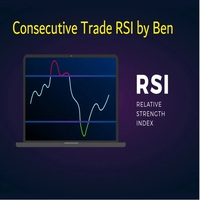
This EA takes trades based on a configured RSI level. At each candle close, it will resume a position if the one closes above the previous one.... The SL and TP are positioned and it is the sum of all the trades initiated that will close the positions: Either in % of capital, or in pips. IMPORTANT :
it is the magic number that allows the EA to properly close positions. so be sure to put different magic numbers on each graph. Important : have a good money management with this type of EA (lit
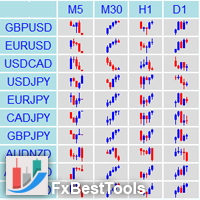
Definition : Market View is a dashboard (scanner) to view price graphs of all symbols and all timeframes at a glance. The utility is designed user friendly and added a wide range of customization options.
Main features of Market View : Visual settings window on the chart Customizable list of symbols and timeframes Different shapes : Real Candles, Schematic Candles, Arrows Customizable number of candles Changeable size of dashboard (scanner)
Highlight timeframes with gaps on candles Open appr
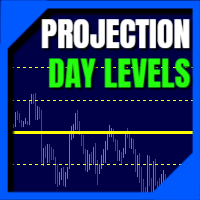
Daily Projection Levels , as the name implies, is an indicator that project the price changes in percentage above and below the opening of the day (or closing of the previous day.
These are "psychological" support and resistance areas where price tries to retrace or break out.
With this you have a powerful tool to predict what these zones will be! You can define which projection levels you want (up to 5 above and below), in addition to have alert messages and visual customization. If you want
Expert Advisor Stop and Reverse Cut Switch Hedge based on Parabolic SAR indicator. There are two setting in EA: 1. Cut Switch 2. Hedging
Recommended settings: TimeFrame = H4 Risk = 0.1 Minimum Balance = 1.000 MaxToBep = 4
Main Parameter Description: - Hedging Mode False = Cut Switch True = Hedging - Max Martingale Level = Lot / Volume will reset after "n" Losses - Risk = Based % of Balance -MaxOP to BEP = Target BEP will be active if there is a certain number op open position - Percent BEP
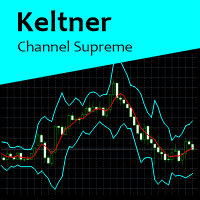
Keltner Channel Supreme is a indicator based on Keltner Channels, with some configuration besides period and Keltner multiplier factor. In this indicator, it is possible to change to an exponential moving average and if prices will be calculated according to close price or typical price. This indicator works on all graphics. If you have some doubt, please PM.

Multifunctional universal trading system . Suitable for all Forex and Crypto markets.
.set files are updated weekly, published on our site.
----
Frankenstein.ex5 [with GUI], provides with graphical interface for TS_DayTrader Trading System.
Features an extensive array of tools for manual and automated trading.
For optimization capabilities, see Frank.ex5 [FOR OPTIMIZATION] - version for the MT5 Tester.
Both Frankenstein.ex5 and Frank.ex5 have automatic trading capabilities.
Paramet

Robo = Crisis = - un nuevo enfoque único para el comercio en el" pantano " de comercio. El comercio en el modo automático y semiautomático. El robot funciona según la situación actual del mercado, sin historias, redibujos, cuadrículas y otras cosas. Una de las principales ventajas del robot es el amor por la fuerte volatilidad. No tiene miedo de las noticias. Absolutamente cualquier volatilidad en el mercado es nuestro amigo. Características del comercio: - El EA incluye ( Robo = Crisis = y el i

Only gold and bitcoin can be profitable. Trade time is 30 minutes and trend time is 1 hour.
You should check the efficiency of this robot at the end of three months.
Strong trends make very good profits.
There are many inputs for your personalization, but the best settings are defined by default.
This indicator will have many updates and special settings will be added to it.
You can contact us via Instagram, Telegram, WhatsApp, email or here. We are ready to answer you.

In this indicator, Heiken Ashi candles are calculated with the most optimal method. You can also customize the results by adjusting the amount of period and method input. But the most important advantage of this indicator is the adjustment of the time frame value. You can use this to calculate the Heiken Ashi chandels to See in time frames with lottery in the lower time chart. In this case, you get the best signal to buy or sell using two or more Heiken Ashi indicators with different timeframes

CHART OBJECTS: Blue box : Bullish Order Blocks (OB) Red box : Bearish OB Orange box : Mitigated OB. Price bounce from this area the made a new high/low Light gray box : Price bounced from this area but did not made a new high/low Dark gray box : Broken OB. Filled boxes : TimeFrame 1 Order Blocks
Unfilled boxes : TimeFrame 2 Order Blocks
INDICATOR SETTINGS: Order Block Required Length: Required number of subsequent candles in the same direction to identify Order Block. Default value: 5 Im

///XShea///
Basado en la lógica del indicador (MFI) aplicado a los cruces de niveles. Solo Scalping
Después de varios meses de testeo y aplicación en cuenta real he decidido poner a la disposición de los compradores esta valiosa herramienta con la cual si se siguen las correspondientes reglas se podrá conseguir muy buenos beneficios en para sus cuentas de forex.
Este indicador esta programado para enviar alertas sonoras y notificaciones

New Trend Alerts finds new trends at the changing bar very quickly. If the trend has enough power and a quality up/down angle, then the indicator sends multiple alarms to alert you: via email, mobile notification, alert window and alert sound. All of these different alarms are optional, and you can choose which ones you would like to use. The indicator calculates the derivative of the price chart to reveal the slope of price curve and its sign changes. Red bars indicate a positive sign or uptre

Multiple Timeframe Trend Alert
I. Overview
Real-time analysis of trends on nine time frames (M1, M5, M15, M30, H1, H4, D1, W1, MN1) based on the calculation of highs and lows using swing highs and lows and Dow Theory. Indicator sends notifications (alerts) when the trends of the specified time frames match.
II. Advantage
Since this indicator notifies you when a trend coincides, you can seize trading opportunities without having to stay on the charts.
In addition, by introducing this i

The most sensitive indicator you've ever seen! And now with Alerts
POscillator Alert is a sensitive indicator that finds each trend direction change in every timeframe and then notifies you with the necessary alarms. It's a new version of the POscillator Indicator, with the addition of its alarm sending capability. The Indicator can send multiple alerts: email, mobile phone notification, alert window and alert sound. All of these different alarms are optional and you can choose the ones you
Average Daily Range with factor target and more functions (ADR)
Hello traders,
The upgraded ADR dashboard now is also for MT5 much more better and more convenient for day trader, try it to experience the good things!
How to use Average Daily Range (ADR) Indicator?
ADR is just a simple indicator tool to help trader identify the daily average range of an instrument. So for example we have the pairs EURUSD and that pairs usually makes a peak and bottom during the trading day an
MT4 Version A versatile tool
You do not need any other tools with this tool.
You can enable or disable all indicators.
Their values are adjustable.
In the first line you will see a summary of your account status.
p: The amount of your profit or loss
BP: The amount of your daily profit based on the balance
EP: Equity daily earnings
WP: Your weekly profit
MP: Your monthly profit
The next line shows each of the time frames you selected.
Chikou: The Chikou process
KT: The trend of t

Matrix es la base de algoritmos comerciales complejos, ya que lo ayuda a realizar cálculos complejos sin esfuerzo y sin la necesidad de demasiada potencia de cálculo. No hay duda de que Matrix ha hecho posible muchos de los cálculos en las computadoras modernas, ya que todos sabemos que los bits de información son almacenados en forma de matriz en la memoria RAM de nuestra computadora, Al usar algunas de las funciones de esta biblioteca, pude crear robots de aprendizaje automático que podían ace
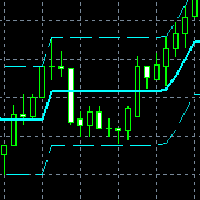
It is a new indicator that frames the price movement and tracks it. It consists of oscillation channel and its center line CL . For its calculation it is only necessary to introduce the amplitude of the channel. Because of this, it is a non-lagging indicator as it is not calculated based on a number of previous candlesticks. It removes any level of noise , showing the underlying price movement cleanly via the center line . It allows you to easily identify the beginnings a
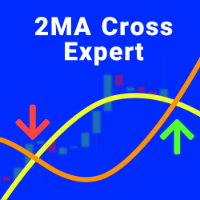
In previous products, we have published an indicator of this strategy, but now we offer you an Expert Advisor to make it easier for traders The procedure is whenever two Moving Average indicators cross each other (their settings are accessible in the "Inputs" section), the EA will open a position buy/sell automatically based on the direction of crossing, and by the volume, SL and TP that you specify in the "Inputs" section. You also can define the direction of the positions, Buy, Sell, or Both.

MACD with fast and slow EMA. Moving average convergence divergence (MACD) is a trend-following momentum indicator that shows the relationship between two moving averages of a security's price . The MACD is calculated by subtracting the fast-period exponential moving average (EMA) from the slow-period EMA. Setup options: Fast EMA period Slow EMA period Signal EMA period Applied price Indicator window height Color MACD Color Signal Color Histogram

EXPER ADIVSOR that gets economic news calendar from forexfacotry.com and calculates time until next news happen or since last news happened. It shows exactly same output as ffcal for MT4 by Derk Wehler, original version may be available at forexfacotry
This version is clean, done WITHOUT ANY DLL IMPORTS !!!
Additionally it creates excel file with latest news in your datafolder-> ".../MQL5/Files" , (* so this data can be used if you want to use news in EA , just load data from this file

SaTo EA HeiMA was EA for GOLD Period : M5, M15 only Initial balance : 100 USD with GOLD (micro or cent account can use) Base Signal : Heiken-ahi and 2 moving average (Fast and Slow line) and special indicator Moving average indicator : Allowed modify Stop loss type : Constant points, ATR indicator Trailing stop function : Yes Martingale function : Yes Money management type : constant lot and Risk per balance
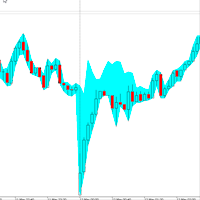
Александр Сергеевич Рыжков, [12.05.2022 7:02] SWI - Spread Widening Indicator.
Индикатор расширения спреда - должен быть в арсенале каждого опытного пользователя платформы Meta Trader.
Данный индикатор позволяет анализировать, аномальные ночные и новостные расширения спредов,
с помощью чего дополнительно максимизировать свою прибыль и снизить свои риски.
Для использования необходимо просто установить на график и подобрать цвет подходящий под ваш график.

Do you, like me, like to trade with the trend? Then this indicator will help you! Rainbow Trend is a trend indicator, which uses several Moving Averages on the chart.
It measures different trend strenght zones for different periods: very long term, long term, mid term, short term and very short term.
Each zone has its color, and it is possible to have sound alert when the prices leaves a zone and enters another.
Its configuration is very simple. If you find any bug or have any suggestions, co
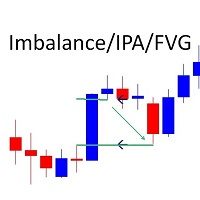
Marks Market Imbalance / Improper Price Action / Fair Value Gaps on The Chart As traders continue to search for the best trading indicators to guide their investments, the I mbalance / I mproper P rice A ction / F air V alue G ap I ndicator has become increasingly popular. This indicator helps to identify opportunities for taking profit . The indicator begins by scanning the markets for imbalance-improper price action events, allowing traders to immediately see when markets are not functioning
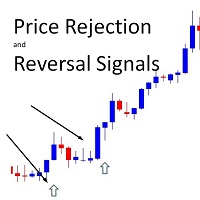
!! FLASH SALE !! Over 80% off !! For ONE week only. Now only $47 - normally $297! >>> Ends on 30 June 2023 - Don't miss it!
Buy And Sell Signal Arrows On The Chart When The Price Is About To Reverse. Also Sends Alerts –On MT5 To Your Phone To Your Email.
Does not repaint.
Works on any pair, any timeframe. (Just ajust the settings for your pair and timeframe.)
10 Activations allowed so you are free from limitations
MT4 version here .
Spreads from 0.1pip RAW/ECN Acco

Supertrend indicator uses a combination of a moving average and average true range to detect the trend of a trading instrument.
Supertrend indicator for MetaTrader 5 easily shows the trend as a line following the price.
You can use the second my indicator: You will see 3 supertrends and EMA 200 lines on the screen.
Working with my product :
https://www.mql5.com/en/market/product/80692

Volume Profile Indicator used by professional Traders at Traders Inside Ltd. If you want to succeed in trading you need to know if current price is cheap, expensive or fair valued. Key features: Fair price (Point of control, POC), high and low price zones (POH, POL) POC in different timeframes for better orientation Symbol and timeframe Chart resize on open positions/orders, VPRmax/min Historic POC - see, how POC has changed the last periods Button to show/hide VPR
Calculated Bars (best results
MetaTrader Market - robots comerciales e indicadores técnicos para los trádres, disponibles directamente en el terminal.
El sistema de pago MQL5.community ha sido desarrollado para los Servicios de la plataforma MetaTrader y está disponible automáticamente para todos los usuarios registrados en el sitio web MQL5.com. Puede depositar y retirar el dinero a través de WebMoney, PayPal y tarjetas bancarias.
Está perdiendo oportunidades comerciales:
- Aplicaciones de trading gratuitas
- 8 000+ señales para copiar
- Noticias económicas para analizar los mercados financieros
Registro
Entrada
Si no tiene cuenta de usuario, regístrese
Para iniciar sesión y usar el sitio web MQL5.com es necesario permitir el uso de Сookies.
Por favor, active este ajuste en su navegador, de lo contrario, no podrá iniciar sesión.