Robots comerciales e indicadores para MetaTrader 5 - 79

Export the news calendar from MT5 for precise EA backtesting
Harness the power of automated trading and optimise your Expert Advisors (EAs) with our latest tool: the MT5 News Calendar Exporter. This innovative programme has been specifically designed to export the news calendar directly from MetaTrader 5 (MT5) and save it in an easily accessible file. For programmers and traders who want to rigorously backtest their EAs, this is an indispensable tool.
With the MT5 News Calendar Exporter you
FREE
Script for quick updates (synchronization) up-to-date data in the SQLite database. Saves open positions and orders, current quotes.
Take advantage of SQLite's capabilities for intermediate data storage, analytics, and integrations of the MetaTrader platform. Keep all your data in one place.
Use the saved data in SQL analytical queries, from Python and other languages, to build dashboards
Parameters useDefaults true - use default parameters. Save data to the COMMON hierarchy, to the db/ram/{s
FREE
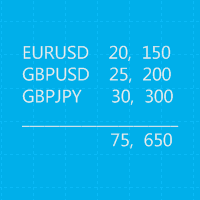
This is a MetaTrader 5 script. It helps to summarize all trades into every symbol.
Input Select Period: This is 7-option input. It includes Last Month, This Month, Last Week, This Week, Today, All History, and Date Specified. Specify Starting Date: Enter a date if you selected Date Specified in "Select Period" input. Specify Ending Date: Enter a date if you selected Date Specified in "Select Period" input. The summary is saved into a file in MQL5\Files folder. MT4 Version: https://www.mql5.co
FREE
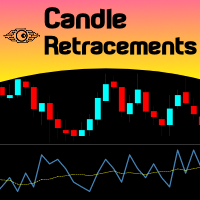
Do you want to know how much, how frequent and at what level a candlestick retraces over the previous one, just drop Candles Retracement over your chart and see it visually! Just choose your desired timeframe and the indicator will show it graphically. As simple as that... In addition you have the option to calibrate a Moving Average over this sub-window chart monitor. This indicator could be used to study candle retracements levels so you can comfortably expect during a trade what to expect fro
FREE
Aydmaxx Trade Tracker Description: Aydmaxx Trade Tracker is a powerful and user-friendly tool for traders, allowing you to monitor the current profit or loss for each trade in real-time. The indicator displays the information directly on the screen, helping traders quickly assess the results of their trading operations. Key Features: Displays the current profit or loss for all open positions in real-time. Customizable corner of the screen for displaying information (default is the bottom right c
FREE

TrendFollowing is an multi-currency scanner that just indicates where to buy/sell: Abilities: Opens up the chart automatically with and arrow indicating where to take action. Send the signal to a telegram channel, see @fx_signal_com channel to get the idea. Configuration: No need to configure "Market Watch". Open a chart and attach the scanner to it. Trading Rules: Use only buystop/sellstop orders above/below arrow on the chart. Delete the pending order if price retraces below/above the moving
FREE

TCP - Trader Control Panel is an extension to build into MetaTrader 5 manual methods to control open positions. It adds opening and closing position feature as well as user-friendly monitoring dashboard, money and risk management when opening. Opening and closing positions are done by mouse by interactively placing stop loss line on appropriate level or by pressing predefined keys on keyboard. Before opening a new position, the EA calculates such lot size, which will guarantee you no more losses
FREE

This demo EA only sends text messages to a predefined Telegram channel ( there is no need to configure telegram ). The messages can be customized to show information about the trading activity. Also it shows the daily account PnL. Several instances of this EA can be used simultaneously from the same MT5 terminal but ensure that each one has different EA ID number (setting B16).
I have tested this EA with forex symbols but it should work fine with any MT5 symbol (e.g. indexes, commodities, stoc
FREE

This Tradepanel is an Utility for Traders Who want ot use Basic MoneyManagement for Calculation of Lotsize I have created the basic edition only to give an Overview with Limited Functionality Full Features are available with Auto TradePanel Pro. (This is Only Because it can not be Tested in Strategy Tester ). Complete Description is available at "Auto TradePanel Pro". in This Version Basic Functionality ( Calculation of Lotsize ) open /close Positions is working in the same way as in Pro
FREE

Utility for know all informations and settings of all symbols available on your broker The informations that you can know are for example:
- Spread
- Digits
- Tick value
- Size step
- Size minimum
- Size maximum
- Swap buy and sell
- Margin required (for 1 standard lot)
- Rollover day
- Execution mode
and many other informations You can filter the symbols by group or you can also choose to see the informations only of symbols available on market watch.
FREE

This Utility tells you the volatility of any symbol for any of the major time frames. As trades occur, the volume increases for each period. When each period ends, the bucket is reset to 0. Volumes are sorted from largest to smallest within each shown period. Click any symbol to highlight that symbol in all period columns. Volume information is specific to transactions placed at your broker. To test in the Tester, set the following:
EURUSD,M1,1 minute OHLC 2018.01.01 to 2018.01.02 (a day’s worth
FREE

It is is your personal risk guard. Drop it on any chart on your VPS or trading computer and it will guard your total risk in any pair or asset and make sure the sum of all stops is within your risk. If you happened to exceed the risk, in a split second this EA will calculate the exact position for the combined risk of all open positions and place all stops at the exact same spot. If you open a new position with another lot size . No problem, all stoplosses will automatically adjust. Tired of man
FREE

This is an arbitrage indicator. The indicator displays the chart of an arbitrary combination of trading instruments, described by the entered arithmetic formula. Using the indicator. Add an indicator to any chart. Enter the formula as a string in the indicator's parameters. All symbols used in the formula must exactly match the names in the table "Market Overview" of the terminal. Example of the formula: (SIBN + SNGS) / 'RTS-3.19' + 2.5 * GAZP / LKOH Start the indicator The formula must meet the
FREE
Trade Dragon Pro Demo Demo version which only works on EURUSD. Get the full version here! https://www.mql5.com/en/market/product/71913
An expert trade utility perfect for intraday, mid-term and long-term trading. Trade Dragon Pro generates stop-loss and take-profit levels for you based on the previous Tokyo-Sydney session.
In-built risk management Configurable number of entries On-the-fly risk and SL and TP adjustment (TP is based on SL) In-built trade manager for auto break-evens and traili
FREE

Are you tired of creating each course notification individually ?
Simply let yourself be permanently notified of the current location of the course. Just set a value once, and the system will subsequently notify you via your smartphone. The system will provide you with the current course, the distance from the set course, and the set course itself. This way, you'll always stay informed without needing to constantly check the market or create manual notifications. Furthermore, the system provide
FREE
This utility keeps a watchful eye on your trading terminals and ensures that you are notified if any of them are disconnected. Simply attach the utility to a chart and connect to a monitoring service who can notify you.
We use UptimeRobot for both VPS and terminal monitoring; however, any service supporting heartbeat monitoring can be employed.
Many such services offer free plans and various notification methods, such as Cronitor.io
FREE
MT5用 サブウィンドウにスプレッドとBUY SWAP(BS)とSELL SWAP(SS)を表示するインジケーターです。
表示の文字フォントの大きさと色の設定、スプレッドの表示をPIPS表示もしくはPOINTS表示切替が可能ですので、チャートの色設定などに合わせて、お好みでご利用いただけます。 サブウィンドウの表示サイズに合わせて、その中央に表示するようになっています。
(ご協力お願いします!) こちらは無料でご利用いただけます。どうぞご自由にご利用ください。 もしよければ MS High Low indicator も紹介していますので、どうぞご参照の上、DEMO版のダウンロードをお試しください!
Happy Trading :)
FREE

Change lot size, set TP / SL points and with one click place an order. Track current order count and total running profit. Instant Close all Buy trades, Close all Sell trades or Close All open trades buttons. Trailing SL feature Support for Manual orders. Utility types Risk management, Graphical objects, Panels. Main features
Take Profit and Stop Loss in points (10pip = 100 points) After the price reaches the Take Profit threshold, orders will be closed in profit After the price reaches the St
FREE

The script allows selecting the required 'Filter level' value of the AIS-MTF MT5 indicator. Run the script on the required chart and selected timeframe. Once its operation is complete, the HPS.csv file will be created in the Files folder. Open the file. You will see three columns. The 'Filter lvl' column represents the value of the 'Filter level' for the AIS-MTF indicator. Am. dev. - degree and direction of the indicator's deviation from the price level (sorted in ascending order). Negative valu
FREE

Product Description: Adaptive Y-Axis Scaling is a powerful MT5 indicator designed to enhance your trading experience by providing precise control over the Y-axis (price) scaling of your charts. This innovative tool allows you to customize the price scaling by specifying the number of pips from the visible chart's highs and lows. The calculated price range from this input is then used to set the maximum and minimum prices for the open chart, ensuring an optimized and comprehensive view of market
FREE
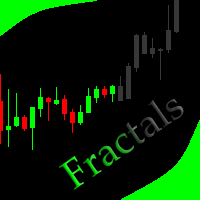
This indicator allows to hide Bill Williams Fractals (on all MT5 timeframes) from a date define by the user with a vertical line (Alone) or a panel (with "Hidden Candles"). Indicator Inputs: Indicator Color Indicator Width Information on "Fractals" indicator is available here: https://www.metatrader4.com/en/trading-platform/help/analytics/tech_indicators/fractals ************************************************************* Hey traders!! Give me your feeds! We are a community here and we ha
FREE

This trading bot is designed for MetaTrader 5 (MT5) to manage open positions effectively by automating partial closures based on a predefined risk-reward ratio. It includes Telegram integration to send notifications directly to your group or channel about trading activities, including entry, stop-loss, and take-profit levels. Key Features : Partial Close Management : Automatically closes a percentage of the trade volume when the target level is reached. Risk-Reward Calculation : Sets profit leve
FREE

This indicator shows the value of returns in the selected time frame
They are calculated as logarithm of returns , rather than price or raw returns. For small returns, arithmetic and logarithmic returns will be similar. The benefit of using returns, versus prices, is normalization. It is possible measures all variables in a comparable metric despite originating from price series of unequal values
Inputs You can display data both as a Histogram or a Line It's also possible to display the a
FREE

3 Moving averages crossover , with customizable Notifications and pop ups. Comment for any ideas. Its a demo version , could use some work, hope you at least find it useful. Hit me up with anything or any ideas you feel might be helpful and i will try and add them in if i get the time. Thank you. This version is free as of now . I can't promise anything about the future. But enjoy and have fun. Truly PVRPLE BLVCK. PS don't forget to share and like.
FREE

Script to configure "TweetHelper for MT5" environment settings for "Twitter API v2 OAuth 2.0 with PKCE".
Client ID : ${CLIENT_ID} Auth Basic base64 : β string(Base64) Response Code : auth_code to be obtained in step 2 of "Connection Procedure Using OAuth2.0" Callback URI : the value set in User authentication settings "Callback URI / Redirect URL"
TweetHelper trial for MT5 https://www.mql5.com/ja/market/product/54832
TweetHelper for MT5
https://www.mql5.com/ja/market/produ
FREE
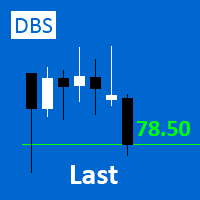
A small utility displays the value of the last price (Last) to the right of the chart. The Last price is the price at which the last deal was executed. Utility is convenient to use for screens with small print, for visual observation of the price level (value) or for people with poor eyesight. You can customize: Growth color Fall color Text font Font size Offset text
FREE
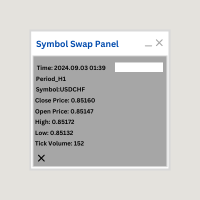
Symbol Swap Panel: Effortlessly switch the active symbol on your chart while simultaneously adding the new symbol to Market Watch. This tool ensures seamless integration and access to real-time market data, optimizing your trading workflow.
Description:
The "Symbol Swap Panel" is a versatile utility designed for traders seeking to manage their chart symbols and Market Watch more efficiently. This tool allows you to easily swap the current symbol on your chart while automatically adding the se
FREE

Script to create arrows and lines on chart of history positions traded on account for the symbol where you launch the application. From inputs you can select: - Magic number (default is -1; -1 = all magics number) - "From" date and time (default is 1970.01.01 00:00; all positions) - "To" date and time (default is 1970.01.01 00:00; all positions) - Color for buy open positions (arrows and lines between open and close) - Color for buy closing positions (arrows) - Color for sell open positions
FREE

Down load all the historic ticks data from a pair. Just load the EA to a graph, give it time to download all the data ticks and wait for the messages to appear as downloaded in the terminal. Once its downloaded, the data will appear in MQL5/Files folder as "ticks_data_XXXX.csv". where XXXX is the symbol from whom you just downloaded the data. You can use this data as input for a python file for ONNX or what ever you want or need. For big pairs, the data is Gb big.
FREE

Manual Trading Panel is a simple, efficient and intuitive graphic tool that provides a controls to open, close and manage all your orders in MetaTrader 5. It is very useful in case you have to interact with other EA adding another position or delete all positions in a specific direction or all of themes. This EA can not be tested on strategy tester. In case of usage please try its functions on demo account before running on live trading. Functions presented to this version: Interacts only with p
FREE

Quickly clear all open charts in MetaTrader 5 with a single script execution. Ideal for traders who want to reset their workspace before starting a new trading session or analysis. Implementation Notes: This script is designed to operate under strict coding standards ( #property strict ) to ensure reliability and efficiency. No user inputs are required, as it automatically processes all open charts.
FREE
ImpulseShield EA is here to say NO to trading decisions made on Impulse
Have you ever placed a trade based on an impulsive decision and regretted your action? What if you could have been able to avoid taking the trade? ImpulseShield is here to help you to only when it is right. The Free Version Only Supports EURUSD, GBPUSD and USDJPY, Here is the Full Version, Just $30 https://www.mql5.com/en/market/product/131519 Key Settings and Their Role
The EA uses the inputs defined earlier to determine
FREE

Este script está diseñado para traders que necesitan ejecutar operaciones rápidas en múltiples pares de divisas durante anuncios económicos clave, donde cada segundo cuenta. Con esta herramienta, puedes preseleccionar los pares de divisas que deseas y asignar un volumen independiente para cada uno. Cuando se publica una noticia importante, como los datos de Nóminas No Agrícolas (NFP) o PMI, el script te permite ejecutar todas tus operaciones de manera instantánea, sin tener que abrir cada par ma
FREE

The indicator has only one parameter - the number of bars for analysis. The indicator calculates statistics for when the market was moving down, when it was moving up, and the number of bars for each movement. From this data, the average number of bars is calculated, which is displayed in the indicator window. If the indicator values sharply decrease, then the market is preparing for an upward movement. If the indicator values persist at high levels for an extended period, then the market is pre
FREE

The script analyzes all trading instruments listed in the Market Watch of the MT5 platform to assess their suitability for trading on the timeframes specified in the settings. Based on the analysis, the script displays a table, where trading instruments deemed suitable and recommended for trading are marked in green, based on their compliance with the risk-to-reward ratio coefficient, including the spread (default 1:3). Instruments not recommended for trading are marked in red.
FREE

The CloseByPercentLossOrProfit Expert Advisor closes all positions as the total profit of loss for the entire account reaches a specified value. The profit or loss is specified as percentage of the account balance. In addition, the Expert Advisor can delete pending orders. Allow AutoTrading before running the Expert Advisor. Instructions: Run the Expert Advisor on the chart. Input parameters: Language of messages displayed (EN, RU, DE, FR, ES) - the language of output messages (English, Russian,
FREE

This is a multi-symbol and multi-time frame, fully customizable alert based on a stochastic oscillator (SO) and moving average (used for trend confirmation) calculations. This tool returns most recent buy/sell signal from user-defined time periods on the fly! Alert action can be performed for a specified trade type: "buy", "sell" or "buy or sell" on your wish. Unlike of many alerts, this is a "map" of conditions which gives you full information of indicator positions without opening and searchin
FREE

Eliminar Todos los Stops y Takes en el Símbolo Actual ¡Una herramienta rápida y eficiente para eliminar todos los niveles de Stop Loss y Take Profit de las posiciones en el símbolo seleccionado! Olvídate del trabajo manual: este script lo hace todo en cuestión de segundos. Ventajas: Gestión específica: Elimina los SL/TP solo del símbolo actual sin afectar otros activos. Esto es especialmente útil para traders con múltiples posiciones abiertas. Rápido y conveniente: Con un solo clic, elimina tod
FREE

Introducing our cutting-edge Trade Copier Expert Advisor for MetaTrader 5 (MT5) – the ultimate solution for seamless trade replication across multiple accounts on the same server or computer. Elevate your trading experience and take control of your investment strategy like never before with our professional-grade Trade Copier. Key Features: Effortless Trade Replication: Our Trade Copier effortlessly duplicates trades from a master account to multiple slave accounts, ensuring that you never miss
FREE

This is a tool to estimate your probability of bankruptcy. features. estimate a probability of bankruptcy (Nauzer J. Balsara) from your trade history usually, it is small print and never interfere with trades alert in large prints and color when it exceed the alert level you can set parameters(i.e. winning ratio) fixed and simulate freely *1: this value is for reference only and is not guaranteed to occur.
FREE

IAMFX offers the ultimate solution to make trading easier and more flexible on IAMFX Web using IAMFX Agent .
With our exclusive IAMFX-Agent and IAMFX-Center, you can effortlessly manage your trading anytime, anywhere through web and mobile interfaces. Fully compatible with both web and mobile environments, IAMFX allows real-time multi-account management and monitoring with a simple installation. IAMFX Benefits Manage multiple MT5 accounts Easy orders with market, stop and limited Manage orde
FREE

Bienvenidos de nuevo! Código del -25% de descuento en Darwinex Zero: DWZ2328770MGM Hoy queremos presentar una nueva herramienta útil, HiperCube SuperVisor, esta herramienta solucionó el problema que teníamos cuando teníamos que ejecutar diferentes EAs al mismo tiempo, haciendo la supervisión de algo que es difícil de hacer, gracias a esto podemos ver en 1 gráfico hasta 5 EAs al mismo tiempo, podemos ver cada uno de ellos tiene posiciones abiertas, ganancias en compra, ganancias en venta y ganan
FREE
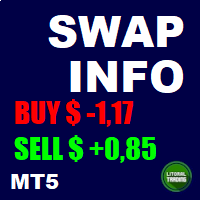
This is a script based tool that informs the swap from all the currency pairs (gold and silver too). It is possible to highlight pairs with a specific currency and whether the swap is positive or negative. In addition it is possible to complement the name of the symbols depending on the broker. The informations are showed in the Experts tab of the Toolbox (Ctrl+T). If you have any doubt or suggestion, please, contact us. Enjoy!
FREE

NS Financas Clear All Objects Automatically Script for quick removal of all objects from your chart (lines, shapes, symbols, etc ...) Don't waste any more time trying to find all the objects on your screen for removal. Use this script and in one click all objects will be removed from the chart automatically. Also, it is possible to configure hotkeys to make the script even faster in its use. NS Financas Clear All Objects Automatically does not remove indicators. Take the opportunity to visit our
FREE

This indicator idea comes from Tushar Chande called Qstick.
Technical indicators quantify trend direction and strength in different ways.
One way is to use the difference between close and open for each bar and to sum it up over a period of time.
The formual is:
Qstick (period ) = Average ((close-open ), period )
In this indicator, we can choose how to calculate body by two famous chart types. The first and default indicator settings are based on Heiken Ashi chart, and the second is based
FREE

Скрипт для быстрого закрытия рыночных и отложенных ордеров. Этот зацикленный скрипт гарантированно закроет все выбранные ордера. Он будет работать, пока не закроет все выбранные позиции и удалится когда сделает свою работу. Если у Вас много открытых позиций этот скрипт поможет вам. Интуитивно понятный интерфейс 1) Просто бросьте его на график. 2) Выберите ордера, которые надо закрыть. По умолчанию выбраны все! 3) нажмите кнопку "Close". Если вы забыли включить Авто торговлю, будет выдано сообщен
FREE
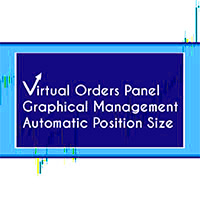
Note: Demo version only works on NZDJPY and USDRUB
What does it do? It assists you in your trading and has some important jobs to perform: It sets virtual pending orders, stop loss and take profit. It can set real stop loss and take profit if desired. It makes trading independent of bid-ask line concept, thus useful for very short term traders and price action traders. Orders can be opened, managed and closed with 1 click providing fastest management. It can automatically set your position sizi
FREE

Get your hands on Immutable Trader and start making money in the markets with ease! Our innovative EA is powered by a smart algorithm that detects trends, filters out market noise, and places orders with pinpoint accuracy. You'll never have to worry about capital security again with our built-in Stop-Loss feature. And with 5 powerful indicators at your disposal - Directional Indicators, Stochastic, RSI, ADX and Bollinger Bands - you'll be able to confidently trade in any market condition. Get Im
FREE

//////////////////////////////////////////////// //////////////////////////////////
An improved version of the standard Average True Range indicator.
It is now a responsive and smoothed line.
The setup is not straightforward - but I hope you can do it. It is very easy to understand the readings of this indicator, the meaning is the same as that of the standard Average True Range.
//////////////////////////////////////////////// ///////////////////////////////////
I hope this indicator will
FREE
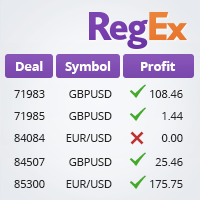
The TradeHistoryParsing is a utility for working with the trade history obtained from the MetaTrader 5 terminal. The product is based on the " RegularExpressions in MQL5 " library. It allows to quickly get the required data on your trading history. The filtering results are displayed as a table, a summary of mathematical statistics is provided below the table.
Working with the tool Export the trade report as an html file and place it into the "sandbox". After that, when launching the EA, specif
FREE

"Statistics by magic pro" is a program that provides statistics after entering a magic number. You can simultaneously track up to 10 statistics for different magic numbers in one chart window. The program is very easy to use. The program should be run on any free chart. In the EDIT field on the chart, you should enter the magic number. Entering "0" will erase the statistics in that window. The operation of the program can be stopped by selecting the statistics off option. After selecting it, the
FREE

A simple indicator/tool to display the current timeframe in the center of the chart. The object is automatically moved to the center of the chart whenever the chart size is changed by the user.
Input Parameters :
Font (default is Arial Black) Font Size (default is 50) Font Color (default is Silver, for light theme graphics, change to black or another dark color) Font Transparency (default is 90%)
FREE
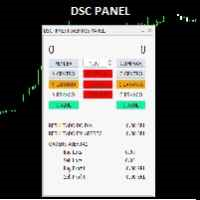
o DSC Panel é um auxiliar para deixar ordens já posicionadas em pontos estratégicos no gráfico de maneira automática. Em conjunto com o indicador DSC Vwap Channel e DSC Candle Agression é uma poderosa ferramenta para o trader obter uma excelente assertividade em suas operações. VEJA OS NOSSOS RESULTADOS OPERANDO MINI INDICE NO INSTAGRAM: https://www.instagram.com/diogo.cansi/ GRUPO DO TELEGRAM = https://t.me/robosdsc Maiores informa çõ es pelo email dscinvestimentos@gmail.com Ou pelo
FREE

Ofir Blue exporter is a handy utility to export your orders history to a JSON file . You'll need it if you want to back-test Ofir blue or Ofir Hedging , using your own trading history. How it works: Install the indicator on a chart Press export all or export <current symbol> (for example GBPUSD) The indicator will create the json file in the directory files/ofirblue/export. This directory is in the common file area. The file will be automatically taken in charge by Ofir blue strategy tester
FREE
This indicator allows to hide moving average (on all MT4 timeframes) from a date define by the user with a vertical line (Alone) or a panel (with "Hidden Candles"). Indicator Inputs: MA Period MA Shift MA Method MA Apply To Information on "Moving Average" indicator is available here: https://www.metatrader4.com/en/trading-platform/help/analytics/tech_indicators/moving_average ************************************************************* Hey traders!! Give me your feeds! We are a community h
FREE

TradeNavigator AccountPilot v1.1 – Tu gestor de cuentas para MT5 Identifica al instante con qué cuenta estás operando – usa nombres personalizados en lugar de números confusos!
Evita errores costosos viendo claramente la cuenta activa en el gráfico!
Ideal para traders con múltiples brokers y cuentas – ¡nunca más confusión! Beneficio principal: ¡Nunca más operar en la cuenta equivocada! ¿Tienes varias cuentas con diferentes brokers y cada una tiene un número largo y complicado ? ¿Ab
FREE

ATR Monitor ATR is a measure of volatility introduced by market technician J. Welles Wilder Jr. in his book, "New Concepts in Technical Trading Systems". In general, traders are accustomed to seeing the ATR in the form of a sub-window indicator. What I am presenting here is a simplified version of ATR - just the current ATR number - very useful for monitoring just the very moment of the current chart. And, by default, this indicator will not show up on screen, you can just use the buffers thems
FREE

MetaTrader to Discord (MT2DC) This tool allow you to post automatically to your Discord announcement channel You can create more engaging community by using this tool.. Easy Setup just using your existing Discord Account.
To Setup, simply go to app.mt2dc.com and register with your existing Discord ID Webhook URL you can set in your discord using Integrations setting
FREE

My Trading History is a very useful tool for traders to know in which currency pairs, metals, indices, crypto currencies are good for trading , because this tool get all orders that made by you or EA's and organize them by symbols and tell you number of orders that you or EAs made per each symbol and show Portfolio for each symbol
You can customize the dashboard and the dashboard location on the chart as you like.
FREE
Helper utility that does the following important actions: Shows or hides various groups of symbols - Forex, CFD, Futurex, Bonds and all others. Shows or hides symbols that have or do not have trade restrictions. Shows or hides symbols that currently have a trading/quoting session active. Shows or hides symbols that contain the specified words in their names. Closes or deleted all market or pending orders. Closes orders by type - Buy/Sell. Clears stop loss and take profit values. Downloads histor
FREE

For those who use the Trading Arrows on the chart for later study, but use the Triple Screen approach and got all those arrows everywhere on all additional charts, here it is: Arrows Cleaner! Just drop it on the chart and leave it there. When needed, just with 1-click you get rid of all those annoying arrows...
SETTINGS You can position the little Button on any corner of the chart. Additionally you can displace it with the Offset settings. You can enlarge or shrink its size, as well as the text
FREE

Sometimes swaps are hidden for certain financial instruments , hence incurring unprecedented costs over night. The need to uncover hidden swap costs is vital for profitable trading. With that being said, this expert indicator helps the trader to uncover the hidden swap costs.
Features chart objects with text short and long trade swap plug and play
Advantages uncover hidden swaps plug and play, no other configurations are needed to use it. usable on all charts and symbols swaps can be easily s
FREE

Eliminar Todos los Stop Loss y Take Profit — Una solución sencilla para eliminar niveles de SL/TP al instante ¡Elimina todos los niveles de Stop Loss y Take Profit con un solo clic! Eliminar Todos los Stop Loss y Take Profit es un script práctico diseñado para traders que desean eliminar rápida y eficientemente los niveles de SL y TP en todas sus posiciones abiertas. Su operación simple y ejecución instantánea lo convierten en una herramienta indispensable para condiciones de mercado dinámicas.
FREE

Obtén tu EA de Utilidad gratis que mostrará los resultados de posiciones cerradas en tu gráfico. Una pequeña función divertida que hace feliz a cualquier trader. El EA no abrirá ni gestionará posiciones, solo mostrará resultados históricos en el gráfico. Elige color y tamaño. Por favor, deja una reseña de 5 estrellas si te gustó esta herramienta gratuita. Asegúrate de echar un vistazo a mis EAs de trading: EA Bull Scalper EA Bear Scalper O consigue ambos para un rendimiento óptimo.
FREE

Display the date, time and price according to the movement of the mouse cursor on the chart This is useful for discretionary trading.
It is an indispensable tool for verifying and studying past market prices and trades. Characteristic Date,Time and Price are displayed.
The value follows the movement of the mouse.
You can change the color of the text. Please refer to the video on youtube. For MT5 only.
FREE

This utility is the demo version of the Binance Full Trader. This version is provided so the customers can test performance and options of the main version. · This version has these restrictions: 1. Only BTCUSDT is available for price chart and Test Mode. 2. The Real Mode is not accessible. 3. The LIMIT and STOPLOSSLIMIT are not accessible. 4. The Indicator mode is not accessible. · The full version and the instruction of use can be downloadable from t
FREE

A script for quick reversing positions and/or orders. If you need to reverse a position with the same volume, open an opposite position of a different volume, this script will save you from routine! Allow AutoTrading before running the script. Instructions: Run the script on the chart. This script is a limited version of the market product https://www.mql5.com/en/market/product/638 and allows reversing only positions. Input parameters are not required. Parameters such as changing the type of exi
FREE

Hi you, I need your help! Be my Patron, let's make it possible!
https://www.patreon.com/joaopeuko https://github.com/Joaopeuko/Mql5-Python-Integration
Esse Expert Advisor copia os dados("symbol,last,bid,ask") dos ativos que foram colocados na lista e só funciona enquanto o mercado esta aberto.
Esse EA não é um link DDE ou RTD, as informações não são passadas em tempo real ao excel. O EA tem um delay de 30 segundos e o Excel tem um delay de 1 minuto.
A vantagem desse EA é que ele dispensa o
FREE

Este indicador apresenta 7 médias configuráveis, que podem facilmente ser utilizadas em robôs ou em operações manuais.
Facilita a identificação de tendências e reversões. Seus buffers estão ordenados e são facilmente identificáveis para utilizar em robôs. Liberado para uso em operações manuais ou automatizadas.
Em breve vamos postar um robô que utiliza estas médias como parâmetro de negociação.
FREE
Clean all symbols from a chart to get a better view. We all love to draw a chart, but it's hard to get the unwanted objects away that we don't need anymore. With this script, you simply remove ONLY SYMBOLS. All others will stay on the chart. In my eyes, a must-have tool in case you need to clean quick up to continue observations or strategy finding. Just pull it onto the chart.
KEEP IT GROWING! Happy Trading
FREE
MetaTrader Market ofrece a todos los desarrollador de programas de trading una sencilla y cómoda plataforma para ponerlos a la venta.
Le ayudaremos con la presentación y explicaremos cómo preparar la descripción de su producto para el Market. Todos los programas que se venden a través del Market están protegidos por una codificación adicional y pueden ser iniciados sólo en el ordenador del comprador. La copia ilegal es imposible.
Está perdiendo oportunidades comerciales:
- Aplicaciones de trading gratuitas
- 8 000+ señales para copiar
- Noticias económicas para analizar los mercados financieros
Registro
Entrada
Si no tiene cuenta de usuario, regístrese
Para iniciar sesión y usar el sitio web MQL5.com es necesario permitir el uso de Сookies.
Por favor, active este ajuste en su navegador, de lo contrario, no podrá iniciar sesión.