Robots comerciales e indicadores para MetaTrader 5 - 179

Ermou Street rather than an expert or an indicator is a all-in-one trading assistant easing your trading sessions by providing signals and notifications. It's an assistant rather than a robot - "an assisted steering rather than an autopilot", and now, it autoadjusts itself to any instrument, any timeframe & any circumstance.
How to First, you should watch the video. Then here's some explanation: By default, attaching Ermou Street to a chart, you’ll get: A panel Signals: buy (default blue arrow

Purpose and functions of the indicator The indicator determines and marks the moments of trend change on the chart based on the theory of fractal levels breakout on any of the analyzed timeframes. If a breakout based on all rules is valid, a horizontal line with corresponding color will appear on the chart. If there is an uptrend, the line will be blue. In the descending trend, the line will be red. The blue line is a strong support level, the trader should look for buying opportunities above th

This indicator is designed for M1 time frame and shows 2 lines: Sum of Points when the price goes up divided on Sum of Ticks when the price goes up (Aqua color). Sum of Points when the price goes down divided on Sum of Ticks when the price goes down (Orange color). You will see all major data as a comment in the left upper corner of the chart. Keep in mind that Sum of Points will be greater or equal to Sum of Ticks. Of course, the ATT is calculating all ticks forward only, beginning from the tim

This indicator is based on the classical indicators: RSI (Relative Strangth Index) and CCI (Commodity Channel Index) and will be helpful for those who love and know how to use not a visual but digital representation of the indicators. The indicator shows values from each timeframe. You will be able to change the main input parameters for each RSI and CCI for every TF. Parameters OverboughtLevel_R = 70; OversoldLevel_R = 30; OverboughtLevel_C = 100; OversoldLevel_C = -100; Example for M1: sTF1 =

The VWAP indicator is our version of the popular Volume-Weighted Average Price indicator. The VWAP is the ratio between the value traded (price multiplied by the number of volume traded) and the total volume traded over a specific time period. As a result, it measures the average price of the instrument much better than the simple moving average. Although there are many ways to use the VWAP, most investors use it to calculate the daily average.
The indicator works in five modes: Moving - In

HiLo Activator v1.02 by xCalper The HiLo Activator is similar to moving average of previous highs and lows. It is a trend-following indicator used to display market’s direction of movement. The indicator is responsible for entry signals and also helps determine stop-loss levels. The HiLo Activator was first introduced by Robert Krausz in the Feb. 1998 issue of Stocks & Commodities Magazine.
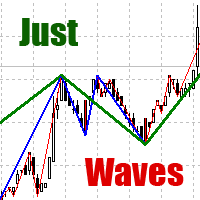
Among various methods of technical analysis of the Forex market, wave analysis is a fundamental one. Anyway, when it comes to the price change over a period of time, we are dealing with waves. According to Elliott's theory, waves are formed in a fractal way. On the same principle MT5 indicator Just Waves marks up waves of different levels (up to 8) and creates graphic lines indicating the beginning and ending points of the waves. Just Waves offers an objective criterion of a wave, thereby uncove

The Currency Barometer indicator is a unique tool that measures the strength of two currencies represented in the pair and compares the difference between them. The result is shown as a histogram where you can simply identify which currency is the strongest. This indicator is designed to measure the strengths and weaknesses of eight major currencies (USD, EUR, GBP, CHF, CAD, JPY, AUD, and NZD) and works on 28 currency pairs. The indicator uses the CI method (Commodity Channel Index) to calc

The Camarilla Pivots indicator is fully configurable and can be adjusted to work in different ways. If you are a manual trader and prefer a clean chart, you can configure the indicator so that it only draws camarilla pivot points for the current session. Otherwise if you are developing an expert advisor that uses pivot points, you can configure the indicator to show historical camarilla pivots as well. Another unique feature of this indicator is that, when calculating daily camarilla pivots, it

The Classic Pivot Points indicator is fully configurable and can be adjusted to work in different ways. If you are a manual trader and prefer a clean chart, you can configure the indicator so that it only draws pivot points for the current session. Otherwise if you are developing an expert advisor that uses pivot points, you can configure the indicator to show historical pivot points as well. Another unique feature of this indicator is that, when calculating daily pivots, it is possible to set a
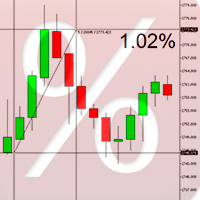
Percent Crosshair is a powerful and easy percentage measure tool. Measure the chart percentage very quick! Don't waste your time anymore! Just attach the Percent Crosshair indicator in the chart, select crosshair mode at toolbars or press "Ctrl+F" and start using the crosshair as you always do! The percent measure will be next to the indicative price. Customize your indicator the way you want! There are 4 entry parameters: Positive % color: set the desired color when % is positive. Negative % co

Knowledge of the strength and weakness of each currency is vital for every forex trader. Our Currency Strength Meter indicator measures the strength of eight major currencies (USD, EUR, GBP, CHF, JPY, CAD, AUD, NZD) by using the Relative Strength Index indicator, also known as RSI. The Currency Strength Meter indicator shows you, simply and quickly, when a currency is oversold, overbought, or in "normal area". This way, you can identify which currency is the strongest and the weakest.
Our

The ATR indicator is a helpful tool for measuring the range of bars. It quickly and easily helps evaluate the ATR's current spread (range), which is especially useful for VSA traders. The indicator for classifying the range of bars (candles) uses the moving average and its multiples. Accordingly, the area where the volume is located (relative to the moving average) is labeled as ultra-low, low, average, high, very high, or ultra-high. Our ATR indicator is rendered as a histogram. This indic

KL Visual Risk Manager Pro – the tool for traders for whom capital preservation is a top priority. Let me present my new revolutionary method of sending orders according to what you see on a chart, which is in full accordance with Risk Management. Sending orders without human errors, using an appropriate currency pair, without gambling a lot size and with SL and TP set on chart according your technical analysis and methodology - all these are made in four mouse clicks and in a matter of seconds.

The signal is generated using standard Gator indicator. Gator Oscillator is based on Alligator and shows the degree of convergence/divergence of its balance lines (smoothed Moving Average). The upper histogram is the absolute difference between the values of blue and red lines. The lower histogram is the absolute difference between the values of red and green lines with the 'minus' sign since the histogram moves downwards. The EA works with any Forex symbol. Optimization is performed for one wee

This is a professional robot based on the Parabolic SAR indicator set. The Expert Advisor is designed for the analysis of trending markets. On the "bull market" the indicator is below the prices, on the "bearish market" it is above the price. If the price crosses the Parabolic SAR lines, the indicator reverses, and its further values are located on the other side of the price. The EA correctly processes errors and works reliably in the market. It can work with the initial deposit of $100! It i

Este es un indicador MTF de niveles de soporte y resistencia basado en los extremos del indicador Advanced ZigZag Dynamic y / o Extended Fractals con etiquetas de precio (se puede deshabilitar). Se pueden seleccionar TF más altos para el modo MTF. De forma predeterminada, los niveles se generan en función de los puntos indicadores de ZigZag. Los puntos indicadores de fractales también se pueden usar junto con ZigZag o en su lugar. Para simplificar el uso y ahorrar tiempo de CPU, el cálcu

This indicator is based on the classical indicator RSI (Relative Strangth Index) and will be helpful for those who love and know how to use not a visual but digital representation of the indicator. All TimeFrames RSI MT5 indicator shows values from each timeframe. You will be able to change the main input parameters for each RSI for every TF. Example for M1: sTF1_____ - label (string) of M1 TF. Period1 - number of bars used for the indicator calculations. Price1 - price used. Can be any of the p
The Candle Length Indicator Alarm generates a sound alert, sends a push notification and an email when the size of the current candlestick changes. The size of the current candlestick can be measured in two ways: The first method: the size of the candlestick is measured from the beginning of the candlestick (from the OPEN price). The second method: the size of the candlestick is measured from current price. The indicator has the following settings: sound — a sound file from the folder: "...\Meta

BuyLimit_SellLimit_Grid script opens Buy Limit and Sell Limit pending orders. You just need to drop this script on the chart with a desired currency pair. Before placing all pending orders, the input window is opened allowing you to modify all input parameters: DeleteAllPending – if 'true', all pending orders are deleted. BuyLimit – if 'true', Buy Limit order is opened. SellLimit – if 'true', Sell Limit order is opened. InitLot – initial lot. LotCoeff – if 1, all pending orders have the same lot
Complete Pending Orders Grid System opens any combinations of Buy Stop, Sell Stop, Buy Limit and Sell Limit pending orders and closes all existing pending orders. You just need to drop this script on the chart of a desired currency pair. Before placing all pending orders, the input window is opened allowing you to modify all input parameters: DeleteAllPendings – if 'true', then all pending orders (for current currency) are deleted. BuyStop – if 'true', Buy Stop order is opened. SellStop – if 'tr

BuyStop_SellStop_Grid script opens BuyStop and SellStop pending orders and deletes all existing pending orders. You just need to drop this script on the chart with a desired currency pair. Before placing all pending orders, the input window is opened allowing you to modify all input parameters: DeleteAllPending - if TRUE, then all pending orders are deleted; BuyStop - if TRUE, BuyStop order is opened; SellDtop - if TRUE, SellStop order is opened; InitLot - initial lot; LotCoeff - if 1, all pen

This indicator is based on the classical indicator Parabolic SAR and will be helpful for those who love and know how to use not a visual, but digital representation of the indicator. All TimeFrames PSAR MT5 indicator shows values from each timeframe (M1, M5, M15, M30, H1, H4, D1, W1 and MN1). You will be able to change the main input parameters for each Stochastic from every TF. Example for M1: sTF1 = M1 pStep1 = 0.02 pMax1 = 0.2

This indicator is based on the classical STOCHASTIC indicator and will be helpful for those who love and know how to use not a visual, but digital representation of the indicator. All TimeFrames Stochastic MT4 indicator shows values from each timeframe (M1, M5, M15, M30, H1, H4, D1, W1 and MN1). You will be able to change the main input parameters for each Stochastic from every TF. Example for M1: sTF1_____ = M1 K_Period1 = 5 D_Period1 = 3 S_Period1 = 3 Method1 = MODE_EMA

This indicator is based on the classical indicator CCI (Commodity Channel Index) and will be helpful for those who love and know how to use not a visual but digital representation of the indicator. All TimeFrames CCI MT5 indicator shows values from each timeframe. You will be able to change the main input parameters for each CCI for every TF. Example for M1: sTF1_____ = "M1"; Period1 = 13; Price1 = PRICE_CLOSE.

The script allows to close all opened positions if Sum of Profit from all opened positions is greater than value of the input parameter: SumProfit .
Input parameters SumProfit = 100 You can change SumProfit to any positive value ( in dollars , not in the points!). This script will close all positions for a given currency pair only. Keep in mind that you have to " Allow automated trading " on the "Expert Advisors" tab (Tools->Options).

Many indicators are based on the classical indicator Moving Average . The indicator All_TF_MA shows crossing of 2 MA from each TimeFrames . You will be able to change main input parameters for each MA for every TF. Example for M1 TF: Period1_Fast = 5 Method1_Fast = MODE_EMA Price1_Fast = PRICE_CLOSE Period1_Slow = 21 Method1_Slow = MODE_SMA Price1_Slow = PRICE_TYPICAL

The Zig-Zag indicator is extremely useful for determining price trends, support and resistance areas, and classic chart patterns like head and shoulders, double bottoms and double tops. This indicator is a Multi Time Frame indicator. The indicator is automatically calculate the 3 next available TF and sows ZigZag from those TimeFrames. You cannot use this indicator for the TF greater than D1 (daily). You have to have ZigZag indicator in the Indicators/Examples tab.
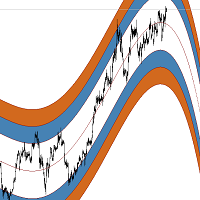
ExpertRegression is a professional trading robot, which implements the classic trading strategy inside a channel based on regression signal. The signal is formed at a breakthrough of the upper and lower limits of the regression range. If the price pierces the upper border of the regression and the price is fixed above this border, it is the signal for buying. If the price pierces the lower border of the regression and the price is fixed below this border, then it's the signal for selling. Can wo

This indicator calculates the next possible bar for each currency pair and timeframe. If the next possible Close will be greater than Open, the next possible bar will be in Aqua color. If the next possible Close will be less than Open, the next possible bar will be in Orange color. Of course, the next possible bar will not show the big price movement. This indicator is most useful in the quiet time.

The idea of enhancing the free Slider utility appeared after the release of a lite version of the EA trade panel Trading Chaos Expert Lite , which operates in the Current Chart mode without the possibility to maintain trades of several symbols in a single window. The purpose of Slider profy Ease search for trading signals by automatic display of charts of currency pairs from the "Market Watch" one by one at a specified interval of time in seconds. Automation of one-click placing of pending ord

De señal se genera en la dirección de Momentum. Juez controla correctamente errores, y funciona de forma fiable en el mercado. El capital de trabajo de $ 100! Además, la señal puede ser invertida. El experto ha construido progresiva optimización de la función de clasificación, que es deseable para optimizar, mediante el modo "Custom max".
Parámetros:
OnOptimizationSharp - cuando la optimización rezhyme "Custom max" es un koefitsient opcional Sharpe.
Período de Trabajo - el período para

This indicator is designed for M1 timeframe and shows: sum of ticks when the price goes up divided by sum of ticks when the price goes down (red color); sum of points when the price goes up divided by sum of points when the price goes down (green color). The correlation between the number of ticks and the number of points for each and every minute will give enough data for scalping.

News Trader Pro is a unique robot that allows you to trade the news by your predefined strategy. It loads every piece of news from several popular Forex websites. You can choose any news and preset the strategy to trade it, and then News Trader Pro will trade that news by selected strategy automatically when the news comes. News release gives opportunity to have pips since the price usually has big move at that time. Now, with this tool, trading news becomes easier, more flexible and more exciti

This is a utility created to ease charts watching on tablet PCs. The indicator allows you automatically alternately display "slide show" of all currency charts from "MarketWatch". The user can set the display time interval (in seconds) between charts in indicator settings. In addition, there is an option of selecting the angle of Start/Stop button which starts and stops the display of charts. This function is very useful if a trader noticed a trading signal and would like to study it in more det

Introduction to Harmonic Pattern Scenario Planner
The present state of Forex market can go through many different possible price paths to reach its future destination. Future is dynamic. Therefore, planning your trade with possible future scenario is an important step for your success. To meet such a powerful concept, we introduce the Harmonic Pattern Scenario Planner, the first predictive Harmonic Pattern Tool in the world among its kind.
Main Features Predicting future patterns for scenari
This indicator shows the ratio of the volume of buyers'/sellers' orders for the Russian FORTS futures market. Now, you can receive this information in real time in your МetaТrader 5 terminal. This allows you to develop brand new trading strategies or improve the existing ones. The data on the ratio of the volumes of orders is received from the database (text CSV or binary one at user's discretion). Thus, upon completion of a trading session and disabling the terminal (or PC), the data is saved a

This indicator shows the ratio of the number of buyers'/sellers' orders for the Russian FORTS futures market. Now, you can receive this information in real time in your МetaТrader 5 terminal. This allows you to develop brand new trading strategies or improve the existing ones. The data on the ratio of the orders number is received from the database (text CSV or binary one at user's discretion). Thus, upon completion of a trading session and disabling the terminal (or PC), the data is saved and u
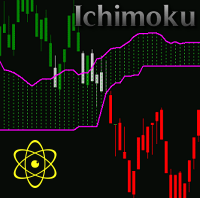
Robot Profesional, que implementa la estrategia de negociación clásico Indicador RobotIchimoku.
Señal se genera al cambiar la tendencia en Ichimoku. Para ello, vamos a analizar la intersección de la Tenkan-sen y Kijun-sen. Se genera señal de compra cuando el Tenkan-sen cruza Kijun-sen de abajo hacia arriba. De arriba hacia abajo es una señal para vender.
Juez controla correctamente errores, y funciona de forma fiable en el mercado. El capital de trabajo de $ 100! Es importante elegir una lín

News Loader Pro is a tool that automatically updates every economic news in real time with detailed information from several online data sources. It uses the unique technology to load data with full details from popular Forex websites. An alert will be sent to your mobile/email before an upcoming news release. Moreover, it also marks the news release points on the chart for further review and research. In Forex trading, news is one of the important factors that move the market. Sticking with ne

This is a professional trading robot, which implements the classical Envelopes based trading strategy. A signal is generated when prices rolls back from the boundaries of the Envelopes. If the price pierces or touches the upper border of the Envelopes channel and then returns back, it's the signal to sell. If the price pierces or touches the lower border of the Envelopes channel, it's the signal to buy. The EA correctly processes errors and works reliably in the market. It is important to choose
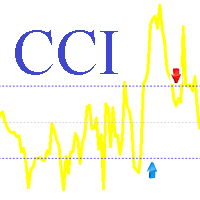
This is a professional trading robot, which implements the classical CCI based trading strategy. The signal is produced upon exiting of CCI from the overbought/oversold areas; the levels of those areas will be levels with the values of LevelMax and LevelMin . We buy, as CCI falls lower then level LevelMin and then rises above it. We sell, as CCI rises above level LevelMax and then falls below it. Also, the signal can be inverted. The EA correctly processes errors, and works reliably in the marke

The indicator determines and marks the short-term lows and highs of the market on the chart according to Larry Williams` book "Long-term secrets to short-term trading". "Any time there is a daily low with higher lows on both sides of it, that low will be a short-term low. We know this because a study of market action will show that prices descended in the low day, then failed to make a new low, and thus turned up, marking that ultimate low as a short-term point. A short-term market high is just
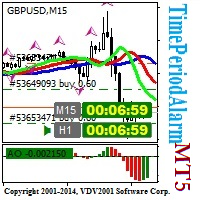
The TimePeriodAlarm indicator shows time till closure of a bar. If the 'Time period' is specified explicitly (i.e. not 'current'), the indicator displays the time till bar closure of the current period and the explicitly specified period. Ten seconds before the closure of the bar (at the period specified explicitly), a preliminary sound alert is played and a color alert is generated, then the main signal (can be set by the user) in the parameter 'Sound file(.wav)' is played. The sound file shoul

El indicador de mapa de calor Este indicador de mapa de calor le permite mostrar un "mapa de calor" de todos los símbolos seleccionados en Market Watch. En esta versión, muestra el & nbsp; porcentaje & nbsp; de cambio de precio en relación con el último cierre diario , lo que puede ofrecer una descripción general rápida del mercado. Esta es una herramienta para ayudar a los operadores a identificar qué tan fuerte es una moneda en relación con todos los demás pares. Esta es una herramienta visual

This is an open interest indicator for the Russian FORTS futures market. Now, you can receive data on the open interest in real time in МТ5 terminal. This allows you to develop brand new trading strategies or considerably improve the existing ones. The data on the open interest is received from the database (text CSV or binary one at user's discretion). Thus, upon completion of a trading session and disabling the terminal (or PC), the data is saved and uploaded to the chart when the terminal is

Rooster - is a handy tool that allows you to receive alerts from your favorite indicators: Supports up to 3 indicators, built-in and custom; Supports up to 4 different signals at the same time; Able to show pop-up alerts, send e-mail and push notifications. This is version for MetaTrader 5, version for MetaTrader 4 is here . Detailed manual is sent on request. Default settings demonstrate MACD lines crossing signal.

El indicador muestra patrones armónicos en el gráfico basado en Dynamic ZigZag ( https://www.mql5.com/en/market/product/5356 ) y es casi un análogo completo de una de las versiones de los conocidos korHarmonics. El indicador reconoce los siguientes patrones y sus variedades: ABCD, Gartley (Butterfly, Crab, Bat), 3Drives, 5-0, Batman, SHS, One2One, Camel, Triangles, WXY, Fibo y Vibrations. Solo la visualización de patrones ABCD y Gartley está habilitada en la configuración de forma predetermi

My Money Manager like a risk controller, which places your trades with the exact volume that meets your desired stop loss risk percentage. It can also help you to preview your EP/SL/TP levels before placing an order by dragging these levels directly on a chart, and keep reporting about them during the position opening. With this tool, you will feel more comfortable when deciding to open orders, as well as forecasting your profit/loss with your orders. Placing orders is a very precise and profess

Version for MetaTrader 5. The indicator is based on point and figure chart, but their period is equal to ATR indicator values. Displays in the form of steps. Steps above zero indicate an uptrend. Below zero on a downtrend. Parameters: ATRPeriod - ATR period for calculation of steps. Note: The indicator uses closes price, thus it is recommended to consider completed bars.

Currency Power Meter muestra el poder de las principales monedas entre sí. El indicador muestra la fuerza relativa de la moneda / par en el momento actual en un período de tiempo (diario, semanal, mensual). Es útil para los comerciantes del día, los comerciantes de swing y comerciantes de la posición con opciones período adecuado.
Monedas poder 'es la verdadera razón de la tendencia del mercado: La moneda más fuerte frente a la moneda más débil combinará en un par más de tendencia. Como sabem

La herramienta está diseñada para medir la distancia entre dos puntos en un gráfico y mucho más.
Lista de medidas:
Distancia en puntos Beneficio (con y sin spread) Diferencia de tiempo Cambio porcentual en el precio Ángulo de inclinación Cantidad de barras (varias opciones) Relación de distancia en puntos con valor de referencia Funciones:
Anclaje a precios OHLC Configuración automática del perfil de color basado en el color de fondo del gráfico Varios tipos de punteros para ele

Trend indicators tell you which direction the market is moving in , if there is a trend at all because they tend to move between high and low values like a wave
This indicator shows Up Trend (Green Histogram), Down Trend (Red Histogram) and Sideways Trend (Yellow Histogram). Only one input parameter: ActionLevel. This parameter depends of the length of the shown sideways trend.

MA Crossing displays two moving averages on the chart painting their crossing points in different colors - blue (buy) and red (sell). The indicator clearly defines the trend direction and power and simplifies the perception of market signals. The indicator may be useful in the strategies involving two moving averages' crossing method. The indicator's input parameters allow you to select the following settings for each moving average: period (Fast Period, Slow Period); smoothing period (Simple, E
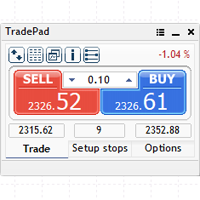
Una solución simple para operaciones comerciales rápidas y control de posición en múltiples instrumentos comerciales. La interfaz del panel es simple e intuitiva. Para un trabajo cómodo de un comerciante, el panel tiene: administrador de teclas "rápidas", con las que puede administrar todas las operaciones comerciales y períodos de gráficos; una herramienta para marcar los niveles de negociación al colocar órdenes pendientes o de mercado para evaluar los riesgos y las ganancias potenciales al es

This indicator is a visual combination of 2 classical indicators: Bulls and MACD. Usage of this indicator could be the same as both classical indicators separately or combined. Input parameters: BearsPeriod = 9; ENUM_MA_METHOD maMethod = MODE_SMA; ENUM_APPLIED_PRICE maPrice = PRICE_CLOSE; SignalPeriod = 5.

This indicator is a visual combination of 2 classical indicators: Bears and MACD. Usage of this indicator could be the same as both classical indicators separately or combine. Input parameters: input int BearsPeriod = 9; input ENUM_MA_METHOD maMethod = MODE_SMA; input ENUM_APPLIED_PRICE maPrice = PRICE_CLOSE; input int SignalPeriod = 5.

Price Breakout pattern Scanner is the automatic scanner for traders and investors. It can detect following patterns automatically from your chart. Head and Shoulder - Common tradable pattern. Reverse Head and Shoulder - This pattern is the reverse formation of the Head and Shoulder. Double Top - When the price hits resistance level twice and decline toward the support level, the trader can anticipate sudden bearish breakout through the support level. Double Bottom - The double bottom pattern is

Expert trabaja sobre la base del indicador i-ligamento, puede personalizar para diferentes intervalos de tiempo, tiene la capacidad de mantener toda la historia sin cambiar los ajustes. Usos arriesgan perder el equilibrio. Cuando la función de optimización se utiliza personalizado. ¡Experto completamente automático! Y no requiere que el usuario corrija el intercambio.

Este indicador analiza la acción pasada de los precios para anticipar la presión de compra y venta en el mercado: lo hace mirando hacia atrás en el pasado y analizando los picos y valles de precios en torno al precio actual. Es un indicador de confirmación de última generación. [ Guía de instalación | Guía de actualización | Solución de problemas | FAQ | Todos los productos ] Predecir la presión de compra y venta en el mercado Evite quedar atrapado comprando vendiendo frenéticos No se necesita

Trend is the direction that prices are moving in, based on where they have been in the past . Trends are made up of peaks and troughs. It is the direction of those peaks and troughs that constitute a market's trend. Whether those peaks and troughs are moving up, down, or sideways indicates the direction of the trend. The indicator PineTrees is sensitive enough (one has to use input parameter nPeriod) to show UP (green line) and DOWN (red line) trend.

Optimistic trader may enter the market when the price crosses the blue line. More reliable entry will be when the price crosses the yellow line. When the price comes back and crosses the red line you can open a position in the course of price movements. If the price is moving between aqua lines - stay out of the market.
The reversing Expert Advisor FORTS MAX is designed specially for trading futures contracts on FORTS . Its trading algorithms are based on the original methods of price dynamics analysis and the specifics of the Russian market. The main feature of this EA is the use of reverse trading technique, reverting a position and taking into account the free margin. Before reverting a deal, it closes the current position, and opens a new one only after margin is released. The FORTS MAX Expert Advisor uses

The Bull and Bear Power indicators identify whether the buyers or sellers in the market have the power, and as such lead to price breakout in the respective directions. Bulls Power vs. Bears Power is a unique tool that displays on each candle the balance between the bears (sellers) and the bulls (buyers). This particular indicator will be especially very effective when the narrow histogram and the wide histogram reside on the same side (above or under the Zero line)

AutoCloseTimer allows you to close positions and delete pending orders at a specified time.
Usage Download and drag and drop AutoCloseTimer onto the chart. Check Allow AutoTrading in Common tab. Set parameters in Inputs tab. Notice: The close time must be later than the current market time.
Input Parameters CloseSymbol - there are 2 options SymBol Of Chart - just close the symbol of the current chart
All Symbols - close all symbols CloseTimerDay - specify a day for AutoCloseTimer. The defau
"Support" and "Resistance" levels - points at which an exchange rate trend may be interrupted and reversed - are widely used for short-term exchange rate forecasting. One can use this indicator as Buy/Sell signals when the current price goes above or beyond Resistance/ Support levels respectively and as a StopLoss value for the opened position.

Support and resistance represent key junctures where the forces of supply and demand meet. On an interesting note, resistance levels can often turn into support areas once they have been breached. This indicator is calculating and drawing 5 pairs of "Support and Resistance" lines as "High and Low" from the current and 4 previous days.

Fibonacci Arcs in the full circles are based on the previous day's candle (High - Low). These arcs intersect the base line at the 23.6%, 38.2%, 50%, 61.8%, and 78.6%. Fibonacci arcs represent areas of potential support and resistance. Reference point - the closing price of the previous day. These circles will stay still all day long until the beginning of the new trading day when the indicator will automatically build a new set of the Fibonacci Arcs.

The three basic types of trends are up, down, and sideways. An uptrend is marked by an overall increase in price. Nothing moves straight up for long, so there will always be oscillations, but the overall direction needs to be higher. A downtrend occurs when the price of an asset moves lower over a period of time. This is a separate window indicator without any input parameters. Green Histogram is representing an Up-Trend and Red Histogram is representing a Down-Trend.

Introduction Harmonic Patterns are best used to predict potential turning point. Traditionally, Harmonic Pattern was identified manually connecting peaks and troughs points in the chart. Manual harmonic pattern detection is painfully tedious and not suitable for everyone. You are often exposed under subjective pattern identification with manual pattern detection. To avoid these limitations, Harmonic Pattern Plus was designed to automate your harmonic pattern detection process. The functionality
El Mercado MetaTrader es una plataforma única y sin análogos en la venta de robots e indicadores técnicos para traders.
Las instrucciones de usuario MQL5.community le darán información sobre otras posibilidades que están al alcance de los traders sólo en nuestro caso: como la copia de señales comerciales, el encargo de programas para freelance, cuentas y cálculos automáticos a través del sistema de pago, el alquiler de la potencia de cálculo de la MQL5 Cloud Network.
Está perdiendo oportunidades comerciales:
- Aplicaciones de trading gratuitas
- 8 000+ señales para copiar
- Noticias económicas para analizar los mercados financieros
Registro
Entrada
Si no tiene cuenta de usuario, regístrese
Para iniciar sesión y usar el sitio web MQL5.com es necesario permitir el uso de Сookies.
Por favor, active este ajuste en su navegador, de lo contrario, no podrá iniciar sesión.