Robots comerciales e indicadores para MetaTrader 5 - 125

A useful feature may be to determine the normal frequency of round-sized trades, and monitor deviations from that expected value. The ML algorithm could, for example, determine if a larger-than-usual proportion of round-sized trades is associated with trends, as human traders tend to bet with a fundamental view, belief, or conviction. Conversely, a lower-than-usual proportion of round-sized trades may increase the likelihood that prices will move sideways, as silicon traders do not typically hol
Easley et al. study the frequency of trades per trade size, and find that trades with round sizes are abnormally frequent. For example, the frequency rates quickly decay as a function of trade size, with the exception of round trade sizes {5, 10, 20, 25, 50, 100, 200,…}.
These authors attribute this phenomenon to socalled “mouse” or “GUI” traders, that is, human traders who send orders by clicking buttons on a GUI (Graphical User Interface).
In the case of the E-mini S&P 500, for example, si
Easley et al. [2011] proposed a high-frequency estimate of PIN, which they named volume-synchronized probability of informed trading (VPIN). This procedure adopts a volume clock, which synchronizes the data sampling with market activity. For additional details and case studies of VPIN, see Easley et al. [2013]. A number of studies have found that VPIN indeed has predictive power: Abad and Yague [2012], Bethel et al. [2012], Cheung et al. [2015], Kim et al. [2014], Song et al. [2014], Van Ness et

Hasbrouck follows up on Kyle’s and Amihud’s ideas, and applies them to estimating the price impact coefficient based on trade-and-quote (TAQ) data. Consistent with most of the literature, Hasbrouck recommends 5-minute time-bars for sampling ticks. This indicator is based on Advances in Financial Machine Learning 2018 - Marcos Lopez de Prado book, Page 289. --- This code can run slow when using big timeframes, it use copytick to get dollar volume, in a next version I will implement a temporary i
This indicator implements the Corwin and Schultz Estimator based on Advances in Financial Machine Learning 2018 - Marcos Lopez de Prado, page 284. It's a spread estimator using high/low and a rolling window (configurable). It works with low liquidity markets as a robust estimator. It's interesting when you need to track spread changes, more information can be found at Marcos book.
Amihud studies the positive relationship between absolute returns and illiquidity. In particular, he computes the daily price response associated with one dollar of trading volume, and argues its value is a proxy of price impact. Despite its apparent simplicity, Hasbrouck [2009] found that daily Amihud’s lambda estimates exhibit a high rank correlation to intraday estimates of effective spread. This indicator is based on Advances in Financial Machine Learning 2018 - Marcos Lopez de Prado book,

In Kyle’s model, the variable captures price impact. Illiquidity increases with uncertainty about v and decreases with the amount of noise Kyle argues that the market maker must find an equilibrium between profit maximization and market efficiency. This indicator is based on Advances in Financial Machine Learning 2018 - Marcos Lopez de Prado book, Page 288.
This indicator implements the Rool Model Estimator based on Advances in Financial Machine Learning 2018 - Marcos Lopez de Prado, page 283. It's a spread estimator using trade by trade (copytick) values from last trades (configurable). It works with low liquidity markets as a robust estimator considering the covariance between price diferences. It's interesting when you need to track spread changes
This indicator implements the High Low Volatility Estimator based on Advances in Financial Machine Learning 2018 - Marcos Lopez de Prado, page 284. It's a robust estimator using High/Low values from past bars (configurable). It's robusto to Gaps (open/close of days to stock markets) since it's using high/low ration and not the close price. It's interesting when you need to avoid trading at a specific level of volatility

The Levels indicator has been created to simplify the process of plotting support and resistance levels and zones on selected timeframes. The indicator plots the nearest levels of the selected timeframes, which are highlighted in different colors. It significantly reduces the time needed to plot them on the chart and simplifies the market analysis process. Horizontal support and resistance levels are used to identify price zones where the market movement can slow down or a price reversal is like

The initial price is 75 USD, the future price is 150 USD
The EA uses a reverse strategy. To detect trading signals, the following indicators are used: Moving Average, Relative Vigor Index, Average True Range, Alligator and other custom indicators . Each pair has a stop loss, take profit, breakeven and trailing stop. The EA trades on many major currency pairs and timeframes. The EA uses timeframes: MetaTrader 4 MetaTrader 5 M1, M5, M15, M30, H1 M1, M2, M3, M4, M5, M10, M12 ,

ZigZag with backlight Fibonacci levels. The indicator has the ability to set any number of levels, the signals of the intersection of which can be sent to your mobile device email, as well as viewed via alerts. The indicator is designed to perform wave analysis, search for harmonic petterns, as well as search for other technical analysis figures. This Zigzag uses the principle of constructing extrema in which any trader will understand very easily. First, the indicator finds the upper and lower

ZhiBiSmart es adecuado para todos los ciclos de gráficos de todas las variedades del mercado. Utiliza la llamada de tendencia para hacer la banda de rebote, que predecirá mejor la banda y la tendencia. Compra el pedido: una marca con una flecha verde hacia arriba; Compre el cierre: aparece la marca de la cruz verde; Vender el pedido: una marca con una flecha amarilla hacia abajo; Vender el cierre: una cruz amarilla; Ajustes de parámetros: [TrendPeriod]: el período de la línea de tendencia; [Sign

Sensey Candlestick Pattern Recognition Indicator Sensey is an advanced tool capable of accurately identifying candlestick patterns. Not only does it recognize patterns, but it also detects price highs and lows within a specified time frame. Sensey operates seamlessly across multiple timeframes and is compatible with all currency pairs, futures, and commodities. Unlike some indicators, Sensey does not repaint historical data, ensuring reliable analysis even in cryptocurrency markets. You can wit

The indicator compares quotes of a given symbol and a synthetic quote calculated from two specified referential symbols. The indicator is useful for checking Forex symbol behavior via corresponding stock indices and detecting their convergence/divergence which can forecast future price movements. The main idea is that all stock indices are quoted in particular currencies and therefore demonstrate correlation with Forex pairs where these currencies are used. When market makers decide to "buy" one

Hunter Trend: Arrow Indicator for Binary Options Trading Hunter Trend is an arrow indicator designed for trading binary options (turbo options) on the M1 timeframe, allowing for short-term trading opportunities. How to Trade with this Tool: Signals may appear when a candlestick forms. Once such a signal appears, wait for the closure of that candlestick. Upon the opening of a new candlestick, open a trade for 1-2 candlesticks in the indicated direction. In this case, for 1-2 minutes. A blue dot

The Quantum GBPX is the latest addition to our suite of currency indices, and one which we have been asked for many times, and even more so since Brexit. It is an index which has taken us some time to develop, and through a series of complex calculations draws its primary data from a basket of currencies based on the old style dollar index, the Dixie. This is converted to a chart for the British pound. The result is an accurate index which describes strength and weakness for the GBP currency in
AutoBuy - is a script place pending buy stop orders with automatic calculation of the volume (number of shares) depending on the risk of money on the deal. Inputs: Risk - number in USD of money put on the trade.
BuyHighStep - the number of USD, a step up from the rates High of the current candle (bar) stock up to buy. Minimum value is 0.01
StopLossStep - the number in USD, the step from the price of the buy stop order down to close the deal at a loss. The minimum value of 0.10
TakeProfitStep

This indicator would help you I DENTIFY different HORIZONTAL SUPPORT / RESISTANCE LEVELS AND TRENDLINES.
ADVANTAGES: Use up till 5 different levels of Support and Resistance Use up till 5 different trend lines Use true/false options to display for Support/Resistance or Trend line Image
PARAMETERS: nPeriod: the time period to decide
Limits: the candles limit to look back
UseHorizontalLines: true/false option to display Horizontal Support and Resistance Lines UseTrendline: true/false opti

WOWOWOW ! now we are ready to establish patterns, when tracing these lines we can observe sets of 1000 lines or more forming patterns that are gradually setting up a scenario behind the empty graph of the screen of the meta trader. We can observe the behavior of the players over time and we can try to predict some future action simply by installing this powerful calculating machine. If you feel confused, try the LEKIMDIKATOR utility, this one I charge 10 dollars because it will give you a real

I present to your attention experimentally, a new EA that forms the trading range of the time interval. The EA has built-in proprietary algorithms for transaction support.
The emerging range is set manually by the EA settings, such ranges can be set up to two pieces. After a specified time and capture the trading range, the EA starts its work. When the price goes beyond the limits of this range, the EA opens an order with market execution, accompanying the transaction, placing Take profit and

Exit Area Ultimate es un indicador técnico diseñado para mejorar las decisiones comerciales al indicar los niveles diarios de rango real promedio (ATR) y tasa diaria promedio (ADR) en el gráfico. Al comprender estos niveles, los operadores pueden evaluar fácilmente el movimiento promedio de un activo a lo largo del día. Este indicador versátil sirve para múltiples propósitos para los comerciantes diarios, ayudando en la colocación de pedidos, identificando tendencias intradía, establec

The Profit30 for MT5 platform( Also Available for MT4 in Mql5 Market Place) Expert Adviser, uses 7 different 'price action style' system on the EURUSD pair, on the M5, M15, M30, H1 timeframes.Best optimized perform in H1 chart
The EURUSD pair offers in general the best performance in the major part of the Profit30 EAs. In this EA, a selection of Profit30 systems has been rewritten and configured explicitly for get the best performance in the EURUSD pair. The EURUSD pair offers in general the

CALCULADORA DE RANGO DE PRECIOS ¡CONFÍA EN MIS PRECIOS, CREA, FE! ¡Siga nuestros videos en Youtube diariamente en Lekimdikator Live! Lekimdikator calcula los mejores precios en los mercados para entrar o salir ¡Úselo junto con su indicador favorito! Aprenda a operar en bolsas de valores, Forex, acciones, opciones sobre acciones, divisas, fondos de inversión, fondos inmobiliarios o cualquier mercado que tenga acceso a MetaTrader 5 con Lekimdikator. Es una herramienta para traders novatos o exper
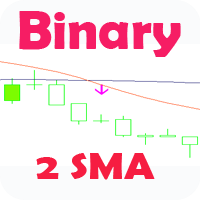
Стрелочный индикатор, выдающий сигнал при пересечении 2 SMA. Сигналы выдаются в виде стрелок и подходят для торговли бинарными опционами.
Входные параметры First period- период 1 MA Second period - период 2 MA Invert signals - Возможность давать инвертированные сигналы (для работы по тренду) Candles to count - количество свечей для подсчета статистики Expiration - время экспирации сигнала Length - расстояние для сигналов Особенности :
Возможность использовать инверсию сигналов Возможн

This long-term trading system works on 20 pairs and 1 timeframes. The Expert Advisor uses various trading systems, such as trend trading, countertrend trading and others. This increases the chances of sustained growth and reduces exposure to a single pair or individual operations. The risk is tightly controlled.
The EA has the built-in smart adaptive profit fixing filter. The robot has been optimized for each currency and timeframe simultaneously. It does not need arrival of every tick and h
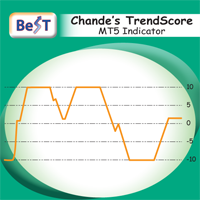
BeST_Chande TrendScore Indicator points the start of a trend with high degree of accuracy and it is amazing for scalping on the 1min timeframe. It is also a simple way to rate trend strength. It indicates both the direction and strength of a trend and can be easily combined with various trend-following, swing and scalping strategies.As of a trend’s direction and strength a value of +10 signals a strong uptrend while a value of -10 signals a strong downtrend. Generally a positive score shows an

Ultra Trend Hunter
Indicador encargado de seguir la tendencia de cualquier par de divisas, índice, materia prima, futuros, etc. Fácil de usar y muy intuitivo, te permite jugar con la mejor configuración para cada símbolo permitiendo con ello lograr excelentes entradas y salidas de cada operación de compra o venta. Su gráfica te permite identificar cuando entrar en una operación de compra/venta y te indica cuando salir de esa operación. Una vez que el indicador cambia de color, se debe esperar
El EA trabaja con movimientos bruscos de precios, puede usar el bloqueo de posiciones abiertas y la piramidal. Se utilizan stops virtuales (take profit, trailing stop), el bloqueo de órdenes y el stop loss en% del saldo se utilizan para limitar las pérdidas. Se pueden abrir varias decenas de órdenes al mismo tiempo y el asesor necesitará fondos gratis para salir de los bloqueos y cerrar todas las posiciones en función de la ganancia total, esto debe tenerse en cuenta al elegir la cantidad de in
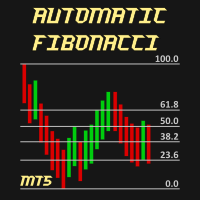
Automatic Fibonacci is an indicator for automatic Fibonacci Levels drawing. It is fully customizable by user. User can also select different Fibobonacci Levels by user settings or can use multiple Automatic Fibonacci indicator in one chart.
All details can be found >>HERE<<
Instructions Move Indicator to the chart (simply drag and drop) When pop up window appears select desired settings. Confirm settings and enjoy the Automatic Fibonacci indicator.
Features Any chart Any time-frame C

Oscillator trading signals - это динамический индикатор, определяющий состояние к продолжению тенденции роста или падению цены торгового инструмента и отсечению зон с нежелательной торговлей. Индикатор состоит из 2 линий осцилляторов. Медленная и быстрая сигнальная линия. Шкала отображения перевернутая. Зоны вблизи 0 свидетельствуют о тенденции роста цены валютной пары. Зоны -100 свидетельствуют о падении цены валютной пары. На основном графике в виде стрелок отображается потенциально выгодные

This indicator works in Brazil market, it should be used on options symbols. the indicator create 8 buffers, Delta, Gamma, Vega, Rho, Theta, Time(working days), Implied Volatility, R (interest rate), and can be used to view greeks over time. It shouldn't be used to trade, since it's cpu intensive, it's just a historic viewer, you can see what happened with greeks and teach friends :)
It's a simple indicator that execute GARCH(1,1) function, it can be used with basis stocks and options, when garch is bellow implied volatility probably implied volatility tend to goes down, and when garch is higher than implied volatility probably implied volatility goes up. Can be used with options trading when buying / selling volatility, for example, buy ATM put and call when garch is higher than implied volatility and sell when it's lower.

Este indicador es una combinación de dos filtros modificados de Lanczos. El primer filtro sirve para extrapolar el precio. Basado en valores pasados, predice un posible movimiento de precios dentro de la barra actual. Es decir, muestra cuál sería el precio si las tendencias pasadas permanecieran sin cambios. El segundo filtro para suavizar y promediar los precios dentro de la ventana, determinado por el nivel del filtro. Gracias a la selección de ponderaciones, este filtro responde más activamen
EA Undead is fully automated bot to generate a stable profit from the volatile FOREX market. This EA will never depend on any indicator.
How this EA works? At the very first it will open a Buy order and Sell Order at same time. And by default take profit will be 15 Pips for all orders. Once take profit reaches it will Re-Open that order. If the market goes against any order than it will add more positions, by default 50 Pips away from last open trade. To minimize the draw-down and loss and to
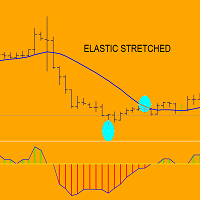
Think to an elastic: when you stretched it and then you release…it returns to its state of rest.
ELASTIC STRETCHED indicator display in real time distance of any bar:when price is above sma,indicator diplay distance in pips of HIGH from sma....when price is below sma,indicator display distance in pips of LOW from sma.
When price goes far from its sma during (for example) downtrend ,can happen two things: A) price returns to sma (reaction) and goes up OR B) price goes in trading range....but in

Este indicador es un filtro híbrido secuencial basado en una combinación de propiedades medias y medias móviles.
El uso de la mediana permite filtrar valores atípicos anormales e impulsos aleatorios en los valores de las series de precios. Al mismo tiempo, el filtro de mediana no actúa sobre la tendencia en el movimiento de precios, dejándolo sin cambios. Como el filtro de la mediana no es lineal, se utiliza el promedio utilizando un promedio móvil simple para suavizar sus valores. Este enfoq
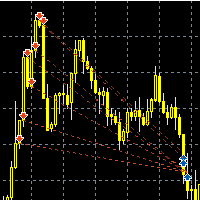
Модификация известного советника " Survivor " с гибкими настройками и возможностью оптимизации. Время работы : круглосуточно(настраивается) Рекомендованная валютная пара : USDJPY, AUDUSD, GBPJPY, EURCHF Рекомендованный таймфрейм : М5, М15 Описание : Трендовый советник с возможностью мартингейла и построением сетки ордеров. В советнике используются три группы аналогичных сигналов для открытия, закрытия и дополнительных сделок. При наличии тренда(определяется МА) ловится отскок в сторону движени

FOREX Alligator Robot EA ALLIGATOR was developed to achieve specific and highly accurate goals, which is key to guaranteeing significant returns in the world Forex market, works only in the EURUSD currency pair, and only in the time frame 15m It runs in the year 2016 onwards only. Be a predator in the most hostile market in the world. IMPORTANT - - Outside of this scenario it breaks your account.
HOW IT WORKS Our team has taken care to optimize your Forex market experience to the maximum, cr

This cluster indicator is MT5 version of SuperIndices for MT4. It allows for processing mixed clusters, where symbols from various markets can be included. For example, it can handle Forex, indices, CFDs, spot at the same time. Number of visible lines increased to 16. An interactive ruler can be enabled to measure signals' strength on the history. The indicator creates a set of embedded cluster indicators (CCFpExtraIndices) with carefully selected periods and combines their results using smart w

IRB Scalper Original The Original version of IRB Scalper Pro (V3.0) The strategy: EA strategy is inspired from a profitable strategy of Mr Rob Hoffman (One of the best traders in the world with multiple prizes on manual trading) . 1.Entry: The EA search for IRB bars (Inventory retracement bar), and place sell pending order or buy pending order according to the trend confirmed by the calculation of a 20 EMA slope degree. We believe that most of IRB Bar are caused by huge institutions (Hedge funds

This indicator is designed to detect the best divergences between price/MACD and price/RSI. MACD and RSI produce by far the best divergence signals therefore this indicator focus on those two divergences. This indicator scans for you up to 15 instruments and up to 21 timeframes for bullish and bearish divergences. You need to add the indicator only to one single chart ! The indicator will then automatically scan all configured instruments and timeframes.
Important Information
The indicator c

For those who trade on the news...
At the appointed time, the EA places stop orders BuyStop and SellStop. The distance of placing orders from the current market prices is customizable. If after a specified time (timer) no orders are triggered, the EA will modify them. Move them back to the right distance from the market. When one order is triggered, the other is deleted. If no order is triggered within the specified period of time, both orders are deleted. For an open position it is possible t

TradeLeader PD - Pontos Decisivos
O indicador TradeLeader PD completa seu trade system com as informações realmente relevantes.
No painel você verá diversas informações consolidadas e sua relação com o preço. Compare os fluxos de compras e vendas(agressão), delta e muito mais.
Veja abaixo o que somente o TradeLeader PD pode oferecer em um só indicador, elevando o Metatrader a outras plataformas profissionais especializadas.
Painel Variação em porcentagem e ícone. Livro de ofertas: Resist
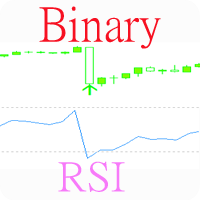
Индикатор, показывающий моменты пересечения важных уровней индикатора RSI. Может быть использован для поиска моментов пересечения уровней для успешной торговли на отскок или по тренду. Подходит для бинарной торговли, т.к. имеется возможность посчитать точность сигналов, в зависимости от времени экспирации.
Входные параметры Inform about finding the signal - параметр, отвечающий за получение уведомлений (Alert) о найденном сигнале. По умолчанию - да Show Panel - Показать/ скрыть панель Period

This indicator implements the well-known trend trading strategy for Stochastic, with two levels for purchases (40 and 80) and two levels for sales (60 and 20). When an upward movement begins, the oversold level rises, from 20 to 40. When there is a downward movement, the overbought level goes down, from 80 to 60. Thus, the strategy has 4 levels. Obviously, tracking signals using the usual 4-level Stochastic is not very convenient, therefore, this indicator illuminates the inputs and outputs with

This is not an aggressive, high yielding EA but targets between 100% - 200% annually so as to keep drawdown as low as possible. However, to increase target, you may increase MM until you get desired result. EA default setting is recommended for H1 timeframe of GBPUSD but can be optimized for other pairs and timeframes as well. PARAMETERS: 1. UseFixedLot: By default, this is set to false, meaning you are using growing lots based on available capital and MM setting. If you prefer to use fixed lo

The utility displays the order book, as well as increases its depth, remembering the location of applications that have gone beyond the current "window" view. With the utility user can perform quick trading actions in one click - placing/cancelling/editing of explicit and hidden orders, and also opening/editing positions.
Utility features The orders book display works only on those trading symbols for which it is broadcast by the broker. To reset the information about the rows that were record
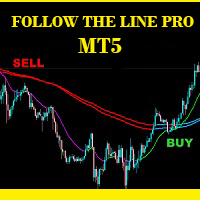
Follow The Line PRO FOLLOW THE LINE (PRO VERSION) This powerful indicator is the full and complete version of my free indicator called "Follow The Line". IT IS BASED ON the popular maxim that: "THE TREND IS YOUR FRIEND" It gives alarms and alerts of all kinds. IT DOES NOT REPAINT and can be used for all currency pairs and timeframes.
AVOID FALSE SIGNALS:
BUY ONLY when price closes above the green line and the green line is above the blue channel.
SELL ONLY when price closes below the pink
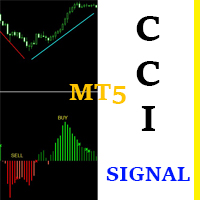
CCI Signal This indicator is based on a custom CCI that is colored to reflect the trend. It was created with the idea in mind: "THE TREND IS YOUR FRIEND". It is simple and easy to use. Even a newbie can understand and use it to achieve great trade results. Simply follow the colors. RED means SELL. GREEN means BUY. It DOES NOT repaint and can be used for Scalping, Day Trading and Swing Trading. It can be used for any time-frame and any currency pair. CCI Signal is highly reliable and provides p

This is a panel EA for one-click trading. Demo version | User manual | Contact me for any questions / ideas for improvement / in case of a bug found
List of main functions
Risk management Calculate the lot size by X dollars(currency of deposit) and stop loss.
Calculate the lot size by percent of equity and stop loss. Calculate lot size by equity percent (free margin percent). Calculate lot size by specified lot for each X dollars(currency of deposit) of balance.
Positions and orde

Dow Jones Top Bottom Trader EA5 has its own unique Breakout strategy . It BUYs when the price is near the top and it SELLs near the bottom of the previous bar. It uses 2 MACD indicators with the completed different settings to define trend and effectively filter wrong signals.
EASY SETUP
Symbol: US30 (Dow Jones) Timeframe: H1 Minimum Deposit: 10000 USD for amount 1 lot, 1000 USD for amount 0.1 lot, 100 USD for amount 0.01 lot Setting: Use default setting.
SIMPLE but EFFECTIVE
Test befo
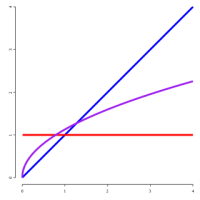
From https://en.wikipedia.org/wiki/Fractional_calculus:
Fractional calculus is a branch of mathematical analysis that studies the several different possibilities of defining real number powers or complex number powers of the differentiation operator D
This indicator execute fracional differentiation on data, you can select the differentiation D value and execute some tweaks like execute Log(value) before difefrentiation or execute a window normalization on last [diffNormalizeWindo
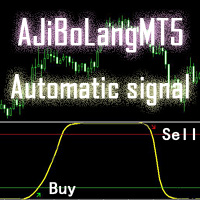
Este indicador AJiBoLang es adecuado para todos los ciclos de la señal, muy adecuado para señales a corto plazo, la precisión de la señal es buena.
Solo mire las flechas en la tabla y haga un solo pedido: la flecha verde es el sencillo Comprar y la flecha roja es el único Vender.
Después de realizar la orden de compra, si la línea amarilla sube al nivel superior y recorre una cierta distancia, entonces puede vender la orden de compra.
Después de hacer la venta individual, si la línea amari

Ultimate Moving Average Scanner (Multi Pair And Multi Time Frame) : ---LIMITED TIME OFFER: NEXT 25 CLIENTS ONLY ---46% OFF REGULAR PRICE AND 2 FREE BONUSES ---SEE BELOW FOR FULL DETAILS Institutional traders use moving averages more than any other indicator. As moving averages offer a quick
and clear indication of the different phases of a trend. Such as expansion, pullback, consolidation and reversal.
And viewing the market through the same lens as the institutions is a critical part of y

Ultimate Engulfing Bar Scanner (Multi Pair And Multi Time Frame) : ---LIMITED TIME OFFER: NEXT 25 CLIENTS ONLY ---46% OFF REGULAR PRICE AND 2 FREE BONUSES ---SEE BELOW FOR FULL DETAILS Nothing is more important than institutional price action and order flow.
And a strong engulfing candle is a clear indication that the institutions have flipped their sentiment.
Engulfing bar patterns are widely used by institutional traders around the world. As they allow you to manage
your trades withi

Ultimate Volatility Scanner (Multi Pair And Multi Time Frame) : ---LIMITED TIME OFFER: NEXT 25 CLIENTS ONLY ---46% OFF REGULAR PRICE AND 2 FREE BONUSES ---SEE BELOW FOR FULL DETAILS Volatility expansion and contraction is a fundamental market principle that will NEVER go away.
And some of the largest institutions in the world invest enormous amounts of capital into various
types of volatility strategies. Not only for profit driven trading strategies, but also for risk control.
VOLATILITY

Ultimate Correlation Scanner (Multi Pair And Multi Time Frame) : ---LIMITED TIME OFFER: NEXT 25 CLIENTS ONLY ---46% OFF REGULAR PRICE AND 2 FREE BONUSES ---SEE BELOW FOR FULL DETAILS Correlations exist because of ongoing patterns in global capital flows.
Correlations are a fundamental market principle that underpin the markets.
And correlations will never go away. Global capital tends to flow (in unison) in and out of risk sensitive currencies.
While at the same time flowing in and out o
Time Adjusted ATR The Time Adjusted ATR indicator is used to determine the anomalous volatility for exactly specified time of day. The indicator is useful for early identification of reversals, breakthroughs and considering volatility corrections. Options • ATR period: the number of bars of the standard ATR indicator for which the averaging is taken (recommended value = 1). • Normalized Base: how many days (bars) are used to calculate normalization (recommended value = 10 ~ 50). How is "Time

According to trading experience: Some symbols are easy to reverse on certain days, such as Monday, or afternoon, and so on. So comparing the current price with the corresponding historical moment price is valuable. If the price coordinate system uses a logarithmic price, you will get a lot of valuable information. 1. What is this?
This program can convert the symbol price and add it to your Chart. You can compare it with your major chart. The DEMO version Link: https://www.mql5.com/en/market/p

One click to close all (OCCA) provides you posibility to close all open position with one click.
Here is no any settings, just run the script and all your open positions will be closed and it will happen very fast !
Works with all types of accounts, with all currency pairs and any broker. The number of open positions is not limited.
The script will be useful for trading strategies, in which you need to manage a large number of positions.

It's a self-learning indicator. You need to set a starting time and download the relevant historical data for it to learn. Learn as few rules as possible and give the maximum freedom to the indicators. Therefore, the principle of choosing the best outcome during the learning period does not guarantee that every transaction is profitable. In general, the longer the study, the more reliable the results. In the strategy tester, you need to set the time parameter before the test starts so that the i

Do you think it's a bit cumbersome when you need to switch symbols or timeframes with mouse click? 1. What is this? This is a program that can switch symbols and timeframes with direction keys. Fast switching, very convenient, no mouse click required. For traders, one symbol with multi-timeframe charts are usually added, you can change symbol on those charts easily . For multi-currency traders, different symbol charts are usually added, you can also change those timeframes easily. I wrote thi

The Wolfalizer Indicator combines the functionality of the Engulfing Stochastic along with the ConsecutiveRSI and adds alerts along with more detailed output to the journal. This Indicator will alert you when RSI or Stochastics cross into oversold or overbought. You can set the oversold and overbought levels for RSI and Stochastics separately. You can pick if you want an engulfing candle to appear on the cross or set a number of consecutive candles you would like to see. Interesting Inputs inc

Very useful information (VUI) - provides useful information on the following points:
Pip price - the price of point (pip) in the currency of the account with the volume specified by you Tick size - tick size Margin Buy - margin required to open a Buy order with the volume specified by you Margin Sell - margin required to open a Sell order with the volume specified by you Open Buy - the number of open positions, the number of open lots Buy Open Sell - the number of open

It is an indicator that works with oscillations based on golden proportions. Through this indicator it is possible to operate using the proportions of the number of gold to elaborate strategies with the golden ratio. In this way, it is possible to make market analyzes respecting the proportions of Fibonacci. How to use: The closer the lines are to each other, the greater the possibility of retraction or inversion of the movement, the same is true for the distance of the lines. Nearby lines, sug

Бинарный индикатор находит свечной паттерн "Поглощение" и рисует соответствующий сигнал для входа рынок. Имеет встроенные фильтры и панель для просчета количества успешных сделок.
Особенности Работает для всех валютных пар и любых таймфреймов. Индикатор рассматривает комбинацию из 2-х или 3-х свечей в зависимости от настроек. Имеется возможность фильтровать сигналы путем настройки количества свечей одного цвета (тренда) до образования паттерна. Присутствует панель для отображения точности

EU_Savings_Box (MT5 Expert Advisor)
This is 100% Algo Forex Trading Robot and is programmed for Long Term Investment with Low Risk. It uses no martingale, no grid, no scalping. The strategy combines 3 reliable and properly filtered indicators and price action to determine safe market entry and exit levels. This strategy has over 70% winning rate within 18 year plus. It is recommended for those looking for EA that can be trusted for many years. Moreover, you can adapt this EA to your preferred

El patrón de copa y asa es una formación técnica de precios que se asemeja a una copa y un asa, donde la copa tiene la forma de una "U" y el asa tiene una ligera deriva hacia abajo. El lado derecho del patrón -el mango- es más pequeño que el lado izquierdo -cup-, y no retrocede más del 50% desde la parte superior. Puede ser tanto una continuación como un patrón de inversión. [ Guía de instalación | Guía de actualización | Solución de problemas | FAQ | Todos los productos ] Señales comerciales cl

The revolutionary automatic adviser of the new generation with three parameters:
Target profit per month (from 10% to 100%) Degree of risk (SuperLow, Low, Medium, High) Stop Loss Limit, USD Set up to work on EURUSD timeframe M15. Works on HEDGING accounts with a leverage of 1:500 and a Deposit from 500USD. Enough for work:
Decide on the size of the deposit that you can trust him
Set the value of the desired profit per month (from 10 to 100 percent) Select the degree of risk (Low, Medi
MetaTrader Market - robots comerciales e indicadores técnicos para los trádres, disponibles directamente en el terminal.
El sistema de pago MQL5.community ha sido desarrollado para los Servicios de la plataforma MetaTrader y está disponible automáticamente para todos los usuarios registrados en el sitio web MQL5.com. Puede depositar y retirar el dinero a través de WebMoney, PayPal y tarjetas bancarias.
Está perdiendo oportunidades comerciales:
- Aplicaciones de trading gratuitas
- 8 000+ señales para copiar
- Noticias económicas para analizar los mercados financieros
Registro
Entrada
Si no tiene cuenta de usuario, regístrese
Para iniciar sesión y usar el sitio web MQL5.com es necesario permitir el uso de Сookies.
Por favor, active este ajuste en su navegador, de lo contrario, no podrá iniciar sesión.