Nuevos robots comerciales e indicadores para MetaTrader 5 - 50
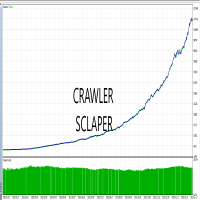
Introducing the powerful Crawler breakout scalper EA with a low-risk approach with no grid or martingale strategies, Crawler EA offers a safe and reliable way to trade the markets. Each order is secured by a stoploss, a takeprofit and profits locked in by a trailstop . Recommended Pairs: EURUSD, USDJPY, and XAUUSD Recommended TimeFrame: H1 Features Low risk approach,*defined per trade* No grid or martingale strategies Trail stop feature to lock pips as and when position moves Easily configur
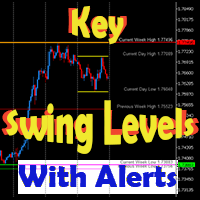
This dynamic indicator will draw the Key Swing High and Low Levels for any symbol on any timeframe!
User may Hide or Show any Level or Label and also Receive Alerts when price returns to that key level via Pop-Up, Push, Email or Sound.
Levels include Current Day High/Low, Previous Day High/Low, Current Week High/Low, Previous Week High/Low and Monthly High/Low.
The Levels are labeled with the Price Point Data Listed next to it for quick easy reference.
You can change the Style, Size an

The Intra Daily Range Projection indicator forecasts the current day’s price range on the basis of the previous day data. All calculations are based on the book “New Science of Technical Analysis” by Thomas R. DeMark.
When you're analyzing investments, the trading range is a valuable analytical tool. The average trading range is the average distance between the high and the low over a specified period of time. You can calculate the average high-low range on a piece of paper, a spreadsheet, o

Phase accumulation adaptive bandpass filter MT5 Indicator is a Metatrader 5 (MT5) indicator and the essence of this technical indicator is to transform the accumulated history data. Phase accumulation adaptive bandpass filter MT5 Indicator provides for an opportunity to detect various peculiarities and patterns in price dynamics which are invisible to the naked eye. Based on this information, traders can assume further price movement and adjust their strategy accordingly.

OPTMIZED BEFORE BACKTEST AND USE King Of Trends trades trends and was made on XAU/USD 1 hour charts. Try other assets and time frames if you can. There is no promise of untold wealth from $100 with 100% success rate , this is a bold lie many tell and believe . Not one EA here or anywhere does this, prove me wrong. In the end nothing is given in trading and you must put in work. Just try out and if it suits you and you want to use it then go ahead and run it on a demo and then a VPS and th

Auto Take Profit MT5 is designed to take profits in automatic way.
As a trader (manual or auto), you define your own expected profits schema. When you open one or several orders, the AutoTP program calculates profits then update into SL or TP automatically. It also re-calculates and updates accordingly for remaining open positions when a new order opened or an existing position closed. ---------------------------------- (Watch live in this DEMO ONLY signal https://www.mql5.com/en/signal

OrderHelper script is super easy and trader friendly to use. It would boost your trading experience. Because it is designed to open one to multiple orders quickly with just one click. Besides using the OrderHelper script, traders can define various parameters for open orders such as the symbol, order type, lot size, stoploss, takeprofit and more. Basically, with this script traders can manage their open orders more efficiently and save their trading time. OrderHelper manages:
Open the number o

¡Usando Pips Pop Up es fácil conocer tus ganancias y pérdidas en pips y puntos!
Cuando este Asesor Experto (EA) está activo, la información básica de la posición cerrada, como el nombre del símbolo, el resultado en pips, y el beneficio o pérdida en su divisa, se muestran en el gráfico al que este EA está vinculado en el momento en que se cierra su posición.
También proporciona parámetros opcionales para cambiar el estilo de fuente, tamaño, color, la ubicación para mostrar los resultados, l
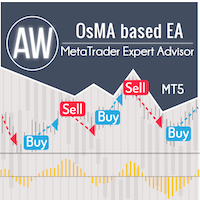
Robot comercial totalmente automatizado. Funciona con las señales del indicador OsMA estándar. Función incorporada de cálculo automático de lotes, multiplicación de volúmenes para apertura de órdenes. Parámetros de indicador personalizables para cálculos de EA. Complementado con sistema de arrastre con paso ajustable. Ventajas: Adecuado para cualquier instrumento y cualquier período de tiempo, Sistema de arrastre incorporado con escalón ajustable, Señales indicadoras personalizables, Se puede ut

Se trata de un servicio de utilidad de órdenes, con el que puede vender, comprar o cruzar órdenes por orden de mercado, estableciendo al mismo tiempo stop-loss (SL) y take-profit (TP). Hay 2 opciones para fijar SL y TP: por puntos o por precio.
Además, con sólo pulsar un botón puede cambiar el SL y el TP de todas sus posiciones del símbolo que se muestra en el gráfico al que está vinculado este Asesor Experto (EA), o cerrarlas también. También proporciona una función para excluir cualquiera d
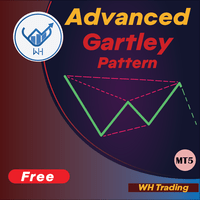
Bienvenido al indicador de reconocimiento de patrones avanzado de Gartley Este indicador detecta el patrón Gartley basado en HH y LL de la estructura de precios y los niveles de Fibonacci, y cuando se alcanzan ciertos niveles de fib, el indicador mostrará el patrón en el gráfico. Versión MT4: WH Advanced Gartley Pattern MT4 **Este indicador es parte del combo Ultimate Harmonic Patterns MT5 , que incluye todo el reconocimiento de patrones.**
Características : Algoritmo avanzado para de
FREE

The TrendChangeZone indicator displays global and local price highs and lows on the chart. The indicator also shows the global trend on the chart and corrective waves. This indicator is designed to determine the direction and change the trend. Most importantly, the indicator shows trend continuation or reversal zones. An indispensable assistant in trading. The indicator does not redraw. The indicator can work on all trading instruments.
Important !!! Top trend if 2 (two) or more b

Defina su propio patrón de velas y este indicador se mostrará en la pantalla cuando aparezca este patrón Puede probarlo gratis en el Probador de estrategias y ver cuántas veces aparece su patrón de velas japonesas en el activo de su elección. También puedes pintar todas las velas de tu patrón o solo una Este indicador es útil para el análisis de velas japonesas, para que lo use en la acción del precio y con estrategias comerciales desnudas. Es un indicador que muestra el movimiento que elijas

(traducción de Google) Este indicador se basa en el “ Volumen segmentado en el tiempo (TSV) ” original desarrollado por Worn Brothers, Inc . Sin embargo, agregué algunas funciones adicionales a esta. Se puede elegir el precio que se aplicará, en lugar de tener solo el precio de cierre predeterminado utilizado por el original. También se puede elegir qué ponderación de volumen usar, incluido un pseudovolumen basado en el rango real, o ninguna ponderación de volumen. (Original text) This indicator
FREE

(Traductor de Google) Este indicador se inspiró en el rango verdadero promedio (ATR) de John Welles Wilder , pero con información adicional. De manera similar, calcula el promedio móvil exponencial del rango real, pero usando el peso alfa estándar en lugar del de Wilder . También calcula la desviación promedio del promedio del rango y la muestra como una compensación. Esto ayuda no solo a identificar un cambio más rápidamente, sino también a su impacto. (Original text) This indicator was inspire
FREE

Noche brillante es un asesor completamente automático para trabajar en el mercado Forex durante las horas tranquilas.
Another 1 copies will be sold for $599. Next price 699$ Seguimiento del trabajo del asesor: https://www.mql5.com/en/users/bayburinmarat/seller Configuración GMT correcta: https://www.mql5.com/en/blogs/post/743531 Como sabemos, últimamente por la noche el diferencial en el mercado Forex se ha ido ampliando, a veces hasta límites irrazonables. A veces, un diferencial puede acabar

Presentamos Position Closer: la solución para los operadores que desean cerrar automáticamente todas las posiciones abiertas cuando alcanzan un objetivo de beneficios o pérdidas.
Ventajas de utilizar Position Closer:
Fácil de usar - sólo tiene que establecer su objetivo de ganancias y pérdidas para todas las posiciones abiertas. Establézcalo una vez - no hay necesidad de establecerlo para cada par de negociación. Manera conveniente de manejar posiciones, especialmente cuando no puede monito

Deer Ma es un robot de trading altamente avanzado diseñado para operar eficientemente en los mercados financieros. Este software completamente automatizado utiliza dos medias móviles y otros indicadores avanzados para analizar los mercados y tomar decisiones comerciales basadas en estrategias de scalping o tendencia . El algoritmo de vanguardia del software asegura que pueda identificar rápidamente y con precisión operaciones, mientras que sus características avanzadas de gestión de dinero le pe

(Traducción de Google) Este indicador se basa en el ZigZag original proporcionado como ejemplo de código fuente con las instalaciones de MetaTrader . Lo reescribí con algunas características adicionales para mostrar el canal de "profundidad" y los desgloses respectivos. También permite observar puntos de zig-zag previos. Opcionalmente, puede alertar al usuario cuando se produzcan brotes. Las alertas pueden ser simplemente en el terminal o también a través de notificaciones push en un dispositivo

SUPERTREND; Es un indicador de seguimiento de tendencias basado en el SuperTrend ATR creado por Olivier Seban. Se puede utilizar para detectar cambios en la dirección de la tendencia y localizar paradas. Cuando el precio cae por debajo de la curva del indicador, se vuelve rojo e indica una tendencia bajista. Por el contrario, cuando el precio se mueve por encima de la curva, el indicador se vuelve verde, lo que indica una tendencia alcista. Al igual que otros indicadores, funciona bien en SuperT
FREE

ESTA ES LA VERSIÓN GRATUITA DE LOS NIVELES AVANZADOS DE PRICE ACTION
gratis por un mes pero en cuenta demo.
producto completo: https://www.mql5.com/en/market/product/94338 Niveles precisos de soporte y resistencia horizontal Preciso para el análisis de la acción del precio. Todos los mercados: divisas, acciones, índices, metales, materias primas y criptomonedas Disponible para metatrader 5 Parámetros ajustables creo que eso es todo
Háblame por telegrama: @ https://t.me/Userrrrrrrrrname
FREE

Quantum is a High Frequency EA with relatively lower risk. It trades tens of trades per day but generally the max drawdown is below 15%.
MT5 Version
======== Usage======== :
Symbol: Any Main pairs Timeframe: M15 or higher Recommend Lots: 0.01 per 2000 USD
Note: Grid strategy is alwasy with some risk due to the increasely accumulated risky lots. but the high profit makes such strategy still being popular no matter how forex industry developed.
this is why we spent many years on rese
FREE

Fully automated expert advisor. It was developed for quick overclocking of the deposit.
It has a minimum of settings, which makes it easier to set up and speed up the optimization of the EA if necessary. The same settings are used for long and short positions. Thus, the Expert Advisor works equally in both directions. All orders are set with the TakeProfit parameter. And this guarantees the closing of transactions regardless of the quality of the Internet.
My recommendations:
Using a le
Trading strategy: Scalping. Trading on impulses in automatic trading has been used for a long time and the scheme is not new to traders. It is difficult to catch such moments manually, but the adviser copes instantly. Automated trading uses 2 approaches to trade in such cases: look for pullbacks after impulses. trade in the direction of momentum. The search for entry points is done like this: the adviser measures the rate of price change for which this change should occur, if the conditions for
This indicator will identify when Fast Moving Averages (EMA, SMA, or LW) cross Slow Moving Average lines on any timeframe and with any symbol.
When the moving averages cross and price close above or below the crossing, the User will receive an alert via pop-up, push, or email.
Choose any two Moving Averages to cross to receive an alert and the Indicator will also paint the Moving Average Lines and Arrows.
You can choose Exponential Moving Averages (EMA). Simple Moving Averages (SMA) or Lin

" Outro " es un experto en trading automatizado " multi símbolo " que requiere que el trader realice pruebas en el par de su elección y modifique las entradas según su conveniencia. Este Asesor Experto ha sido diseñado con entradas no optimizadas, y utiliza un sistema Martingala para la gestión de riesgos. Es muy importante leer la publicación del blog antes de comenzar. Entra al grupo privado. Outro utiliza dos indicadores principales, Índice de Fuerza Relativa y el Oscilador estocástico ,
FREE
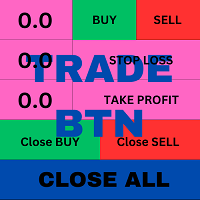
T his is an ON CHART trade management panel. In other words, ON CHART Lot Size, Buy, Sell, Stop Loss, Take Profit, Close Buy, Close Sell and Close All buttons! *IMPORTANT NOTE: Input settings are NOT usable. You can change or insert Stop Loss and Take Profit values only on the chart panel. (See the below video!) This one is MT5 version!
BUTTONS List: 1. Lot Size - (0.01) is default click on it and insert the lot size with which you want to open a trade. 2. Stop Loss - (0.0) is default click on
FREE

Perfect Sniper ! es un indicador triple con deteccion de soporte resistencia , canal de tendencia bajista, canal de tendencia alcista Bandas incluidas ! donde caza los rebotes en las lineas rojas marca venta , en las lineas verdes marca compra , en las bandas de mas abajo que son los quiebres da otra segunda entrada sea buy o sell , perfecto para aprobechar la doble entrada , se usa en cualquier temporalidad , sirve para hacer scalping y largos en h1 o h4 asta D1 . Sirve para los merc

BandSniper ! indicador de bandas , programado %100 para cazar rebotes sobre las bandas tanto rebote para la baja como rebote para el alza ,, sirve para cazar tendencias tambien ! donde bien se ve en la foto marcado con flechas las señales de compra y venta . se puede usar en cualquier temporalidad , ideal para hacer scalping y largos de h1 o h4 ! sirve para todos los pares de Forex ! y para todos los pares de indices sinteticos ! World Inversor . Good Profit .
One of the basic needs of every trader is to have a checklist to enter every position. Of course, using pen and paper may not be convenient forever. With this indicator, you can have a small checklist next to the screen for each of your charts and use it for better use in your trades.
By pressing the r button, you can return everything to the original state.
MT4 Version
This indicator will have many updates and special settings will be added to it.
You can contact us via Instagram, Telegram
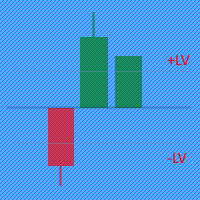
The Price Movement Strength indicator displays the direction and strength of the price change in the form of a candle on each price bar. If the indicator shows the closing level of the candle equal to zero on the current bar, then the price has not changed during bar. If the indicator shows a green candle, then the price of the trading instrument is growing, and vice versa, a red candle signals a price fall. Input parameters: The indicator has two parameters for setting buy/sell levels: BuyLevel

Función de línea : Muestra en el gráfico la línea de apertura, Stop Loss, Take Profit( 3:1 RR ).
Gestión de riesgos : La función de cálculo de riesgos calcula el volumen de una nueva orden teniendo en cuenta el riesgo establecido y el tamaño que se desea arriesgar. Le permite establecer cualquier tamaño de Stop Loss entre 3 y 10 pips.
Botón Breakeven : Lleva todas las ordenes abiertas a Breakeven.
Boton Clea r: Limpia el grafico y los parametros seleccionados.
Boton Trade : Ejecutar la

Trend Fibonacci is a unique indicator that combines a power of Fibonacci sequences and ranges. Channel Group: Click Here
How to read:
- There are three zones --> red, gold and green
- Red candlestick = downtrend
- Green candlestick = uptrend
- Gold candlestick = no established trend
Inputs: Per = number of bars used for calculations FirstRatio = first Fibonacci ratio (Or use any ratio you want) SecondRatio = second Fibonacci ratio (Or use any ratio you want)
!! IF YOU PURCHASE TH
FREE

P Booster Pro is the developed version of P Booster. Pro version allows adjusting 5 parameters: - RiskPerc: p ercent of the biggest lot that is available according to equity. - PriceFellPercent: difference between the choused candle ( WhichCandleM15From ) and the Candle 1 price in percent. - StopLossLevel: Stop loss level in percent point. For example: 30 = 99,7% of the Ask price. - WhichCandleM15From: M15 Candle ID from where the expert will check the PriceFellPercent level and compare it with

Máquina Trader Tendência Count on our trend tracker to carry out your operations on the Mini Index and the Mini Dollar!!! Operational Green is BUY and Pink is SELL!!! Enter the operation after closing the first color block!!! Developed and Tested on the 5 or 15 minute Chart for Mini Index and Mini Dollar!!! Can be used on any chart!!! Editable colors and period!!!
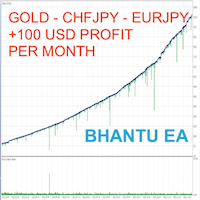
Bhantu is revolutionary trading bot software that seeks to revolutionize the way you trade. It offers a suite of features that can help you maximize your profits in the market. Bhantu's advanced algorithms and automated strategies are designed to analyze and monitor the market, ensuring you always get the best results. Software that can automatically manage your trades in stocks, currencies and other financial products in your trading account based on your preferences. It is based on a combinati

Have you ever wanted to back-test a strategy but never wanted to risk real money? And the thought of using a demo account is exhausting as real time markets develop your skills slowly. This utility will help you develop your strategy faster and will help determine if the strategy works long-term by simulating real trading through back-tests. This will save you time as you can back-test strategies from previous price data. With the new update you can now change your lot-size add take-profit and
FREE

The CCI Trend Dashboard is an advanced technical analysis tool available that provides a dashboard interface for traders to analyze multiple symbols and timeframes at once. It uses the Commodity Channel Index (CCI) in combination with currency strength and volumes to analyze market trends. The tool is user-friendly and suitable for both beginner and advanced traders. Note: The values are derived from the CCI values of the respective symbol and timeframe using the specified period from the sett

This is a rate of change chart from the baseline. features. comparison of max 5 symbols. free baseline with drag. free timeframes of the sub window. reverse chart selectable if you need.
i.e. set symbols "-US100" notes In the sub window, you can't believe datetime on the chart, because the numbers of bars are different. You can check the baseline if you click symbol name. The dragged baseline is temporary. You must set it to indicator's parameter if you need.
FREE

MAGIC BC TRADER
10 copy 49$ Next Price 99 Last Price 500$
Magic BC Trader can be work with any pair and broker
BEST BROKER EXNESS (Pro Account)
BEST PAIRS BOOM 500 - BOOM 1000 - CRASH 500 - CRASH 1000 EURUSD - AUDUSD - GBPUSD - NZDUSD
OPBUY : TRUE/FALSE ) if true then EA will open BUY trades
OPSELL : TRUE/FALSE ) if true then EA will open SELL trades LOTS : set your starting lot size
INDICATOR SETTING :- can be control from setting or you can let it default if you dont know

The awesome oscillator is a technical indicator that is used within the financial markets to confirm or disprove trends on price charts. These charts compare current data to historic data with the aim of predicting momentum in the markets. The expert relies on this indicator.
The EA is based on the step: 0.0025 with the possibility of constant correct. (see inputs parameters: Round level correction)
1.6000-------------------------------------------------------------------------------------
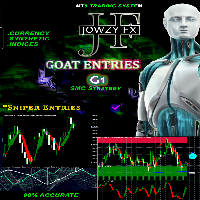
Jowzy Fx G1 is the indicator designed to detect swings in the direction of the trend and possible reversal swings. The indicator studies several price and time vectors to track the aggregate trend direction and detects situations in which the market is oversold or overbought and ready to correct. This indicator shows Swing that is a strong hint for an excellent entry point and finds immediately with alarm and notification and also has stop loss and entry point with candlestick checking for eas
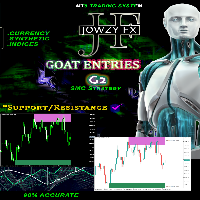
Jowzy Fx G2 support or resistance levels are formed when a market’s price action reverses and changes direction, leaving behind a peak or trough (swing point) in the market. Support and resistance levels can carve out trading ranges. The indicator identifies the Swing High and Swing Low based on X amount of bars ( Period ) defined in the indicator set.
Main Features: Detect the best and most successful point of trend or reversal trend
Easy-to-use and user-friendly indicator NO repaint Scan
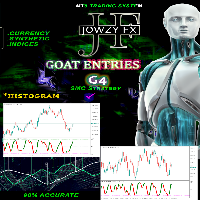
Jowzy Fx G4 indicator is a universal tool, suitable for scalping and medium-term trading. This indicator uses an innovative formula and allows you to determine the direction and strength of the trend. is not redrawn, so you can evaluate its efficiency using history data. suitable for M5, M15, M30, H1 and H4 is perfect for all Meta Trader symbols: currencies, metals, cryptocurrencies, stocks and indices
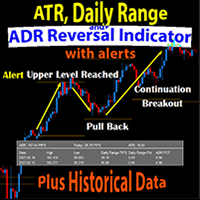
The Daily Range ATR ADR Reversal Indicator shows you where price is currently trading in relation to its normal average daily range. You will received alerts via pop-ups when price exceeds its average daily range. This will enable you to identify and trade pullbacks and reversals quickly.
The Indicator also shows you the Daily Range of Price for the current market session as well as previous market sessions. It shows you the ATR which is the average range of pips that a candle may move in that
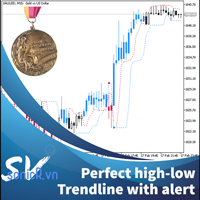
This indicator calculate trendline base on high, low of two period: fast and slow. From that, we have two line for fast signal and low signal. We tested many time on many assets, in most case, when fast signal crossup slow signal, price going up and vice verser. We also add alert function when two signal line crossed. For most effecient, user can change fast and slow period in setting. This indicator is good advice for price move. It better when combine with other trend indicator. For me, i us

An oscillator that shows price changes and identifies areas of overbought and oversold. It can also show trend reversal points. WaveTrend Oscillator is a port of a famous TS /MT indicator. When the oscillator is above the overbought band (red lines) and crosses down the signal (solid line), it is usually a good SELL signal. Similarly, when the oscillator crosses above the signal when below the Oversold band (green lines), it is a good BUY signal. Good luck.

Flags and pennants can be categorized as continuation patterns. They usually represent only brief pauses in a dynamic market. They are typically seen right after a big, quick move. The market then usually takes off again in the same direction. Research has shown that these patterns are some of the most reliable continuation patterns. Bullish flags are characterized by lower tops and lower bottoms, with the pattern slanting against the trend. But unlike wedges, their trendlines run parallel.

This indicator allows you to measure retracements of price between any two points in either direction. It displays the price points, percentages and also displays the extension levels.
User may Modify and Add addition levels and extensions." User may also Add multiple Fibonacci indicators on the chart and change their colors, style and sizes.
Can be used on any timeframe.
This is the only Fibonacci Tool you'll need to measure and trade on Structure.
MT4 Version Available as well.
ADDI
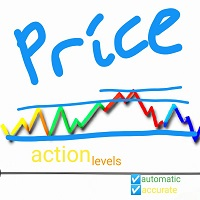
Accurate horizontal support and resistance levels Accurate for price action analysis. All Markets: forex, stocks, indices, metals, commodities ,and crypto Available for meta trader 5 Adjustable parameters I think that's it inputs: For multiple timeframe analysis: adjust "analysis_timeframe" accordingly "depth_of_retrenchments" represents how big the peaks or troughs are. "lookback " represents the most recent number of candlesticks to consider "linecolor " is the color of the lines "lineweig

Renkus Gladiator é um robô de negociação automatizada que utiliza gráficos Renko para análise de tendências e emissão de ordens limit de compra e venda. Com a definição do tamanho do brick (box ou R), é possível determinar a quantidade necessária para confirmar a tendência de alta ou baixa, sem martingale e scalping. Além disso, é possível configurar os stops como dinâmicos (com base no tamanho dos candles) ou fixos (com valores definidos de ganhos e perdas), bem como a posição das ordens limit

About the Bollinger Bands
The Bollinger Bands indicator was invented by John Bollinger in the 1980s. The Bollinger Bands consist of a Moving Average, an Upper and a Lower Band and is included in Metatrader 5. The default settings are 20 for the period and 2 for the deviation. EasyBot Bollinger Bands is an expert advisor developed with the idea to be useful for traders who love to trade using the popular indicator Bollinger Bands. EasyBot Bollinger Bands has very simple trading logic. When the
FREE
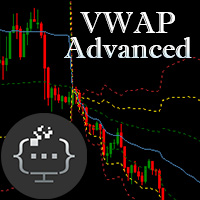
Introducing the Advanced VWAP tool - an essential technical analysis indicator that can help you identify trend directions and locate price extremas with multipliers. Designed to suit the needs of both traders and EA developers, this tool features customizable parameters that allow you to tailor it to your specific trading style. With Advanced VWAP, you have the ability to customize the colors and styles of all bands to your liking. If you don't require any bands, you can simply set their values

A depth of market product is a powerful trading tool that provides a comprehensive view of the supply and demand levels for a particular financial instrument. It provides traders with a real-time display of all the buy and sell orders that are currently available in the market, allowing them to make more informed trading decisions based on the most up-to-date information available. With Valle Depth Of Market , traders can see not only the best bid and ask prices, but also the volume of orders at
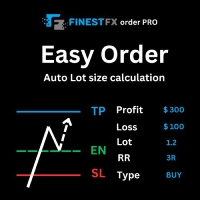
FinestFx order PRO is easy order execution and auto risk management tool developed by FinestFx official Programmer : Mohammed Rafi Just move SL,TP , Entry lines or Type SL,TP on entry columns . Lot are calculated automatically by fill out the loss cut amount. Work with all base currencies Fixed loss amount can be selected. Calculate risk rewards. Market order, limit order, and stop order are selected using buttons Supports FX, CFD, and crypto currency on MT5 Visit the owner website to see it
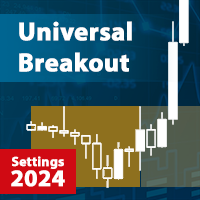
Configuración | Versión MT4 | Indicador de sesiones de negociación Universal Box | FAQ Universal Breakout es un asesor comercial de la clásica estrategia de ruptura de rango de precios . Se puede configurar para cualquier estrategia que implique la salida del precio del corredor de precios , que se establece por un intervalo de tiempo. Por ejemplo : ruptura de los extremos de las sesiones de negociación Asiáticas, europeas o Estadounidenses, ruptura de los extremos diarios o inclus
FREE

El reloj dorado es un nuevo desarrollo con un algoritmo avanzado. Se ajusta automáticamente a los rangos de volatilidad establecidos. Realiza el número medio de transacciones. Es más eficaz en las etapas de consolidación de precios que ocupan la mayor parte del tiempo de mercado. El tipo de cuenta es de cobertura. Funciona en el indicador PeakRepainterStrict. Ideal para los principales pares de divisas y metales.
El monitoreo de operaciones reales, así como mis otros productos, se pueden enco

The Color Candles Indicator uses custom colors to highlight candles that follow the main market trend, based on the Moving Average. This simplifies the analysis of price movements, making it clearer and more direct. When the price is above the rising Moving Average, candles are highlighted indicating a BUY opportunity. When the price is below the declining Moving Average, candles are highlighted indicating a SELL opportunity.
Input Parameters : Period Method Applied Price
The moving avera
FREE

Price DNA es un indicador de tendencia que utiliza medias móviles ponderadas por relación compuesta para reducir los desfases y permitir la detección temprana de tendencias. El indicador no se repinta y puede aplicarse a cualquier instrumento financiero en cualquier marco temporal.
¿Cómo funciona el ADN de precio? El indicador mostrará múltiples ondas en el gráfico, que indican la dirección de la operación actual. Cinco ondas verdes o cinco rojas indican una fuerte tendencia alcista o bajista,

A simple indicator/tool to display the current timeframe in the center of the chart. The object is automatically moved to the center of the chart whenever the chart size is changed by the user.
Input Parameters :
Font (default is Arial Black) Font Size (default is 50) Font Color (default is Silver, for light theme graphics, change to black or another dark color) Font Transparency (default is 90%)
FREE

Time in Trade Expert Advisor aplica la estrategia de abrir órdenes pendientes en el momento especificado, y también utiliza el horario de invierno y verano con cambio automático. Cuando se produce una señal, el robot comercial abre órdenes pendientes con volúmenes iguales para comprar y vender. El marco de tiempo utilizado para el comercio es de 5 minutos. El desencadenante de una orden pendiente es un cambio brusco de precio que depende de: apertura / cierre de sesiones de negociación; publicac
FREE

(traducción de Google) Este indicador implementa el " Promedio Verdadero Rango (ATR) " desarrollado por John Welles Wilder Jr. , como se describe en su libro: Nuevos conceptos en sistemas técnicos de comercio [1978] . Utiliza el promedio móvil de Wilder , también conocido como promedio móvil suavizado (SMMA) , en lugar de un promedio móvil simple (SMA) como se usa en el indicador ATR incorporado de MetaTrader . El período predeterminado aplicado es 7, en lugar de 14, según la descripción en su l
FREE

Presentamos el indicador Trend Enthusiasm (TEI), la herramienta definitiva para maximizar las ganancias en el parqué.
Este indicador innovador combina el poder del análisis de tendencias con la emoción del sentimiento del mercado, brindando a los operadores una ventaja única en los mercados financieros en constante cambio.
El TEI utiliza algoritmos avanzados para analizar la tendencia subyacente de un instrumento financiero y el entusiasmo de los comerciantes para identificar oportunidades

El Panel Todo Poderoso es una herramienta de utilidades diseñada para gestionar tus operaciones. El panel tiene todo lo que necesitas para administrar tus operaciones. Puedes ejecutar operaciones, establecer stop loss y take profit, decidir el tamaño de los lotes, así como cerrar todas las operaciones al mismo tiempo y también establecer todas en punto de equilibrio al mismo tiempo. En el futuro, se añadirá la función de cálculo de riesgos, así como la función de trailing stop. Esta es la versió
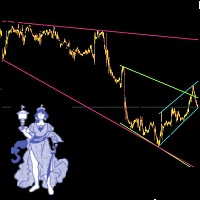
Leave a comment if you would like me to write an EA to trade these trendlines... if enough interest, will write an EA. Automatic Trendlines, updated automatically. To Set up 3 different (or mroe) Trendlines on chart, simply load the indicator as many times and name it differntly.. the example in the picture below is indicator 1 (loaded 1st time): Name: Long, StartBar: 50, BarCount: 500, Color: Pink indicator 2 (loaded 2nd time): Name: Short, StartBar: 20, BarCount: 200, Color: Green indicator 3
FREE

El indicador Crash Wizard funciona en un marco de tiempo de 1 minuto de Crash 500 y Crash 1000 SOLAMENTE. Este indicador trazará una roja (x) en la vela Drop. trazará flechas verdes como señal de entrada de COMPRA y trazará naranja (x) como puntos de salida múltiple. Usted el indicador es 85% Preciso. puede usarlo junto con la acción Price.
NOTA:
Para usar el indicador, asegúrese de tener una cuenta con Deriv, el único corredor de índices sintéticos. NO lo use en ningún otro activo.

FRB Trader - Our mission is to provide the best support to customers through conted and tools so that they can achieve the expected results
FRB Strength - Indicator shows the current strength of the asset between buyers and sellers. - It can only be used by brokerage houses that report data on trading volumes, such as B3. In the forex market it is not possible to use.
FREE
Strategy description The idea is to go with trend resumption. Instruments Backtest on XAUUSD shows profitability over a long period even without any specific optimization efforts. However applying optimization makes it even better.Backtest details: Simulation Type=Every tick(Most accurate) Expert: GoldScalper Symbol: XAUUSD Period: H1 (2020.01.01 - 2023.02.28) Inputs: magic_number=1234 ob=90.0 os=24.0 risk_percent=2.64 time_frame=16385 Company: FIBO Group, Ltd. Currency: USD Initial Deposit: 100
FREE

- Times and Trades, também chamado de Time and Sales ou histórico de negócios, é uma ferramenta essencial para quem opera através do Tape Reading (Fluxo). - O Metatrader 5 não informa os dados das corretoras, sendo assim, impossível diferenciar quem enviou a ordem. - Os dados só podem ser usados por corretoras que informam os dados dos volumes de negociação, como a B3. No mercado forex não é possível usar.
FREE

Provided Trend is a complex signal formation indicator. As a result of the work of internal algorithms, you can see only three types of signals on your chart. The first is a buy signal, the second is a sell signal, and the third is a market exit signal.
Options: CalcFlatSlow - The first parameter that controls the main function of splitting the price chart into waves. CalcFlatFast - The second parameter that controls the main function of splitting the price chart into waves. CalcFlatAvg - Par
MetaTrader Market ofrece a todos los desarrollador de programas de trading una sencilla y cómoda plataforma para ponerlos a la venta.
Le ayudaremos con la presentación y explicaremos cómo preparar la descripción de su producto para el Market. Todos los programas que se venden a través del Market están protegidos por una codificación adicional y pueden ser iniciados sólo en el ordenador del comprador. La copia ilegal es imposible.
Está perdiendo oportunidades comerciales:
- Aplicaciones de trading gratuitas
- 8 000+ señales para copiar
- Noticias económicas para analizar los mercados financieros
Registro
Entrada
Si no tiene cuenta de usuario, regístrese
Para iniciar sesión y usar el sitio web MQL5.com es necesario permitir el uso de Сookies.
Por favor, active este ajuste en su navegador, de lo contrario, no podrá iniciar sesión.