Nuevos robots comerciales e indicadores para MetaTrader 5 - 178

El programa ChartWall sirve para mostrar y cambiar automáticamente las imágenes del fondo en el gráfico. Se soportan los formatos gráficos JPG y BMP. Hay dos modos para seleccionar el archivo de la imagen y el estilo de visualización: sea al iniciar ChartWall a través del panel estándar de los parámetros, sea a través del panel incorporado. El panel incorporado se abre si hace clic en el icono del programa que aparece en la esquina inferior izquierda del gráfico al situar el cursor sobre este á
FREE

The B150 model is a fully revised version of the Historical Memory indicator with a significantly improved algorithm. It also features a graphical interface what makes working with this perfect tool quick and convenient. Indicator-forecaster. Very useful as an assistant, acts as a key point to forecast the future price movement. The forecast is made using the method of searching the most similar part in the history (patter). The indicator is drawn as a line that shows the result of change of the

This indicator displays Point & Figure charts (PnF charts) in the indicator window. PnF charts show only price movements that are bigger than the specified box size. It helps to eliminate noise and allows focusing on main trends. Time is not a factor here. Only price movements are taken into account. That is why PnF chart is not synchronized with the main chart it is attached to. More about PnF charts: http://stockcharts.com/school/doku.php?id=chart_school:chart_analysis:pnf_charts Indicator wor
FREE
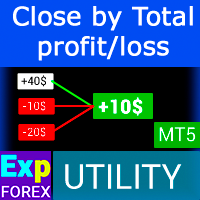
Cerrar posiciones en MetaTrader 5 al alcanzar la ganancia / pérdida total con la función de seguimiento de ganancias. CloseIfProfitorLoss con seguimiento Puede habilitar las paradas virtuales (orden separada) , cálculo y cierre para posiciones de COMPRA y VENTA por separado (COMPRA VENTA separada) , cerrar y calcular todos los símbolos o solo el símbolo actual (Todos los símbolos) , habilitar trailing con fines de lucro ( Trailing Profit) Las posiciones se cierran en función d

DLMACD - Divergence Local (Wave) MACD . The indicator displays divergences by changing the color of the MACD histogram. The indicator is easy to use and configure. It was created as an addition to the previously published DWMACD . For the calculation, a signal line or the values of the standard MACD histogram can be used. You can change the calculation using the UsedLine parameter. It is advisable to use a signal line for calculation if the histogram often changes directions and has small val
FREE
Attention: You can view the program operation in the free version IShift Lite DEMO . IShift Lite is utility for trading directly from the depth of market. IShift Lite allows: - perform trade operations directly from the DoM with a "single touch";
- easily move your orders in the DoM:
- automatically place Stop Loss and Take Profit;
- Place limit order as Take Profit;
- move position to breakeven;
- automatically move Stop Loss along the price;
- calculate the volume of an order d

The Price Channel indicator drawn using a tick chart. After launching it, wait for enough ticks to come. Parameters: Period - period for determining the channel boundaries. Price levels count - number of displayed price levels (no levels are displayed if set to 0). Bar under calculation - number of bars on the chart for the indicator calculation. Buffer indexes: 0 - Channel upper, 1 - Channel lower, 2 - Channel median.
The Williams' Percent Range (%R) indicator drawn using a tick chart. After launching it, wait for enough ticks to come. Parameters: WPR Period - period of the indicator. Overbuying level - overbought level. Overselling level - oversold level. Сalculated bar - number of bars for the indicator calculation. The following parameters are intended for adjusting the weight of WPR signals (from 0 to 100). You can find their description in the Signals of the Williams Percent Range section of MQL5 Referen
The Average True Range (ATR) indicator drawn using a tick chart. After launching it, wait for enough ticks to come. Parameters: ATR Period - number of single periods used for the indicator calculation. The number of ticks to identify Bar - number of single ticks that form OHLC. Price levels count - number of displayed price levels (no levels are displayed if set to 0 or a lower value). Сalculated bar - number of bars for the indicator calculation.

El indicador dibuja dos media móviles simples usando los precios High y Low. La línea MA_High se muestra cuando la media móvil se dirige hacia abajo. Se puede utilizarla para colocar la orden Stop para la posición de venta. La línea MA_Low se muestra cuando la media móvil se dirige hacia arriba. Se puede utilizarla para colocar la orden Stop para la posición de compra. Este indicador se utiliza en el Asesor Experto TrailingStop . Parámetros Period - período de cálculo de la media móvil. Deviati
FREE

This tick indicator draws synthetic bars/candlesticks that contain a definite number of ticks. Parameters: option prices - price option. It can be Bid, Ask or (Ask+Bid)/2. the number of ticks to identify Bar - number of ticks that form OHLC. price levels count - number of displayed price levels (no levels are displayed if set to 0 or a lower value). calculated bar - number of bars on the chart. Buffer indexes: 0 - OPEN, 1 - HIGH, 2 - LOW, 3 - CLOSE.
FREE
The Heiken Ashi indicator drawn using a tick chart. It draws synthetic candlesticks that contain a definite number of ticks. Parameters: option prices - price option. It can be Bid, Ask or (Ask+Bid)/2. the number of ticks to identify Bar - number of ticks that form candlesticks. price levels count - number of displayed price levels (no levels are displayed if set to 0 or a lower value). calculated bar - number of bars on the chart. Buffer indexes: 0 - OPEN, 1 - HIGH, 2 - LOW, 3 - CLOSE.
DWMACD - Divergence Wave MACD . The indicator displays divergences by changing the color of the MACD histogram. The indicator is easy to use and configure. For the calculation, a signal line or the values of the standard MACD histogram can be used. You can change the calculation using the UsedLine parameter. It is advisable to use a signal line for calculation if the histogram often changes directions and has small values, forming a kind of flat. To smooth the histogram values set the signa

According to Bill Williams' trading strategy described in the book "Trading Chaos: Maximize Profits with Proven Technical Techniques" the indicator displays the following items in a price chart: 1.Bearish and bullish divergent bars: Bearish divergent bar is colored in red or pink (red is a stronger signal). Bullish divergent bar is colored in blue or light blue color (blue is a stronger signal). 2. "Angulation" formation with deviation speed evaluation. 3. The level for placing a pending order (

This indicator is used to indicate the difference between the highest and lowest prices of the K line, as well as the difference between the closing price and the opening price, so that traders can visually see the length of the K line. The number above is the difference between High and Low, and the number below is the difference between Close and Open. This indicator provides filtering function, and users can only select K lines that meet the criteria, such as positive line or negative line.

Most time the market is in a small oscillation amplitude. The Trade Area indicator helps users to recognize that time. There are 5 lines in this indicator: Area_high, Area_middle, Area_Low, SL_high and SL_low. Recommendations: When price is between Area_high and Area_Low, it's time to trade. Buy at Area_Low level and sell at Area_high level. The SL_high and SL_low lines are the levels for Stop Loss. Change the Deviations parameter to adjust SL_high and SL_low.
The Bulls Power indicator drawn using a tick chart. After launching it, wait for enough ticks to come. Parameters: Period - period of averaging. The number of ticks to identify high/low - number of single ticks for determining high/low. Calculated bar - number of bars for the indicator calculation. The following parameters are intended for adjusting the weight of Bulls Power signals (from 0 to 100). You can find their description in the Signals of the Bulls Power oscillator section of MQL5 Refer
The Bears Power indicator drawn using a tick chart. After launching it, wait for enough ticks to come. Parameters: Period - period of averaging. The number of ticks to identify high/low - number of single ticks for determining high/low. Calculated bar - number of bars for the indicator calculation. The following parameters are intended for adjusting the weight of Bears Power signals (from 0 to 100). You can find their description in the Signals of the Bears Power oscillator section of MQL5 Refe

This indicator is used to compare the relative strength of the trade on the chart against the other two selected symbols. By comparing the price movement of each traded variety based on the same base day, three trend lines of different directions can be seen, reflecting the strong and weak relationship between the three different traded varieties, so that we can have a clearer understanding of the market trend. For example, you can apply this indicator on a EurUSD chart and compare it with curre
The Moving Average Convergence/Divergence(MACD) indicator drawn using a tick chart. After launching it, wait for enough ticks to come. Parameters: Fast EMA period - indicator drawn using a tick chart. Slow EMA period - slow period of averaging. Signal SMA period - period of averaging of the signal line. calculated bar - number of bars on the chart for the indicator calculation. The following parameters are intended for adjusting the weight of MACD signals (from 0 to 100). You can find their desc
The Stochastic Oscillator indicator is drawn on the tick price chart. After launching it, wait for enough ticks to come. Parameters: K period - number of single periods used for calculation of the stochastic oscillator; D period - number of single periods used for calculation of the %K Moving Average line; Slowing - period of slowing %K; Calculated bar - number of bars in the chart for calculation of the indicator. The following parameters are intended for adjusting the weight of signals of the
The Commodity Channel Index(CCI) indicator drawn using a tick chart. After launching it, wait for enough ticks to come. Parameters: period - number of single periods used for the indicator calculation. calculated bar - number of bars for the indicator calculation. The following parameters are intended for adjusting the weight of CCI signals (from 0 to 100). You can find their description in the Signals of the Commodity Channel Index section of MQL5 Reference. The oscillator has required directio
The Moving Average of Oscillator(OsMA) indicator drawn using a tick chart. After launching it, wait for enough ticks to come. Parameters: Fast EMA period - fast period of averaging. Slow EMA period - slow period of averaging. Signal SMA period - period of averaging of the signal line. calculated bar - number of bars for the indicator calculation.
The Standard Deviation (StdDev) indicator drawn using a tick chart. After launching it, wait for enough ticks to come. Parameters: Period - period of averaging. Method - method of averaging. calculated bar - number of bars for the indicator calculation.

The Momentum indicator drawn using a tick chart. After launching it, wait for enough ticks to come. Parameters: period - period of the indicator calculation. levels count - number of displayed levels (no levels are displayed if set to 0) calculated bar - number of bars for the indicator calculation.
The script is designed to analyze deals history of a signal exported to a csv-file from its page. The exported file of the studied signal must be placed in the terminal data folder\MQL5\FILES\. The script displays deals for the current chart symbol to which it is applied. In a separate window a short trading report will be created either on the current symbol deals, or on all the deals. There is a possibility to save the report in an htm-file (Shift+H). The script parameters: signal csv-file nam

A simple tick indicator of Bid and Ask prices. The period separator (1 minute) is displayed as a histogram. Parameters Show Bid Line - show/hide the Bid line; Show Ask Line - show/hide the Ask line; Show Labels - show/hide the last price values.
FREE

The Bollinger Bands indicator drawn using a tick chart. After launching it, wait for enough ticks to come. Parameters: Period - period of averaging. Deviation - deviation from the main line. Price levels count - number of displayed price levels (no levels are displayed if set to 0). Bar under calculation - number of bars on the chart for the indicator calculation. Buffer indexes: 0 - BASE_LINE, 1 - UPPER_BAND, 2 - LOWER_BAND, 3 - BID, 4 - ASK.

The Relative Strength Index indicator drawn using a tick chart. After launching it, wait for enough ticks to come. Parameters: RSI Period - period of averaging. overbuying level - overbought level. overselling level - oversold level. calculated bar - number of bars on the chart for the indicator calculation. The following parameters are intended for adjusting the weight of RSI signals (from 0 to 100). You can find their description in the Signals of the Oscillator Relative Strength Index section
The Envelopes indicator drawn using a tick chart. After launching it, wait for enough ticks to come. Parameters: Averaging period - period of averaging. Smoothing type - type of smoothing. Can have any values of the enumeration ENUM_MA_METHOD . Option prices - price to be used. Can be Ask, Bid or (Ask+Bid)/2. Deviation of boundaries from the midline (in percents) - deviation from the main line in percentage terms. Price levels count - number of displayed price levels (no levels are displayed if
The Average Directional Movement Index indicator drawn using a tick chart. After launching it, wait for enough ticks to come. Parameters: Period - period of averaging. Сalculated bar - number of bars on the chart for the indicator calculation. Buffer indexes: 0 - MAIN_LINE, 1 - PLUSDI_LINE, 2 - MINUSDI_LINE.

The CloseByPercentLossOrProfit Expert Advisor closes all positions as the total profit of loss for the entire account reaches a specified value. The profit or loss is specified as percentage of the account balance. In addition, the Expert Advisor can delete pending orders. Allow AutoTrading before running the Expert Advisor. Instructions: Run the Expert Advisor on the chart. Input parameters: Language of messages displayed (EN, RU, DE, FR, ES) - the language of output messages (English, Russian,
FREE

The CloseByPercentLossOrProfit Expert Advisor closes some positions as the total profit of loss for the entire account reaches a specified value. The profit or loss is specified as percentage of the account balance. In addition, the Expert Advisor can delete the pending orders. Allow AutoTrading before running the Expert Advisor. Instructions: Run the Expert Advisor on the chart. Input parameters: Language of messages displayed (EN, RU, DE, FR, ES) - the language of output messages (English, Rus

AABB - Active Analyzer Bulls and Bears is created to indicate the state to what extent a candlestick is bullish or bearish. The indicator shows good results on EURUSD H4 chart with default settings. The Strategy of the Indicator When the indicator line crosses 80% level upwards, we buy. When the indicator line crosses 20% level downwards, we sell. It is important to buy or sell when a signal candlestick is formed. You should buy or sell on the first signal. It is not recommended to buy more as w

CloseByLossOrProfit Expert Advisor closes all positions as their total profit or loss reaches a specified value (in deposit currency). In addition, it can delete pending orders. Allow AutoTrading before running the Expert Advisor. Usage: Run the Expert Advisor on a chart. Input Parameters: Language of messages displayed (EN, RU, DE, FR, ES) - language of the output messages (English, Russian, German, French, Spanish); Profit in the currency - profit in points; Loss in the currency - loss in p
FREE

A script for opening a grid of orders If you need to quickly open several pending orders on a certain distance from the current price, this script will save you from routine! Allow AutoTrading before running the script. Instructions: Run the script on the chart. This script is a limited version of the market product https://www.mql5.com/en/market/product/635 and allows opening only Buy Stop orders. Input parameters are not required in the script. Parameters such as number of orders, order type,
FREE

A script for quick reversing positions and/or orders. If you need to reverse a position with the same volume, open an opposite position of a different volume, this script will save you from routine! Allow AutoTrading before running the script. Instructions: Run the script on the chart. This script is a limited version of the market product https://www.mql5.com/en/market/product/638 and allows reversing only positions. Input parameters are not required. Parameters such as changing the type of exi
FREE

CloseByLossOrProfitTune Expert Advisor closes a part of position as the total profit or loss for specified symbols reaches a specific value. The profit or loss level is specified in the deposit currency. In addition, the Expert Advisor can delete pending orders. Allow AutoTrading before running the Expert Advisor. Usage: Run the Expert Advisor on a chart. Input Parameters: Language of messages displayed (EN, RU, DE, FR, ES) - language of the output messages (English, Russian, German, French, Spa

Esta herramienta profesional de los mejores corredores de bolsa ahora está disponible en la plataforma MetaTrader 5 . El indicador Actual depth of market chart visualiza la Profundidad del Mercado (DOM, por sus siglas en inglés) en forma del histograma que se coloca en el gráfico del precio y se actualiza en tiempo real. ¡Atención! ¡La actualización reciente ha sido hecha a petición de nuestros usuarios!
Ahora el indicador Actual Depth of Market visualiza la relación actual de los volúmenes de

ACPD – «Auto Candlestick Patterns Detected» - The indicator for automatic detection of candlestick patterns. The Indicator of Candlestick Patterns ACPD is Capable of: Determining 40 reversal candlestick patterns . Each signal is displayed with an arrow, direction of the arrow indicates the forecast direction of movement of the chart. Each caption of a pattern indicates: its name , the strength of the "S" signal (calculated in percentage terms using an empirical formula) that shows how close is t

TTMM – "Time To Make Money" – Time When Traders Makes Money on the Stock Exchanges The ТТММ trade sessions indicator displays the following information: Trade sessions: American, European, Asian and Pacific. (Note: Sessions are displayed on the previous five days and the current day only. The number of days may change depending on the holidays - they are not displayed in the terminals. The sessions are also not displayed on Saturday and Sunday). The main trading hours of the stock exchanges (tim

Good day, ladies and gentlemen. What I offer is a pane that allows trading in any direction with a single mouse click, as well as setting stop loss and take profit automatically without your interference according to predefined values (this function can be disabled). The pane is implemented as an Expert Advisor, the buttons are located on the right part of the chart. The pane will be useful for scalpers that trade with different risk level and for intraday traders. The pane has been tested on li

Indicador-pronosticador. Es bastante cómodo como un ayudante, actúa como punto de referencia en cuanto al carácter futuro del movimiento del precio. El pronóstico se realiza usando el método de la búsqueda de una parte más similar (en adelante, patrón) en el historial. El indicador se dibuja en forma de una línea que muestra el resultado del cambio de los precios del cierre de las barras. En los ajustes del indicador se puede ajustar la profundidad del historial, número de barras que se someten
FREE

A script for closing positions If you need to quickly close several positions, this script will make all the routine for you! The script does not have any input parameters. Allow AutoTrading before running the script. Usage:
Run the script on a chart. If you need to specify the maximal deviation and the number of attempts to close positions, use the script with input parameters https://www.mql5.com/en/market/product/625 You can download MetaTrader 4 version here: https://www.mql5.com/en/market
FREE

Script for deleting pending orders If you need to delete all pending orders you placed, this script will do it for you! It doesn't have any input parameters. Allow AutoTrading before running the script. Usage:
Run the script on a chart. If you need a possibility to adjust parameters of the script, use the version with input parameters https://www.mql5.com/en/market/product/627 You can download MetaTrader 4 version here: https://www.mql5.com/en/market/product/2782
FREE

A script for closing positions If you need to quickly close several positions, but it requires specifying maximal deviation and the number of attempt to close, this script will do all the routine for you! Allow AutoTrading before running the script. Usage:
Run the script on a chart. Input Parameters: Language of messages displayed (EN, RU, DE, FR, ES) - language of the output messages (English, Russian, German, French, Spanish). Slippage - acceptable slippage when closing. Specified as for 4-d

Script for deleting pending orders If you need to delete all pending orders you placed, this script will do it for you! Allow AutoTrading before running the script. Usage:
Run the script on a chart. Input parameters: Language of messages displayed (EN, RU, DE, FR, ES) - language of messages displayed (English, Russian, German, French, Spanish). Use Magic: (0 - ignore Magic, else - only this Magic) - if set to zero, the magic number is not considered. Otherwise the script deletes only orders wi

A script for opening a grid of orders If you need to quickly open several pending orders (Buy Limit, Sell Limit, Buy Stop, Sell Stop) on a certain distance from the current price, this script will do all the routine for you! Allow AutoTrading before running the script. Usage:
Run the script on a chart. Input Parameters: Language of messages displayed (EN, RU, DE, FR, ES) - language of the output messages (English, Russian, German, French, Spanish). Price for open - open price. If set to 0, the

A script for quick reversing positions and/or orders. If you need to reverse a position with the same volume, open an opposite position of a different volume or change the type of existing orders (for example, Buy Limit -> Sell Limit, Buy Stop -> Sell Limit, etc.) with the same or different take profit/stop loss, this script will make all the routine for you! Allow AutoTrading before running the script. Usage: Run the script on a chart. Input Parameters: Language of messages displayed (EN, RU, D
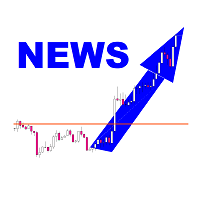
The Expert Advisor trades on market surges, while not using any indicators. The Expert Advisor analyzes the speed of price movement and if the price starts moving faster than the set one, opens a position in the direction of price movement. Trades are closed by SL TP and trailing stop. If the averaging is set to greater than 0, then the stop loss is not set, but new deals are opened with an increased lot and averaged.
Parameters: Lot = 0.1; LevelNewse = 50; strength of the news (price jumps in
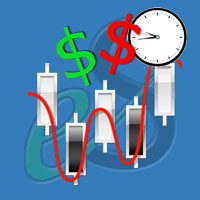
El índice de flujo de dinero es un indicador de múltiples marcos de tiempo que muestra el índice de flujo de dinero de cualquier período de tiempo.
Le ayuda a concentrarse en el flujo de dinero a largo plazo antes de utilizar el flujo de dinero del período de tiempo actual.
Puede agregar tantos índices de flujo de dinero: múltiples períodos de tiempo como desee. Consulte las capturas de pantalla para ver los índices de flujo de dinero M30 / H1 / H4 en la misma ventana, por ejemplo.

This is visualization tool based on the Depth of Market. It works with the symbols that have the Depth of Market available. It's a visual indicator that shows the volume of each Bid/Ask price and ratio of total volume of Bids/Asks. Note: check if your broker supports DOM before purchasing.
。。。。。。。。。。。。。。。。。。。。。。。。。。。。。。。。。。。。。。。。。。。。。。。。。。。 。。。。。。。。。。。。。。。。。。。。。。。。。。。。。。。。。。。。。。。。。。。。。。。。。。。

Ilan para MetaTrader 5 Gracias al uso de las operaciones virtuales ahora es posible tradear en ambas direcciones, es decir comprar y vender simultáneamente. Precisamente eso ha permitido adaptar completamente la estrategia popular al control netting de posiciones que se utiliza en MetaTrader 5.
Ajustes del Asesor Experto Los ajustes del Asesor Experto son muy simples pero permiten regular todos los parámetros importantes de la estrategia. Están disponibles los siguientes ajustes: MagicNumber

Este producto de programa no tiene análogos en el mundo, ya que se trata de un "mando de control" universal de operaciones comerciales, comenzando desde la obtención de las señales comerciales, la automatización de la entrada en la posición, el establecimiento de stop loss y take profit, así como de trailing de beneficio de multitud de transacciones simultáneamente en una ventana abierta. Gestión intuitiva y comprensible del experto en "tres clicks" en la pantalla del monitor, permite utilizar a

El índice de flujo de dinero de Twiggs fue creado por Collin Twiggs. Se deriva del índice de flujo de dinero de Chaikin, pero utiliza rangos reales en lugar de máximos y mínimos para evitar picos debido a brechas. También está utilizando un promedio móvil exponencial suavizado para evitar picos en los volúmenes para alterar los resultados. La media móvil exponencial es la descrita por Welles Wilder para muchos de sus indicadores.
Cuando el índice de flujo de dinero de Twiggs está por encima d

Las principales funciones del indicador es determinar y marcar las siguientes señales en los gráficos basándose en la estrategia “Caos de Trading: Segunda Edición”: La barra divergente (BDB) alcista y bajista con angulación (incluyendo las barras “sentadas” SQUAT). Las barras en la zona roja y verde de acuerdo con el color del histograma del indicador Awesome Oscillator. Las barras “sentadas” Squat en el gráfico independientemente del color del histograma del indicador Awesome Oscillator. Los ni

La media móvil ponderada por volumen (VW-MA) es una media móvil ponderada por volumen.
Los promedios móviles estándar usan precios y simplemente ignoran los volúmenes negociados. El indicador de media móvil ponderada por volumen responde a esto.
Tenga en cuenta que, a diferencia del mercado de valores, el mercado de divisas no está centralizado. Los pedidos y los volúmenes no se comparten entre los corredores. Como consecuencia, los volúmenes utilizados en la media móvil ponderada por volum

Este indicador ha sido diseñado sobre la base del indicador Parabolic SAR. El indicador ayuda al usuario a determinar la dirección de la transacción. En esta utilidad también se ha incorporado la función de notificación acústica al aparecer una nueva señal. También está disponible de manera adicional la función de notificación por email. Su dirección de e-mail, así como los parámetros de su servidor SMTP deberán ser indicados en los ajustes del terminal MetaTrader 5 (pestaña "Correo"). Flecha az
FREE

Este indicador ha sido diseñado a base del indicador Heiken Ashi. Ayuda al usuario elegir la dirección de la operación. Esta utilidad también tiene incorporada la función del aviso sonoro cuando aparece una nueva señal. Aparte, está disponible la función de avisos vía e-mail. Su dirección del e-mail, así como los parámetros del servidor SMTP tienen que estar indicados en los ajustes del terminal MetaTrader 5 (la pestaña "Correo electrónico"). Flecha azul arriba = Compra. Flecha roja abajo = Vent
FREE

El indicador ROMAN5 Time Breakout traza automáticamente los bloques de la ruptura del soporte o resistencia. Permite al usuario elegir la dirección de la operación. Esta utilidad también tiene incorporada la función del aviso sonoro cuando aparece una nueva señal. Aparte, está disponible la función de avisos vía e-mail. Su dirección del e-mail, así como los parámetros del servidor SMTP tienen que estar indicados en los ajustes del terminal MetaTrader 5 (la pestaña "Correo electrónico"). Flecha a
FREE

Este indicador ha sido diseñado a base del indicador Moving Average. Ayuda al usuario a elegir la dirección de la operación. Esta utilidad también tiene incorporada la función del aviso sonoro cuando aparece una nueva señal. Además, está disponible la función de avisos vía e-mail. Su dirección del e-mail, así como los parámetros del servidor SMTP tienen que estar indicados en los ajustes del terminal MetaTrader 5 (la pestaña "Correo electrónico"). Flecha azul arriba = Compra. Flecha roja abajo =
FREE

Este indicador ha sido diseñado sobre la base del indicador Bollinger Bands. El indicador ayuda al usuario a determinar la dirección de la transacción. En esta utilidad también se ha incorporado la función de notificación acústica al aparecer una nueva señal. También está disponible de manera adicional la función de notificación por email. Su dirección de e-mail, así como los parámetros de su servidor SMTP deberán ser indicados en los ajustes del terminal MetaTrader 5 (pestaña "Correo"). Flecha
FREE

La principal función del indicador es determinar y marcar las señales comerciales en el histograma del indicador Awesome Oscillator de acuerdo con las estrategias “Caos de Trading: Segunda Edición” y “Nuevas Dimensiones de Trading” (“Trading chaos: Second Edition” y “New Trading Dimensions”). El indicador detecta y marca las siguientes señales comerciales: “Dos picos” - Divergencia. Señal del “Segundo Sabio” - la tercera barra del histograma Awesome Oscillator después del cambio del color. El hi

Las principales funciones del indicador es determinar y marcar en el histograma del indicador Accelerator Oscillator las señales comerciales que han sido descritas por Bill Williamas en su libro “Nuevas Dimensiones de Trading”. A saber: La señal de compra cuando el histograma del indicador se encuentra por debajo de la línea cero. La señal de venta cuando el histograma del indicador se encuentra por debajo de la línea cero. La señal de venta cuando el histograma del indicador se encuentra por en

This indicator is based on the Fractals indicator. It helps the user identifying whether to buy or sell. It comes with an alert that will sound whenever a new signal appears. It also features an email facility. Your email address and SMTP Server settings should be specified in the settings window of the "Mailbox" tab in your MetaTrader 5. Blue arrow up = Buy. Red arrow down = Sell. Line = Trailing Stop. You can use one of my Trailing Stop products that automatically move the Stop Loss and includ
FREE

.................................. This script is intended to help users to get information about ticks and spreads (e.g. ticks count, minimum/maximum/average spread). It can export reports in the CSV format with this information. Traders can see spread statistics in real time in the chart window It is useful for comparing spreads of different brokers. --------------------------------------------------------------------------

Indicador que muestra la hora de los principales mercados comerciales del mundo. Asimismo, muestra la sesión actual. Es muy sencillo de utilizar. Apenas ocupa espacio en el gráfico. Se puede utilizar junto con asesores y otros paneles, tales como VirtualTradePad . Versión con representación clásica.
Otras características: En los parámetros de entrada de las opciones se dispone de: Mostrar/Ocultar pistas al poner encima el cursor, así como la lengua de las pistas, English / Russian; El botón C
FREE

Este indicador sirve para determinar el tamaño del spread y del swap, los niveles permitidos por el Centro de Operaciones (Dealing Center) para establecer las órdenes Stop y Stop Loss respecto al precio actual, así como el riesgo de un punto en la divisa del depósito. El indicador informa al trader sobre posibles gastos o beneficios adicionales relacionados con el traslado de la posición de un símbolo determinado a la siguiente sesión comercial. También informa sobre el tamaño del spread y la di

The indicator displays the dynamics of forming the daily range in the form of a histogram, and the average daily range for a specified period. The indicator is a useful auxiliary tool for intraday trades.
Settings N Day - period for calculation of the daily range value. Level Indefinite - level of indefiniteness. Level Confidence - level of confidence. Level Alert - alert level. When it is crossed, the alert appears.

The indicator displays the "Three white soldiers and Three black crows" candlestick model on a chart. Three white soldiers are color in blue. Three black crows are colored in red. Input parameters: Max Bars - maximum number of bars calculated on the chart. Make Signal Alert - use alert. Type of pattern rules - use a strict model of determining the pattern (short lower shadows for the three soldiers, short upper shadows for the three crows), or a simplified model. Max Shadow Ratio - coefficient o
MetaTrader Market es el mejor lugar para vender los robots comerciales e indicadores técnicos.
Sólo necesita escribir un programa demandado para la plataforma MetaTrader, presentarlo de forma bonita y poner una buena descripción. Le ayudaremos publicar su producto en el Servicio Market donde millones de usuarios de MetaTrader podrán comprarlo. Así que, encárguese sólo de sus asuntos profesionales- escribir los programas para el trading automático.
Está perdiendo oportunidades comerciales:
- Aplicaciones de trading gratuitas
- 8 000+ señales para copiar
- Noticias económicas para analizar los mercados financieros
Registro
Entrada
Si no tiene cuenta de usuario, regístrese
Para iniciar sesión y usar el sitio web MQL5.com es necesario permitir el uso de Сookies.
Por favor, active este ajuste en su navegador, de lo contrario, no podrá iniciar sesión.