Nuevos robots comerciales e indicadores para MetaTrader 5 - 140
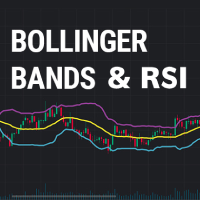
A trending strategy using a combination of two popular indicators Bollinger Bands and RSI provides reliable signals.
The logic of the advisor
Entering a short position is carried out when the price touches the upper Bollinger band, while the RSI indicator should be in the overbought zone, i.e. above level 70. Entering a long position is carried out when the price touches the lower Bollinger band, while the RSI indicator should be in the oversold zone, ie below level 30. It is possible to tr

Limitless MT5 is a universal indicator suitable for every beginner and experienced trader.
works on all currency pairs, cryptocurrencies, raw stocks
Limitless MT5 - already configured and does not require additional configuration
And now the main thing
Why Limitless MT5?
1 complete lack of redrawing
2 two years of testing by the best specialists in trading
3 the accuracy of correct signals exceeds 80%
4 performed well in trading during news releases
Trading rules
1 buy signa

Buy and sell signals based on Joe DiNapoli's shifted 3 period exponential moving average strategy for trend reversals.
Who is he? Joe DiNapoli is a professional trader and author that has been involved in the markets for more than 38 years. He is also a registered Commodity Trading Advisor (C.T.A.) for over 15 years and has taught his techniques in the major financial capitals of Europe, Asia, South Africa, the Middle East, Russia and in the United States.
How does the indicator work? The i

The fundamental technical indicator Ripple, allows you to assess the current market situation in order to enter the market of the selected currency pair in the trend and with minimal risk. It uses in its basis the process of identifying the rate of change in price growth and allows you to find points of entry and exit from the market.
This indicator was created on the basis of the original indicators of the search for extremes, the indicator is well suited for detecting a reversal or a large

MT4 Product URL: https://www.mql5.com/en/market/product/53225 MT5 Product URL: https://www.mql5.com/en/market/product/53226
Special Offer; If you bought both platform products in same day and date, we will give you 40% money back.
Run both terminals on same VPS (Virtual Private Server) Lot size calculation formula = (Bonus/2) / (Spread/50) / 100 Detail Explanation If you have 1000USD deposit in each account for bonus hedging and your broker offered you 10% deposit bonus, in this

EA made using combination of Pending Order and Martingale Strategy. Designed only to work best on Gold Spot M5. EA will put pending orders and on certain condition will create positions with bigger lot. This EA do not use Stop Loss due to the applied strategy. Stop Loss will be replaced using modified Take Profit.
Input Parameters 1. MaxOpenPositions : Define allowed positions can be open by EA, 0 will use default EA Value 2. TotalPendingOrders : Define allowed generated Pending order set, 0

EA designed to generate pending orders based on the trend and designated take profit value. This EA designed exclusively to work best on GOLD SPOT M5 especially during up trend. User can freely decide to close the open position from this EA or wait until take profit hit. No parameters need to be set as it already set from the EA itself. This EA do not use Stop Loss due to the applied strategy. Please do fully backtest the EA on the worst condition before use on the real account. Recommended ini

Description: Never guess again which currency pairs are trending and which ones are not! This indicator shows exactly which currencies are gaining strength and which currencies are losing strength. The indicator can be used to very quickly determine which currency pairs are trending and which currency pairs are in a sideways motion. When one currency is gaining strength and another is losing strength, the corresponding currency pair is trending. Its as easy as that! For instance, if EUR is showi

MultiPairs MT5 is a fully automated Expert Advisor. This expert advisor is based on Multi-currency strategy . This system analyzes the market volatility to find trading signals based on trend reversal strategies and is used to evaluate oversold and overbought market conditions. Swing trading is a short-medium speculation based on the buying-selling force in the trading market with an advantage and low risk with a trend reversal pattern. The Expert Advisor does not use martingale, grids, hedg

Strategy is based on moving average analysis with the Timeframe H1.
It is a combination of powerful trading techniques.
The trading system is suitable for experienced traders and beginner.
The EA allows you to trade with a fixed lot size.
Recommended :
Recommended timeframe is H1.
Minimum account balance: $200.
Default parameters are for EURUSD.
Features :
The EA is not sensitive to spread or broker, you may chose any broker you trust to; The EA is very easy to setup and use.
The best No Nonsense Forex EA for testing and real time trading your NNFX algorithm. This is a demo version, get the full version from mt5.karelnagel.com .
Demo version Full version Test whole NNFX algo Yes Yes Chart testing Partly Yes Multiple pairs One pair at a time All pairs that you need at once Optimization No Yes Strategy tester Yes Yes Live trading No Yes
FREE

The EA has the same trading principle as SMARTHEDGE . We trade simultaneously on drum instruments with high correlation. Transactions made on one instrument compensate for the drawdown of transactions on the other instrument. Thus, we can trade fairly large volumes with relatively low risk. The principle of operation is clearly visible in the video below.
In this expert Advisor, I tried to simplify the settings as much as possible, but left all the main functions from the early development.

Excellent Multiplatform Copier of deals. I use it regularly on VPS (copy from Mt5 to Mt4).
Multiplatform : copying from MetaTrader 4 to MetaTrader 4; copying from MetaTrader 4 to MetaTrader 5; copying from MetaTrader 5 to MetaTrader 4; copying from MetaTrader 5 to MetaTrader 5.
Modes: master - the current terminal is source of trades (deals are copied from it); slave - the current terminal is the receiver of trades (trades are copied to it). from myself - mode "deals multiplier" (use

Great dashboard for market analytics. The panel helps to analyze the values of the Envelopes indicator and prices.
Using this panel you can: watch the current signal from Envelopes for all time frames; watch the current signal from Envelopes by different symbols; look at how far Envelopes is from the price; look at how much the value of Envelopes has changed; several types of signals for analytics.
Values in the table cell: Envelopes value upper line; Envelopes value lower line;
"the

Big summer sale. Save up to 40% on my products. ADR Dashboard - save 9$! The intention of the dashboard is to provide a quick overview of the daily, weekly and monthly range of configured assets. In "single asset mode" the dashboard shows you possible reversal points directly in the chart, thus making statistics directly tradable. If a configured threshold is exceeded, the dashboard can send a screen alert, a notification (to the mobile MT5) or an email. There are various ways of using this in
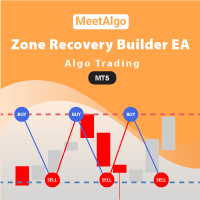
CAP Zone Recovery Strategy Builder EA MT5 is a another version of our Main Product CAP Zone Recovery EA. This EA is a strategy builder type EA has more then 34+ build in indicator that you can make more then 1 million combination strategy that boost you trading strategy. Also this Builder offers an incredible amount of functionality with zone recovery strategy. So you can test your strategy easy way without knowledge of coding. [ Installation Guide | Update Guide | Submit Your Problem

Introduction to Fibonacci Volatility Indicator Volatility indicator can help you to detect any statistical advantage for your trading. Especially, if you are trading with Price Action and Price Patterns, then we recommend to use the Volatility indicator together with your strategy. Especically, Fibonacci Volatility indicator combines the market volatiltiy with Fibonacci Analysis to provide you more advanced volatiltiy indicator. Main Features Fibonacci Volatility in Z score Configuration Mode Fi
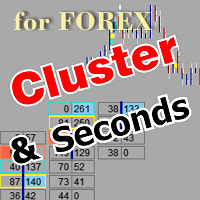
The utility allows you to build different types of graphs: Seconds chart from 1 second to 86400 seconds Tick chart from 1 tick and above The volume chart Delta chart Renko chart Range chart Product demo https://www.mql5.com/ru/channels/clustersecondforex Built-in indicators for volumetric analysis: daily market profile and market profile of the selected timeframe, Cluster Search Imbalance VWAP Dynamic POC, VAH, VAL the profile depth of the market vertical volume with various display options, del

HUBBLE it is a Secure Automated Software for trade Forex market and indices.
The architecture is a Fully Automatic Autonomous Robot Expert capable of
Independently analyzing the market and making trading decisions
HUBBLE It is an advanced trading system. This is a fully automatic Expert Advisor.
HUBBLE It is a 100% automatic system, The system is self-sufficient, performing all the work. Is a revolution in the customization of the trading. You can download the demo and te

BeST_Keltner Channels Strategies MT5 is an MT5 Indicator based on the original Keltner Channels Indicator and it can display in the Chart all the known Variations of Keltner Channels and also the corresponding 10 totally Strategies. Every such generally consists of a Central Moving Average Line and two Boundary Bands at a distance above and below it and can be traded mainly in a Trending Mode but also in a Ranging ReEntry Mode.
BeST_Keltner Channels Strategies Indicator Draws definite Bu

If you like to use traditional Moving Averages (like SMAs and EMAs) to provide your trades for dynamic levels of Support and Resistance, you will love the Adaptive Moving Average (AMA). Created in 1995 by Perry Kaufman and presented to the world in his book " Smarter Trading : Improving Performance in Changing Markets ", the Adaptive Moving Average (also known as KAMA - Kaufman Adaptive Moving Average) has the goal to be the perfect companion for following a trend without noise, but s
FREE

Genesis Robot.
The robot analyzes atypical conditions in the market using optimization algorithms and indicators.
The robot doesn´t use Martingala.
Parameters
The robot only has one configurable parameter. Thus, It is a very easy robot to use
size_lot: This is the lot size of the open positions.
Recommendations for use.
Recomendations for use. The robot is optimized for the Forex market. It is not recommended to use in other markets.
The robot opens few positions per

Qstick is a way to objectively quantify candlestick analysis and improve the interpretation of candlestick patterns. Qstick was developed by Tushar Chande and published in his book " The New Technical Trader - Boost Your Profit by Plugging Into the Latest Indicators (1994) ". Qstick is built based on a moving average of the difference between the Open and Close prices. The basis of the idea is that the Opening and Closing prices are the heart of candlestick analysis. We strongly recommend the re
FREE

Indicator with 3 features
- Clock : Clock independent of the chart, counting continues even when the market is closed.
- Template : After setting up a configuration in any graphic, be it color patterns, indicators, zoom ... The configuration will be copied to all active graphics.
- TimeFrame : Set the TimeFrame on a chart, and with just one click all the active charts will be changed to the same TimeFrame.

The Buffer Reader will help you to check and export the custom indicators buffers data for your current chart and timeframe. You can select the number of buffer and historical bars to read/export. The data can be exported in a CSV format and the files will be stored in the folder: \MQL5\Files .
How it works Put the number of buffers to read in the Buffers_Total input parameter. Put the number of rows to display in the Rows_Total. Choose the CSV separator in the parameter. Copy the correct na
FREE

This indicator is an utility for have always under control, how much time is left at the end of the bar setted.
The utility show on the lower right of the chart, the countdown to the end.
When the remaining seconds is = to the seconds set in the input, the color of remaining seconds on chart, change color and play a warning sound to warn you that the bar is about the end. When the remaining seconds is < to the seconds set in the input, the utility play a beep to warn you that the bar is in
FREE

Utility for show on charts the visual informations about:
- a vertical line at start of each bar of selected timeframe
- a vertical line at start of each day
- a vertical line at start of each week
- vertical lines at start / end of trading sessions selected
- bid / ask prices, spread, money value for each point (of 1 standard lot) and last tick time recived"
You can enable / disable each information and set the color for each line
FREE

Script to create arrows and lines on chart of history positions traded on account for the symbol where you launch the application. From inputs you can select: - Magic number (default is -1; -1 = all magics number) - "From" date and time (default is 1970.01.01 00:00; all positions) - "To" date and time (default is 1970.01.01 00:00; all positions) - Color for buy open positions (arrows and lines between open and close) - Color for buy closing positions (arrows) - Color for sell open positions
FREE

Utility for know all informations and settings of all symbols available on your broker The informations that you can know are for example:
- Spread
- Digits
- Tick value
- Size step
- Size minimum
- Size maximum
- Swap buy and sell
- Margin required (for 1 standard lot)
- Rollover day
- Execution mode
and many other informations You can filter the symbols by group or you can also choose to see the informations only of symbols available on market watch.
FREE

Utility for know all informations and settings of account where the platform is connected The informations that you can know are for example:
- The difference from server time and time of your PC
- The limit orders that you can place at market
- The credit that you have
- The stopout mode of your broker
- The exact name of company of your broker
and other informations
FREE

Script to load on chart the orders, starting from "Signal history report" downloaded from MQL5. If you found a good signal on "Signals" section of this site and you want to see the history orders on chart, you can do it, following this steps: - Download the csv file of history orders - Copy file in the common folder - Launch the script and set the input that are: - Report type (MT4 or MT5) - File name - Delimiter (default is ;) - Name of symbol to load (if symbol on file is for example EURUSDi,
FREE

Utility for know all informations and settings of terminal where the utility is loaded. The informations that you can know are for example:
- The path of folder where the terminal start
- The path of folder where the terminal store the indicators, experts advisors etc
- The path of common folder
- The permission to use DLL, to automated trading etc
- The permission to send email, FTP or notifications to smartphone
and many other informations
FREE

Script to calculate equity and balance at a specific date and time.
This script makes up for a lack of MetaTrader account history, that does not show how the balance and equity changes in time.
Balance calculation includes closed orders only.
Equity calculation includes orders closed before and orders that are still open at the specified time.
Example: date and time set to 2020/07/06 00:00. If I had a Buy 1 lot EURUSD position opened at price 1.12470 on the 2020/07/02, the program woul
FREE

Description :
Combination EA MT5 is a simple Expert Advisor based on Combination MT5 custom Indicator. The Indicator is incorporated in the EA, therefore you don't need it as a separate tool for the EA to operate. Combination MT5 custom Indicator is based on Stochastic Oscillator and Average True Range (ATR), both are set to their default values. If you wish, you can download Combination MT5 custom Indicator for free from my product page .
The Expert Advisor settings are as follows :
Ma
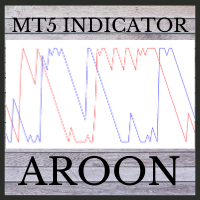
This indicator is powerful for detecting the trend.
The crossing between to line is the entry signal. Buffer 0 is UP line. Buffer 1 is DOWN line. Note: 1. Aroon is great tool for trending detecting. Please try to select the best period for each instrument.
Input AroonPeriod =14- Aroon period
MailAlert =false- Send email when entry signals appeared.
SoundAlert =false- Notify on MT5 platform.

Utility for know the performance of your acoount.
From dialog you can filter data in this modes:
- You can include or not include the open positions - You can include or not the closed positions - You can filter the data by date (from, to) - You can filter the data by simbols (multi selection) - You can filter the data by magic number (multi selection)
On bottom of table, are show the total of:
- Number of data - Total size - Total commissions paid - Total swap paids - Total profits - T

Индикатор построен на основе индикаторов VIX и RSI. Комбинация двух указанных индикаторов позволяет обнаруживать зоны крайней перепроданности, где цена с большой долей вероятности изменит направление. Наиболее сильные сигналы дает в периоды слабого тренда. Сигналом индикатора является изменение направления гистограммы (с роста на снижение) выше заданного (сигнального) уровня.
В индикаторе задан широкий спектр параметров, который позволяет оптимизировать индикатор для торговли любыми активами:

Currency Strength Meter is the easiest way to identify strong and weak currencies. The indicator shows the relative strength of 8 major currencies: AUD, CAD, CHF, EUR, GBP, JPY, NZD, USD.
By default the strength value is normalised to the range from 0 to 100 for RSI algorithm: The value above 60 means strong currency; The value below 40 means weak currency;
The indicator is created and optimized for using it externally at an Expert Advisors or as a Custom Indicator inside your programs.

El enfoque principal en el desarrollo de este EA fue la seguridad al eliminar el riesgo de una gran caída que generalmente se asocia con la mayoría de los sistemas de red en el mercado. El resultado final es un rendimiento mucho mejor que cualquier otro sistema similar. Monitorización en vivo (Señal) Mis señales están configuradas con un riesgo alto en cuentas estándares (no ECN's) donde los spreads suelen ser altos. Esta es mi manera de poner a prueba EA. Mi recomendación para usted siempre ser

Este indicador reconoce un tipo especial de formación de barra interior que está formada por una gran vela maestra seguida de 4 velas más pequeñas (consulte la explicación de la estrategia a continuación). Características Traza las líneas de stop de compra / venta en el gráfico, así como los niveles de toma de ganancias y stop loss. Los niveles de TP / SL se basan en el indicador de rango verdadero promedio (ATR). Los colores de los objetos se pueden cambiar. Le envía una alerta en tiempo real c
Просперадло. PortfolioHedgingStopOrderOneSymbol - asesor de tendencias, para abrir órdenes desde el medio del canal en la tercera ola de Elliot, trabaja en el nivel de ruptura, desde el indicador de ancho de canal personalizado TMA, con s/L y T/P. el Asesor está diseñado para determinar el punto óptimo de entrada al mercado después de la corrección. y creó un experto que, siguiendo la corrección del movimiento general del precio, determina el punto de entrada para continuar la tendencia general

Renko es un gráfico intemporal, es decir, no tiene en cuenta el período de tiempo, sino el cambio de precio, lo que hace que el cambio de precio en el gráfico sea más claro.
Hyper Renko es el indicador que proporciona esto.
Para configurar, solo tiene un parámetro, el tamaño de la vela en la marca * que desea usar.
* tick: es la variación más pequeña posible de un activo.
Gracias por elegir un indicador Hyper Trader.
Wikipedia: Un gráfico de renko indica una variación mínima en el val
FREE

El indicador rastrea la tendencia en 5 tiempos de gráfico diferentes para el mismo activo, en base a 6 señales para cada tiempo de gráfico.
El objetivo principal del indicador es mostrarnos la tendencia mayoritaria del activo financiero en el que se colocó. El sistema transmite la información de las tendencias en varios tiempos gráficos, de esta forma el usuario puede tener una visión amplia del movimiento del activo, este tipo de herramienta hace que el usuario tenga una mayor tasa de acier

El indicador Hyper Force, creado originalmente en 1984 por David Weis, indica en forma de onda la fuerza de la tendencia de un símbolo.
Cuanto más grande es la ola, más fuerte es la tendencia.
Pequeñas olas significan tendencia débil o mercado sin tendencia.
En una ola, cuanto mayor es la diferencia entre una barra y otra, más fuerte es la tendencia.
Cuando la distancia entre una barra y otra comienza a disminuir, significa que la ola ha comenzado a perder su tendencia.
Por lo tanto,
FREE

Representación del valor de intercepcion de la regresión lineal y la desviación absoluta media simétricamente a el valor de intercepcion.
PARÁMETROS Periods: número de periodos para calcular la regresión lineal Amplitude: multiplicador de la desviación media absoluta para definir las bandas Displacement: desplazamiento en el eje horizontal AppliedPrice: precio sobre el cual se realizan los cálculos MainPlot: visualización del plot principal UpperPlot: visualización de la banda superior LowerPl
Representación del valor de pendiente de la regresión lineal. Posee un plot de referencia para determinar visualmente cambios en el valor de pendiente (aceleración/desaceleración del precio).
PARÁMETROS Periods: número de periodos para calcular la regresión lineal PeriodsReference: número de períodos para el cálculo de la media móvil sobre los valores del plot principal Displacement: desplazamiento en el eje horizontal AppliedPrice: precio sobre el cual se realizan los cálculos MainPlot: visu

Great smart dashboard for market analytics.
Using this dashboard you can: find signals from different indicators from all timeframes ; find signals from the Moving Average from all symbols ;
Include: 9 indicators (10 in Mt5 version); 27 signals (29 in Mt5 version); "Total" page.
Indicators and signals: MOVING AVERAGE MA cross Price - MA crosses Price; MA more/less Price - MA higher/lower Price; BOLLINGER BANDS BB crosses Price (in) - Price crosses Bollinger (upper/lower line

The Metatrader 5 has a hidden jewel called Chart Object, mostly unknown to the common users and hidden in a sub-menu within the platform. Called Mini Chart, this object is a miniature instance of a big/normal chart that could be added/attached to any normal chart, this way the Mini Chart will be bound to the main Chart in a very minimalist way saving a precious amount of real state on your screen. If you don't know the Mini Chart, give it a try - see the video and screenshots below. This is a gr

The Mercadulls Indicator gives to you many signals types, detecting supports, resistances and accumulation/distribution zones. The indicator constantly checks the graph for direct analysis and the appearance of long trends. Main characteristics No repaint! Stop loss and take profit levels are provided by the indicator. Suitable for Day Traders, Swing Traders, and Scalpers. Optimized algorithm to increase the accuracy of signals. Technical analysis indicator for all assets available in the m
Conversion of ".set" files created in the MT5 terminal for use in the MT4 terminal. The script is great for cross platform experts.
How to work: place the source files ".set" in the local terminal folder\MQL5\Files run the script the ".set" files for the MT4 terminal appeared in the local terminal folder (the end of the file name "* -MT4.set")
Created on MT5 build 1755 from 18/01/18 Please leave your feedback after using.
FREE

Thread indicator is calculating possible values for the upcoming periods. It is built by author’s system, with ability to learn. Input data ( recommended interval ): Sensitivity to oscillatory motion (integer value, 0 - 8) increase of value shifts priority of calculation towards high-frequency vibrations (increase loads the system) Shift of diagram (integer value, 0 - 8) shifts output of indicator to the right Diagram forecast (integer value, maximum 10) defies the number of periods calculated
FREE

The best time to trade Using this Indicator is when the time reach exactly hour,half,45 minutes,15 minutes and sometimes 5 minutes..
This indicators is helpful to those who trade boom and crash indecies.How to read this indicator first you'll see Blue allow and Red allow all these allows used to indicate or to detect the spike which will happen so the allow happens soon before the spike happen.This indicator works properly only in boom and crash trading thing which you have to consider when
Dragon SuperTrend OB indicator
he Dragon was an indicator developed to capture a new beginning of the trend, it is excellent in Binary Options and Forex and even B3 in the Mini Index and Mini Dolar. It has 4 trend levels in 4 different Times Frames, so you can be sure that you are on the right side of the trend! It is very simple and easy to use, in the end I explain how we will operate with the indicator!
Confirmation modes First Line Trend Confirmations: Green Square Upward Trend. Red Squ

Create and trade timeframes in seconds. The bar time duration is freely adjustable from 1 second and up. The chart is accurately constructed using real ticks from the broker's server. Main characteristics The indicator is an overlay on the main chart, making it possible to utilize one-click trading and on-chart order manipulation. History calculated using real tick data. Built-in technical studies: 4 moving averages (Simple, Exponential, Smooth, Linear-weighted, Volume-weighted using tick or rea

An algorithm to detect a spike instantly with zero lag.. Use default settings for "Crash And Boom" This smart algorithm detects a spike, which can be use to filter out market spikes, give entry signals with exit. Trading:- Booming for Boom and Crashing for Crash
Spike Signal:- The less you decrease the more signals
Multiplier:- This multiplies the Signal
Time Ratio:- For adjusting the Signal
AlertProperties = "====== Alert Properties ======";
SendAlertViaAlertWindow:- if set to true it wil
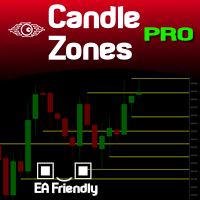
You probably heard about Candlesticks behaviors, which in most of the times could denote and trace Volume behaviors even if you are not watching Volume itself... Well, this indicator will do this. Naked traders love to rely solely on candlesticks patterns and with Candle Zones you can trap special patterns and DRAW THEM on your chart. As simple as that. There are several filters you can tweak in order to achieve the analysis you want. Just give it a try. After several months of testing, we think

Old Partridge knew markets which are almost as old as the Earth itself are never wrong. The legend says he knew how to beat a legion of others. This system he will to me. This system I will give to you.
Example [1] = 100 pips, profit boundary [2] = 2.0, take profit [3] = 400, stop loss [4] = 200 You buy EURUSD as 1.1440. SL will be set to 1.1420, TP will be set to 1.1480, when EURUSD = 1.1460 SL will be moved to 1.1450 EA works with the pair it is run on, [5] option allows to escort positions

NorthEastWay MT5 es un sistema de comercio de "retroceso" completamente automatizado, que es especialmente efectivo en el comercio de pares de divisas de "retroceso" populares: AUDCAD, AUDNZD, NZDCAD. El sistema utiliza los patrones principales del mercado Forex en el comercio: el retorno del precio después de un movimiento brusco en cualquier dirección. Plazo: M15
Pares de divisas base: AUDNZD, NZDCAD, AUDCAD
Pares adicionales: EURUSD, USDCAD, GBPUSD, EURCAD, EURGBP, GBPCAD Señales EN VIV
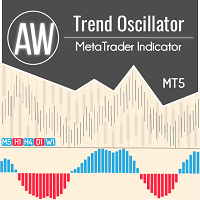
Oscilador de tendencia con sistema de filtrado avanzado. Determina la tendencia, su debilitamiento y fortalecimiento. Tiene un panel de múltiples marcos de tiempo incorporado. AW Trend Oscillator funciona en cualquier período de tiempo y en cualquier símbolo (divisas, índices, petróleo, metales, acciones). Versión MT4 -> AQUÍ / Resolución de problemas -> AQUÍ Características y Beneficios:
Filtrado de tendencias avanzado Cambiar la sensibilidad del indicador en un clic Configuración fácil Pa

Asesor Experto no indicador, no utiliza indicadores, cuadrícula de pedidos ni martingala. El número de operaciones por día puede ser estrictamente limitado, solo puede haber 1 orden en el mercado a la vez. Las operaciones están protegidas por un stop loss, puede ser real o virtual (oculto al corredor). Funciona durante la sesión asiática, en un mercado tranquilo. Tiene protección incorporada contra deslizamiento y ensanchamiento. No transfiere operaciones de lunes a viernes, tiene la función de

Indicador diseñado para medir la distancia del precio en un determinado promedio móvil.
El indicador, además de mostrar el valor del espaciamiento, tiene un promedio del propio espaciamiento, para ayudar y confirmar los análisis. Tanto el tipo de media y el promedio sobre el que se calculará el valor del espaciamiento, como el promedio del espaciamiento, son parametrizables. Con la opción "ESTABLECER NIVELES AUTOMÁTICOS Y MOSTRAR SEÑALES" habilitada, el indicador muestra señales de compra

RSI Robot Easy FX. Este robot totalmente configurable tiene el propósito de ejecutar órdenes utilizando el indicador RSI como base. Es posible elegir si las entradas sucederán al ingresar a áreas de sobrecompra, y / o al salir del área de sobreventa. Es posible configurar stoploss y takeprofit, así como el número máximo de pedidos a la vez. Aurélio Machado.

Este robot tiene el propósito de operar a favor de las barras de fuerza, el tamaño de la barra de fuerza se puede configurar, los usuarios pueden definir takeprofit y stoploss o el robot puede colocarlos automáticamente (en este caso, los objetivos takeprofit y stoploss son El tamaño de la barra anterior). Los valores definidos en los parámetros deben cambiarse de acuerdo con las necesidades de los usuarios.
FREE

Este indicador de múltiples símbolos ha sido diseñado para identificar automáticamente cuando el precio alcanza niveles psicológicos importantes. También conocidos como números redondos, números enteros o niveles clave. Como beneficio adicional, también puede buscar el nivel del punto de pivote en un período de tiempo seleccionado. Combinado con sus propias reglas y técnicas, este indicador le permitirá crear (o mejorar) su propio sistema poderoso. Características Puede escribir las señales en u

este indicador es un indicador de detector de picos,
está especialmente diseñado para intercambiar Boom 1000, Boom 500, Crash 1000 y Crash 500
Recomendamos usarlo solo en índices Deriv Boom y Crash
Su configuración es intuitiva, familiar y fácil de usar.
tiene funciones de notificación; notificaciones sonoras y notificaciones push.
esta herramienta es fácil de usar, fácil de manejar
Esta actualización se basa en diferentes estrategias para picos.

TRADE EXTRACTOR is the fastest self-learning AI Algorithm, which will learn any market situation with ease.As a Manual trader, I came across the difficulty of finding the right parameter and the right condition to trade. There are infinite combinations of indicators and objects(trendlines, gann grid, fibo levels etc) which as an human, I can’t decide their winning rate or performance. Many claim to have a winning strategy but won’t have enough statistical support to prove their claims. Due to

The famous brazilian trader and analyst Didi Aguiar created years ago a study with the crossing of 3 Simple Moving Averages called "Agulhada do Didi", then later was also named Didi Index, as a separate indicator. The period of those SMAs are 3, 8 and 20. As simple as that, this approach and vision bring an easy analysis of market momentum and trend reversal to those traders looking for objective (and visual) information on their charts. Of course, as always, no indicator alone could be used wit
FREE

The EA does not use grid, martingale, and arbitrage. The trading system is suitable for both experienced traders and beginners. The EA includes protection against high spread. Works well with the default settings. Provides a SAFE approach towards risk management with enabled Trailing stop. Expert Advisor will only use 1% of your free margin as risk and hence results in low trade volume but LOWER Drawdown as well
Important Information Revealed By purchasing this Expert Advisor you are entit

Tops & Bottoms Indicator FREE Tops abd Bottoms: An effective indicator for your trades
The tops and bottoms indicator helps you to find ascending and descending channel formations with indications of ascending and/or descending tops and bottoms. In addition, it show possibles opportunities with a small yellow circle when the indicator encounters an impulse formation.
This indicator provide to you more security and speed in making entry decisions. Also test our FREE advisor indicator:
FREE

SETI is a Break indicator multipair searching SETI is a powerful indicator of for any par and any timeframe. It doesn't requires any additional indicators for the trading setup.The indicator gives clear signals about opening and closing trades. This Indicator is a unique, high quality and affordable trading tool. Can be used in combination with other indicators Perfect For New Traders And Expert Traders Low risk entries. Never repaints signal. Never backpaints signal. Never recalculates
MetaTrader Market - robots comerciales e indicadores técnicos para los trádres, disponibles directamente en el terminal.
El sistema de pago MQL5.community ha sido desarrollado para los Servicios de la plataforma MetaTrader y está disponible automáticamente para todos los usuarios registrados en el sitio web MQL5.com. Puede depositar y retirar el dinero a través de WebMoney, PayPal y tarjetas bancarias.
Está perdiendo oportunidades comerciales:
- Aplicaciones de trading gratuitas
- 8 000+ señales para copiar
- Noticias económicas para analizar los mercados financieros
Registro
Entrada
Si no tiene cuenta de usuario, regístrese
Para iniciar sesión y usar el sitio web MQL5.com es necesario permitir el uso de Сookies.
Por favor, active este ajuste en su navegador, de lo contrario, no podrá iniciar sesión.