Nuevos robots comerciales e indicadores para MetaTrader 5 - 113

We present you a very reliable expert system. The expert system is based on the AC indicator. This indicator generates very reliable signals!
The AC indicator measures the speed of the market’s driving force by subtracting the slow moving average from the fast and then subtracting the fast moving average from this difference. This indicator, despite the present averaging model, can be classified as leading, since it measures precisely the driving force, which first slows down and then changes

KT MA Crossover draws the buy and sell arrows based on the crossover of chosen moving averages. Moreover, it also generates the appropriate alerts and displays the MFE (Most Favorable Excursion) for each successive signal. The moving average crossover is one of the primary strategies followed by traders around the world. Usually, it consists of a fast and slow moving average to find a buy and sell entry signal according to the crossover direction. Buy signal - when fast MA crosses above the slo

Появилось желание торговать движение, пробой на самой высокой волатильности, или запустить советника-усреднителя торговать боковик в тихой низковолатильной гавани тогда этот продукт для Вас! Индикатор анализирует 28 валютных пар (основные и кроссы) и в зависимости от выбранных настроек покажет самые высоковолатильные (max) или наоборот (min). Как измерить волатильность? Существует 2 способа. Первый это измерить рендж заданного количества последних баров (bar). Второй замерить

Вертикальная гистограмма объема - отображает распределение объема по уровням. Гистограмма рассчитывается от объема ( реального или тикового), при этом объем соответствующий бару переносится на уровень H-L бара.
Таким образом, при распределении объема за сутки по вертикали - формируются максимумы гистограммы показывающие области проторговки. Настройки индикатора: Timeframe Set - период в пределах которого производится расчет. (рекомендуется D1) Step's - количество отображаемых периодов. Amplit

KT Heiken Ashi Smoothed is a smoothed version of the standard Heiken Ashi. Moreover, it also plots buy/sell arrows on a trend change. A buy arrow is plotted when it change to a bullish state from bearish state. A sell arrow is plotted when it change to a bearish state from bullish state. Mobile notifications, Email, Sound and Pop-up alerts included.
What exactly is Heiken Ashi Smoothed? It filters out the false signals and noise in the standard Heiken Ashi. It applies the set of two moving a

Al tomar decisiones comerciales, es útil confiar no solo en datos históricos, sino también en la situación actual del mercado. Para que sea más conveniente monitorear las tendencias actuales en el movimiento del mercado, puede usar el indicador AIS Current Price Filter . Este indicador solo tiene en cuenta los cambios de precios más significativos en una dirección u otra. Gracias a esto, es posible predecir tendencias a corto plazo en el futuro cercano; no importa cómo se desarrolle la situac
Gridingale es un nuevo y complejo Asesor Experto que combina rejilla y martingala. Creará una rejilla de órdenes de acuerdo con la configuración, pero también añadirá una martingala en ella. Así que tomará ganancias en movimientos pequeños y grandes. Un sistema de cobertura de pérdidas está integrado para permitir la recuperación de las órdenes que están demasiado alejadas del precio actual. Es posible filtrar la apertura de un nuevo ciclo con un indicador. Puede trabajar en los dos lados al mi

El indicador MTF Qristalium Arrows es un sistema de comercio semiautomático terminado. Funciona en todos los pares de divisas.
En el indicador están involucrados tres reglas: 1) operar sólo por la tendencia, 2) "comprar, cuando todo el mundo vende y vender, cuando todo el mundo compra", 3) el Precio siempre va en contra de la multitud.
El indicador MTF Qristalium Arrows filtra los datos de la regla en varios Marcos de tiempo con indicadores integrados. Si coincide con la tendencia en la

Best Scalper Oscillator is an indicator for MetaTrader 5 based on mathematical calculations on the price chart. This is one of the most common and useful indicators for finding the trend reversal points. Best Scalper Oscillator is equipped with multiple types of notification (push notifications, emails, alerts), which allows opening trades in time.
Distinctive features Generates minimum false signals. Excellent for identifying trend reversals. Perfect for scalping. Suitable for working on t

This indicator will show a vertical representation of the volume distribution within a selected user range.
This is a free version of the full product. It is limited to use on a week old data or older. Find the full product at https://www.mql5.com/en/market/product/42234 .
Main features: This Indicator will create an image that will allow viewing the tick volume per price level in a graphical form. The indicator will work on any range size in any time-frame, limited only by your computer m
FREE
CAP Stochastic EA MT5 trades using the Stochastic Indicator. It offers many customizable Stochastic trading scenarios and flexible position management settings, plus many useful features like customizable trading sessions, a martingale and inverse martingale mode. [ Installation Guide | Update Guide | Submit Your Problem | All Products ]
Functions Easy to use and customizable Stochastic setting. Customizable indicator settings Built-in money management Grid trading when trade in Loss C
FREE

Indicator designed to give investors the advantage of identifying strong candlestick patterns in real time by staining candlesticks representing these patterns, using possible buy or sell performance. The color for each pattern identified by the parameter indicator according to your taste. The candlestick patterns identified by this indicator are: Inside Bar Closing Price Reverse Top (PFRA)
Closing Price Reverse Bottom (PFRB) Dave Landry Bullish Engulf Bearish Engulf Advantages: Real Time At ea
EXPERT ADVISOR DESCRIPTION
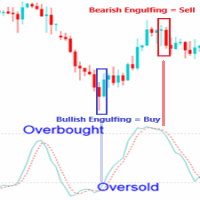
- Expert Advisor Engulfing in OBOS (Overbought Oversold) is an expert advisor consisting of a combined candle engulfing pattern and Stochastic Oscillator indicators. A Buy position occurs when engulfing are formed when the signal stochastic indicator is in the oversold area, A sell position occurs when engulfing are formed when the signal stochastic indicator is in the overbought area. - You can combine engulfing that form in certain timeframes with a signal stochas
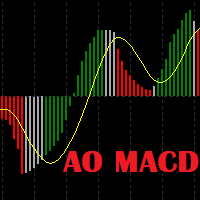
Awesome Oscillator Moving Average Convergence/Divergence Indicator. Not late as AO and not noisy as MACD. The basic version of the indicator is presented. The "PRO" version is under development with such features as sending signals to e-mail and plotting divergence and convergence lines on the chart.
Input parameters: Fast: short EMA Slow: long EMA Signal: signal line Colors: Red: MACD < Signal Green: MACD > Signal Gray: MACD above Signal, but lower than the previous MACD MACD below Signal, bu

This bot is based on the analysis of adaptive moving averages. The expert is characterized by stable signals, which can be used as accurate short-term signals. This is a semi-scalping system that analyzes the market using reliable indicators. Scalper is a system or not, depends on the parameters TakeProfit and StopLoss . Using this adviser, you need to understand that this bot requires optimization. The bot works both on netting accounts and on hedging accounts. But the settings must be optimiz

The Relative Strength Index (RSI), developed by J. Welles Wilder, is a momentum oscillator that measures the speed and change of price movements. The RSI oscillates between zero and 100. We have added to the reputable RSI indicator several types of alerts and a signal interval filter to be incorporated in your Expert Advisors. It works in ALL Timeframes ans instruments.
Product Features Email Alert Sound alert Push Notification (Alerts can be sent to your mobile phone) Signs on chart Aler
This bot can classify ticks into classes from 0 to 64, after which after analyzing the tick micro-signals it determines which way to open a position. You can work with an expert only on real ticks how to optimize and test!
When working, an expert uses position accounting in any mode, both netting (there can be only one position for one symbol) and with independent position accounting or hedging (there can be many positions for one symbol).
Configurable bot parameters TypeFilling - Type of e

This is a multicurrency and multitimeframe indicator that calculates the angle between two points. Points for measuring the angle can be taken from the ZigZag (the last two points), or from the Moving Average (between two given bars), or it can be the closing prices of bars.
Angle measurement is possible in degrees or in radians. You can select the scale for the calculation. For a better understanding of the indicator, you can study the free Angle High Low indicator. In the parameters you can

Trailing Uses Standard Deviation.
A daptive_Trailing_uses_StdDev_Indicator is an indicator of directional movement that allows you to identify a trend at the time of its inception and set the levels of a protective stop.
Unlike trailing with a constant distance, the indicator uses the distance to the price proportional to the current standard deviation of StdDev. The distance is equal to the product of the standard deviation and the constant coefficient set by the user.
Thus, the traili
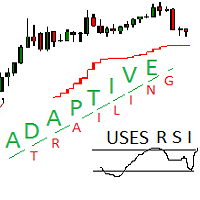
Adaptive trailing uses rsi
Adaptive trailing uses rsi - это скрипт, который реализует трейлинг, а именно: вычисляет уровень защитного стопа, отображает уровни на графике, исполняет заданные пользователем торговые операции при достижении ценой стоп уровня. Режимы работы. Трейлинг может осуществляться как снизу, когда уровень стопа ниже текущей цены и подтягивается за ценой, если она возрастает, так и сверху, когда уровни стопа выше текущей цены. Предусмотрено два режима расчета стоп уровня

KT CCI Divergence shows the regular and hidden divergence created between the price and CCI oscillator. Divergence is one of the vital signals that depicts the upcoming price reversal in the market. Manually spotting the divergence between price and CCI can be a hectic and ambiguous task.
Limitations of KT CCI Divergence
Using the CCI divergence as a standalone entry signal can be risky. Every divergence can't be interpreted as a strong reversal signal. For better results, try to combine it
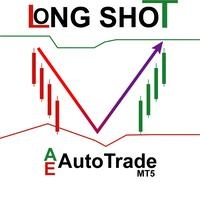
Expert Advisor de la conocida estrategia LongShot. La estrategia combina los movimientos del precios con el canal de Donchian y usa dos medias móviles para la toma de posiciones así como la magnitud en los cambios en los precios usando un oscilador. El EA está diseñado para hacer tanto swing como scalping. Antes de usarlo es necesario tener en cuenta que los parámetros que vienen por defecto corresponden a una optimización determinada, para una operativa tendencial en gráficos de 1h, pero puede

El indicador Trend Line PRO es una estrategia comercial independiente. Muestra el cambio de tendencia, el punto de entrada a la transacción, así como calcula automáticamente tres niveles de Take Profit y la protección contra la pérdida de Stop Loss Trend Line PRO es perfecto para todos los símbolos de Meta Trader: monedas, metales, criptomonedas, acciones e índices Ventajas de Trend Line PRO: Nunca vuelve a dibujar sus señales Posibilidad de utilizar como estrategia independiente Tiene tres niv
FREE

Shadow Height mt5 Indicador de sombra.
Muestra el tamaño de las sombras de las velas, en puntos, como histograma. Funciona en dos modos, seleccionables por el usuario. Descripción de la configuración del indicador Modo - modos de funcionamiento del indicador, dos modos: primera altura - modo de visualización para las sombras de la vela superior e inferior; la segunda diferencia es el modo de mostrar la diferencia en las sombras de las velas, la diferencia entre las sombras de las velas superi
FREE

El asesor MTF Qristalium Average se creó junto con el programador Alexander Gavrilin. Este sistema es completamente automatizado. No es Martingale. Aquí es donde funciona el promedio.
Funciona en todos los pares de divisas.
El asesor involucra tres reglas: 1) negociamos solo por tendencia, 2) "compra cuando todos venden y venden cuando todos compran", 3) el Precio siempre está en contra de la multitud.
MTF Qristalium Average filtra los datos de la regla en varios Marcos de tiempo

Se pueden utilizar distribuciones sostenibles para suavizar las series financieras. Dado que se puede usar un historial bastante profundo para calcular los parámetros de distribución, tal suavizado, en algunos casos, puede ser aún más efectivo en comparación con otros métodos.
La figura muestra un ejemplo de la distribución de los precios de apertura del par de divisas EUR-USD en el marco temporal H1 durante diez años (Figura 1). Se ve fascinante, ¿no?
La idea principal que subyace
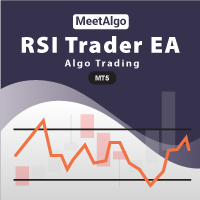
MeetAlgo RSI Trade EA MT5 trades using the RSI Indicator. It offers many customizable RSI trading scenarios and flexible position management settings, plus many useful features like customizable trading sessions, a martingale and inverse martingale mode. [ Installation Guide | Update Guide | Submit Your Problem | All Products ]
Functions Easy to use and customizable RSI setting. Customizable indicator settings Built-in money management Grid trading when trade in Loss Customizable break-
FREE

CAP Moving Average EA MT5 trades using the Moving Averages Indicator. It offers many customizable Moving Averages trading scenarios and flexible position management settings, plus many useful features like customizable trading sessions, a martingale and inverse martingale mode. [ Installation Guide | Update Guide | Submit Your Problem | FAQ | All Products ]
Functions Easy to use and customizable Moving Average setting. Customizable indicator settings Built-in money management Grid
FREE

Moon 3 is a Trend indicator. I s a powerful indicator of TREND for any par and any timeframe. It doesn't requires any additional indicators for the trading setup.The indicator gives clear signals about opening and closing trades.This Indicator is a unique, high quality and affordable trading tool.
Perfect For New Traders And Expert Traders Low risk entries. Never repaints signal. Never backpaints signal. Never recalculates signal. For MT5 Only Great For Scalping Great For Swing Trading Arro

Expert Advisor Raikow FX EA operates using the Vegas Tunel strategy, which consists of fibonacci levels above and below the 169 period moving average. It can operate on trend and counter trend.
It has margin control, open order limit, positive swap control and filter indicators like RSI and ADX. It also has dynamic and fixed take profit in the fibonacci levels and trailling stop levels. For more information visit our Telegram group https://t.me/RaikowFXEAEN

Indicator SR levels true in small time frames is very useful for scalping while in bigger ones it is good for day or position trading.
SR levels true can draw 4 support/resistance levels based on defined maximum rebouds from price level. Indicator scans defined number of bars in time axis and defined number of pips in price axis (both sides - up and down) and calculates how much times price was rejected from scanned price levels. At the price levels where maximum rebounds are counted, support

Several assets in several markets have the behavior of using specific numbers as Force Numbers, where support, resistance and price thrust is created. Let this indicator draw those levels of support and resistance for you. You can also stack it to show different level of Prices! This technique is being used by Tape Readers and Order Flow traders all over the world for a long time. Give it a try. Challenge yourself to study new ways of Price Action!
SETTINGS
What Price reference to use in th
FREE

Простой индикатор, показывающий цены Bid и Ask. Есть настройки отображения информации и возможность перетаскивать панель. Индикатор используется для наглядного отображения цен покупки и продажи актива.
Входные параметры : Support - Ссылка, на помощь проекту heigth - Высота формы width - Ширина формы size - Размер текста bidcol - Цвет текста bid askcol - Цвет текста
FREE

Trailing Stop Fast Trailing Stop Fast EA locks trade profit once trade moves in profit by certain points(eg 100 points) by moving the Stop Loss in direction of trade.
There are three inputs in EA to be provided by user to EA TrailingStart this input used as activator when trade moved 100 points towards profit, this EA will start shifting your stop loss towards profit.
TrailingStop input defines what should be the distance of stop loss from current market price once TrailingStart activat

Basket trading /Basket SL TP/Portfolio SL TP/ Group Trade SL TP
This is very good utility when you want set SL TP for many open trades or portfolio
As soon your account equity reach SL or TP , This EA will close all trades . you are allowed to change SL and TP any time.
Also you need not to monitor group trades all the time you just set SL and TP in utility and relax once SL / TP situation will come all trades will be closed automatically.
SL and TP are in $Amount like 100$ SL and 500

Basket trading /Basket SL TP Automatic SL TP Calculation
This utility will calculate SL and TP based on 2 input parameters
PerUnitTP -This means what is per .01 TP like 1 $ per .01 Lot. SLToTP_Ratio-This what is ration SL to TP if this parameter is 3 that means if TP is 1 $ then SL will be 2$ (per .01 Lot)
so if total portfolio summing to .05 lot that that means TP will be automatically become 5 $ and SL become 10 $.
This is very good utility when you want set SL TP for many open t
This is our simplest tool! With it you hide the Bid and Ask lines from chart and have only a small rectangle showing what current price is. This tool is useful for those who want the cleanest chart possible. You can also show the Ask price only, instead of the Bid (most common). To further assist you in cleaning the chart check out our other tool: https://www.mql5.com/en/market/product/41835 Any questions or suggestions, please contact us. Enjoy!
FREE
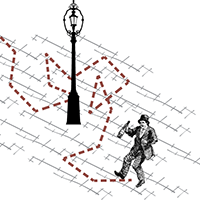
The script simulates a random price walk and saves it to a CSV file.
This file can be used to create charts of random price walk.
How to create custom symbols you can read here .
Script Settings:
SymName - The name of the CSV file that will be saved in MQL5/Files.
HistoryDepth - The number of minutes to simulate a random price walk.
StartFrom - At which price the simulation will start.
VolaCycle - Mode simulates intraday volatility.
The pictures show the recommended settin
FREE

KT Bollinger Bands Trader is a 100% automated expert advisor that's incorporated a mean reversion trading strategy using the Bollinger bands during the period of low volatility. Price often reacts at the upper or lower line of Bollinger bands, but a reversal not always occurs. However, there is more chance of price reversal during the time of low volatility.
Entries A buy trade is activated when price correctly aligns below the bottom line of Bollinger bands. A sell trade is activated when pri
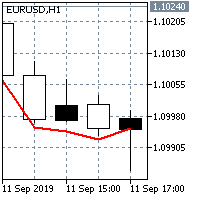
SEMA is the Sextuple Exponential Moving Average:
SEMA = PEMA + QEMA(y - PEMA)
The principle of its calculation is similar to Double Exponential Moving Average (DEMA). The name "Sextuple Exponential Moving Average" does not very correctly reflect its algorithm. This is a unique blend of the single, double, triple, quadruple and pentuple exponential smoothing average providing the smaller lag than each of them separately. SEMA can be used instead of traditional moving averages. It can be use

ChannelRSI5 El indicador de índice de fuerza relativa (RSI) con niveles dinámicos de zonas de sobrecompra y sobreventa.
Los niveles dinámicos cambian y se ajustan a los cambios actuales en el indicador y los precios, y representan una especie de canal.
Configuración del indicador period_RSI: período promedio para calcular el índice RSI. apply_RSI: el precio aplicado. Puede ser cualquiera de las constantes de precio: PRICE_CLOSE: precio de cierre, PRICE_OPEN: precio de apertura, PRICE_HIGH: p
FREE

Este indicador le permite determinar la probabilidad de que el precio alcance uno u otro nivel. Su algoritmo es bastante simple y se basa en el uso de datos estadísticos sobre los niveles de precios de un par de divisas en particular. Gracias a los datos históricos recopilados, es posible determinar en qué medida cambiará el precio durante la barra actual. A pesar de su simplicidad, este indicador puede proporcionar asistencia invaluable en el comercio. Entonces, con su ayuda, es posible determ

As it name implies, this is an exaustion oscillator. However, you may wonder: what differs you from others oscillators like RSI, Stochastic, CCI etc? The difference is that ours is more powerful and accurate ! Your oscillator filters the nois e made by other oscillators, and shows you only the exact moment to enter the trade. Of course, using it alone, like any other indicator, has its risks. Ideally, reconcile it with technical analysis and/or others indicators. If you buy i t you ge t up to 1

The 3 Automatic Vwap (Midas) Indicator can be used for Price and Volume studyers to map the movement of market drivers. It automatically plots 3 Vwaps, two of which are dynamic and will be updated throughout the day if new highs or new lows emerge. The third Vwap is daily and can help if the trend is up or down. Also, an auxiliary indicator that plots (also dynamic) points of interest with OHLC prices (Open, High and Low of the current day and Close of the previous day) was inserted. Success and

Easily get all relevant economic events of the current day right into your chart, as markers. Filter what kind of markers do you want: by country (selected individually) and by Importance (High relevance, Medium, Low or any combination of these). Configure the visual cues to your liking. If there is more than one event set to the very same time, their Names will be stacked and you will see the messages merged with the plus (+) sign on the marker. Obviously that long or too much events on the sam
FREE

Apollo 2 The wall It is an advanced trading system. This is a fully automatic Expert Advisor, which allows you to presize the trade according to the preferences of the trader. Apollo 2 have more customization options for your trade. Different options for different styles of trade. Apollo 2 the wall is a break system of trade with different algorithm of trade mode. This EA using signals to place orders. Is a revolution in the customization of the trading. The algorithms developed for the id

TickChart Indicator plots tick line on the main window of MetaTrader.
In the Lite version, the number of ticks is limited to 20 and the alert function described below is omitted. The tick-line shows the most detailed, fastest and real-time activities of the market, which are usually hidden in bars or candles longer than 1 minute. Usually, several new tick-line segments appear while a bar of M1 time frame is completed. After the release of an important economic indicator, the number of ticks pe
FREE

For those who like trend the Force will be a very useful indicator. This is because it is based on the famouse ADX, which measure the strenght of a trend, but without its 3 confusing lines. Force has its very simple interpretation: if the histogram is above zero level the trend is up, otherwise it is down. You can use it to find divergences too, which is very profitable. Thanks to Andre Sens for the version 1.1 idea. If you have any doubt or suggestion, please, contact me. Enjoy!
This is a fre
FREE
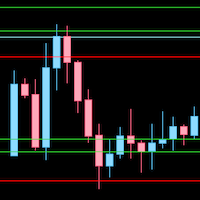
Draw levels of support and resistance based on highs/lows or closes from daily, weekly or monthly. This indicator uses the highs, lows or closes to draw horizontal lines on the graph. By observing those lines you can identify trend (gaining or losing levels of resistence/support) and find good levels where price can bounce. For those who trade price action, this is a very useful indicator.

Easy Market makes the market easier to trade. It allows you to see an "eternally" side (no trend) market, making it extremely easy to see when the price is overbought or oversold. Both trend and consolidation traders will like Easy Market. You can use it as an auxiliary window (below chart) or in full screen mode. See the screenshots and note how it gives you accurate entries! If you have any doubt or suggestion, please, contact us! Ejoy!

This is a conventional volume indicator, which displays the ticks or real volume (if available from your broker). But it has others features like: 5 color schemes: single, when crossing with moving average, when crossing a specific level, when having different volume between bars and when candle change color. Being hable to have a customizable moving average. Being hable to have a value indicator line. Many thanks to Diego Silvestrin for the ideas to version 1.1 and Konstantin Demidov for
FREE

The analyzer makes it possible to quickly assess spread changes on historical data, the magnitude and frequency of bursts, the dynamics and nature of the extensions by the days of the week, etc.
The analyzer needs to be started in the tester (visualization mode) on the symbol and time interval required for analysis, recommended TimeFrame H1, select "Every tick based on real ticks" mode.

MOON 2 THE WALL is a Oscilator indicator. I s a powerful indicator of TREND for any par and any timeframe. It doesn't requires any additional indicators for the trading setup.The indicator gives clear signals about opening and closing trades.This Indicator is a unique, high quality and affordable trading tool.
Perfect For New Traders And Expert Traders Low risk entries. Never repaints signal. Never backpaints signal. Never recalculates signal. For MT5 Only Great For Scalping Great For Swi

Compare Symbols Specifications is a utility indicator that is a summary interactive table of the analyzed parameters. Trading conditions in the market are constantly changing and tracking these changes is a time-consuming task. This tool allows you to compare the trading conditions of all symbols in a matter of seconds, and choose for trading those symbols that meet the requirements of the trading system. This tool will be useful to all traders and will help them to have up-to-date information

Imagine VWAP, MVWAP and MIDAS in one place... Well, you found it! Now you can track the movement of Big Players in various ways, as they in general pursue the benchmarks related to this measuring, gauging if they had good execution or poor execution on their orders. Traders and analysts use the VWAP to eliminate the noise that occurs throughout the day, so they can measure what prices buyers and sellers are really trading. VWAP gives traders insight into how a stock trades for that day and deter
FREE

Are you tired of erasing the objects on chart and then having to put them back in? What if you had a tool that would allow you to hide and show all objects any time? Cool, huh? That is why I developed this tool as an indicator. With it you hide all objects using a shortcut button on chart or the keyboard (customizable). If you have any suggestions or find a bug, please, contact us. Enjoy!
FREE
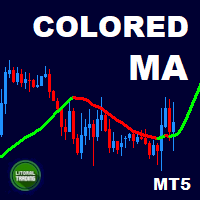
Are you the type who likes to use moving averages and surf the trend? Me Too! that is why I developed this indicator. It is basically a moving average that changes the color according to the trend (up or down). Its appearance can be customized and the price method too. The setup is very simple, no need to explain. If you have any questions or find any errors please contact us! Enjoy!
This is a free indicator, but it took hours to develop. If you want to pay me a coffee, I appreciate a lot <3
FREE

Pivot levels indicator shows 7(9 for Camarilla) pivot levels. It is adjusted for major use, including: all standard time frames
choice of periods to show four popular calculation formulas (typical, median, weighted and Camarilla)
pivot day shift choice of properties for lines and labels choice of showing alerts when crossing pivot lines Parameters: ----------Main parameters----------- Timeframe - time frame for pivot levels
Number of periods to show - displays pivot levels for number of perio

Robô Pepito. Pepito é um robô para day trade em mini índice Bovespa. Desenvolvido com uma estratégia que funciona exclusivamente com o ativo WIN, melhorando assim a sua performance e visando mais Ganhos e menos Perdas. - Negociação no ativo Mini Índice (WIN) na BM&F BOVESPA; - Operações 100% day trade; - O robô vai configurado para realizar apenas uma operação ao dia, mas isso pode ser alterado nos "Parâmetros de entrada".
ATENÇÃO: Tipo de conta: [x] Netting, [ ] Hedge. Ativar o horário de fu

Описание Данный индикатор строит (альтернативные, математически рассчитанные) уровни поддержки и сопротивления, а так же уровни, к которым с большой вероятностью придет цена в ближайшее время. Следует обратить внимание на то, что расчет уровней производится на исторических данных, и качество котировок играет важную роль при построении индикатором линий. Замечу, что отрисованные Magneto и Magneto Weekly линии не изменяют свои значения на всем расчетном периоде. Важное изменение! Добавлена функция

KT MACD Divergence shows the regular and hidden divergences build between the price and oscillator. If your trading strategy anticipates the trend reversal, you can include the MACD regular divergence to speculate the potential turning points. And if your trading strategy based on the trend continuation, MACD hidden divergence would be a good fit.
Limitations of KT MACD Divergence
Using the macd divergence as a standalone entry signal can be a risky affair. Every divergence can't be interpr

¿Encontró una buena señal, pero el lote de un proveedor es demasiado pequeño? ¿Necesita un mayor volumen de posición, pero la configuración del terminal es demasiado pobre? Signal Lot Manager incrementará el volumen de posición del proveedor mediante una orden duplicada del volumen necesario. Simplemente establezca un tamaño de lote y un nombre de una señal para copiar órdenes. Signal Lot Manager es una utilidad multiplicadora de lotes para duplicar pedidos en su terminal. La fuente se puede sel

"TPA Sessions" indicator is a very important tool to complement "TPA True Price Action" indicator . Did you ever wonder, why many times the price on your chart suddently turns on a position you can't explain? A position, where apparently no support or resistance level, or a pivot point, or a fibonacci level is to identify? Attention!!! The first run of the TPA Session indicator must be in the open market for the lines to be drawn correctly.
Please visit our blog to study actual trades wit

EA Builder allows you to create your own algorithm and adapt it to your own trading style . Classical trading, grid, martingale, combination of indicators with your personal settings , independent orders or DCA, visible or invisible TP/SL, trailing stop, loss covering system, break-even system, trading hours, automatic position size etc.. The EA Builder has everything you need to create your perfect EA . There is an infinite number of possibilities, build your own algorithm. Be creative! Pro v
FREE
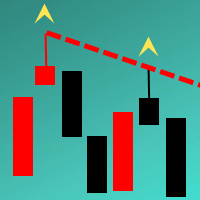
The Indicator automatically draws trend lines on the specified timeframe ( Trend lines period parameter). The lines are drawn based on the last two known fractals of the specified period. If you want the lines to be drawn only on the confirmed fractal, then set the Confirmed or unconfirmed fractal parameter to True . Indicator feature - lines are drawn with the accuracy of any timeframe. It allows analyzing the chart on smaller timeframes without loosing the precision of drawing the lines in re

Apollo 1 box break It is an advanced trading system. This is a fully automatic Expert Advisor, which allows you to presize the trade according to the preferences of the trader. Apollo 1 have more customization options for your trade. Different options for different styles of trade. Apollo 1 box break is a break system of trade with different algorithm of trade mode. This EA using signals to place orders. Is a revolution in the customization of the trading. The algorithms developed for the

Market volume profile indicator. It works on almost all instruments - currency pairs, stocks, futures, on real volumes and on ticks. It can be set as automatic determination of the range of building a profile, for example, for a week or a month, etc. and set the range manually by moving the borders (two vertical lines red and blue). Shown as a bar graph. The width of the histogram at a given level means, conventionally, the number of trades made on it. With the "Mode level line color" para

The traditional Money Flow Index indicator, this time, EA friendly . There are 3 buffers exposed that can be used by EAs to automatically analyze the Overbought and Oversold conditions of the quote. Just use the traditional iCustom() function to get these signals. This Money Flow Index calculation is based on the traditional Metaquote's MFI indicator.
SETTINGS
MFI Period Volume type to analyze (Real Volume or Ticks) Starting Overbought region Starting Oversold region
USING WITH EAs
Buffer
FREE

The current Rise and Fall is judged from the Commodity Channel Index (CCI) of the three cycles and displayed in a panel by color coding.
The second and third of the three cycles are changed according to the correction factor multiplied by the first cycle (minimum cycle).
In addition, each CCI is displayed with ATR (Average True Range) corrected for variation.
When two of the three CCI are complete, Trend_1 is displayed.
When all three are complete, Trend_2 is displayed.
// ---

FZR indicator determines fractal zigzag reversal pattern of all the time frames of the chosen symbol and shows the information in the Info label. Indicator draws the detected pattern in the chosen time frame and also you can select in the menu to draw the trend line according to FZR peaks. What it is FZR? See the first picture in the screenshots. As you can see for every peak of FZR the AO indicator must cross zero line. FZR indicator determines the trend direction.
How to use FZR for trading?
El Mercado MetaTrader es la única tienda donde se puede descargar la versión demo de un robot comercial y ponerla a prueba, e incluso optimizarla según los datos históricos.
Lea la descripción y los comentarios de los compradores sobre el producto que le interese, descárguelo directamente al terminal y compruebe cómo testar el robot comercial antes de la compra. Sólo con nosotros podrá hacerse una idea sobre el programa, sin pagar por ello.
Está perdiendo oportunidades comerciales:
- Aplicaciones de trading gratuitas
- 8 000+ señales para copiar
- Noticias económicas para analizar los mercados financieros
Registro
Entrada
Si no tiene cuenta de usuario, regístrese
Para iniciar sesión y usar el sitio web MQL5.com es necesario permitir el uso de Сookies.
Por favor, active este ajuste en su navegador, de lo contrario, no podrá iniciar sesión.