Indicadores técnicos de pago para MetaTrader 5 - 65

# Indicador MultiZigZag Pro para MetaTrader 5
O MultiZigZag Pro é um poderoso indicador técnico para a plataforma MetaTrader 5 que identifica, de forma inteligente e flexível, os principais pontos de inflexão e tendências nos gráficos de preços.
## Características principais: - Algoritmo avançado que filtra ruídos e movimentos irrelevantes do mercado - Múltiplos timeframes para análise de tendências de curto a longo prazo - Parâmetros de profundidade e desvio personalizáveis para adaptação a

Introducing Your Ultimate Trading Edge: Dynamic Support & Resistance, Advance Entry Levels Light Indicator for MT5 platform Unlock the power of precision trading with our cutting-edge Dynamic Support & Resistance Indicator. Designed to give traders unparalleled clarity, this indicator is your roadmap to identifying exactly where to buy and sell, maximizing your potential for consistent, sustainable profits. Why Choose Our Indicator? Crystal Clear Entry and Exit Points : No more guesswork. Our
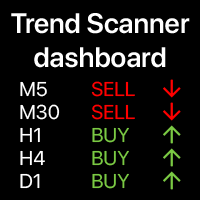
Panel de tendencias: indicador multiframe, muestra un resumen de la tendencia actual Esta herramienta se basa en 3 indicadores principales: RSI, Estocástico e Índice del Canal de Materias Primas. La opción de alertas te ayudará a no perderte el inicio de la tendencia. Utilidad multifuncional : incluye 66+ funciones | Contáctame si tienes alguna pregunta | Versión MT4 Una variedad de opciones te permitirá personalizar el indicador según tus necesidades. Configuració

¡Desata el poder de Fibonacci con el Adaptive Fibonacci Trend Ribbon (AFTR)! ¿Estás listo para revolucionar tu estrategia de trading? AFTR no es solo otro indicador; es tu herramienta definitiva para detectar tendencias, analizar reversiones y tomar decisiones precisas con una claridad inigualable. Con la alineación de las secuencias de Fibonacci y un conjunto de medias móviles avanzadas, este indicador está diseñado para los traders que exigen precisión y flexibilidad. Características clave qu

The "NBank Levels MT5 Indicator" is an essential tool for traders looking to refine their market strategies with precision. This indicator identifies and displays the key price levels for both the current day and the previous day, allowing traders to pinpoint exact entry points. By focusing on these specific levels, traders can enhance their decision-making process, leading to more accurate trade executions.
This indicator is designed to simplify the trading experience. It presents data clearl

Hey there! If you are using Moving Average indicator into RSI indicator's window and always wondering if there could be a way to get alerts on your smartphone when those two indicators get a crossover that would be great, right!? Then you have found the right tool for that. This indicator is nothing but a mix of MA indicator and RSI indicator into one indicator window as well as it will give you alerts for crossovers on your smartphone app, email and also on your trading terminal's (desktop) cha

El indicador Nro Lines, mediante el trazado de líneas, ofrece una visualización precisa y dinámica de los niveles de precios clave. Esta funcionalidad permite a los traders realizar un análisis técnico optimizado, lo cual es esencial para desarrollar estrategias de trading efectivas y tomar decisiones asertivas de entrada y salida del mercado. Características principales: - Líneas de referencia dinámicas que se ajustan según los cambios del mercado, ofreciendo una representación visual actuali
Loud Key Levels MT5 Indicator The "Loud Key Levels" indicator for MetaTrader 5 is an innovative trading tool designed to enhance your market analysis by identifying critical support and resistance levels. This indicator simplifies the decision-making process for traders by providing a visual representation of average key levels, as well as upper and lower close key levels, facilitating a clearer understanding of potential price action. Key Features Average Key Levels : The core function of the
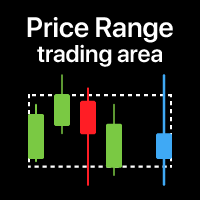
Zona de precio: visualización del rango de trading para el período seleccionado Especialmente útil al operar en timeframes bajos , para ver el rango desde un TF superior . Mi #1 Utilidad : 65+ funciones, incluyendo este indicador | Contácteme para cualquier pregunta | Versión MT4 Cuándo puede ser útil: Al usar múltiples timeframes Para ver el panorama general desde otro período Para ver el rango completo del período seleccionado Configuración: Color de la zona Rellenar zona: si es '
GENERAL OVERVIEW
Introducing our new KDE Optimized RSI Indicator! This indicator adds a new aspect to the well-known RSI indicator, with the help of the KDE (Kernel Density Estimation) algorithm, estimates the probability of a candlestick will be a pivot or not. For more information about the process, please check the "HOW DOES IT WORK ?" section. Features of the new KDE Optimized RSI Indicator :
A New Approach To Pivot Detection
Customizable KDE Algorithm
Realtime RSI & KDE Dashboard
Alert

TrendFusionXplorer consists of three powerful trend-analyzing indicators — TRP , PMax and OTT — developed by Kivanc Ozbilgic. Each indicator displays the trend's support and resistance levels based on its unique properties and methodology. TrendFusionXplorer assists in determining entry and exit points for markets and can also be used for setting trailing stop-loss (SL) and take-profit (TP) levels on open positions.
Specifications
1. Trend Reversal Predictor (TRP): TRP follows Thomas R. DeMar
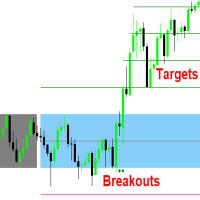
This indicator measures and displays the price range created from the first period within a new trading session, along with price breakouts from that range and targets associated with the range width. The Opening Range can be a powerful tool for making a clear distinction between ranging and trending trading days. Using a rigid structure for drawing a range, provides a consistent basis to make judgments and comparisons that will better assist the user in determining a hypothesis for the day's pr
AutoFib: Advanced Fibonacci Retracement for MetaTrader 5 Automate Fibonacci Analysis for Smarter Trading Decisions AutoFib simplifies Fibonacci retracement analysis by automatically identifying key levels of support and resistance directly on your MT5 charts. Whether you're new to Fibonacci analysis or an advanced trader, AutoFib enhances your ability to identify potential reversals, continuations, and critical price levels. Key Features: Automatic Fibonacci Levels – Identify retracement and ext
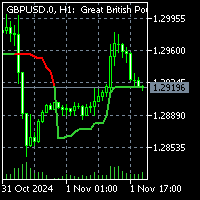
To get access to MT4 version please contact via private message. This is the exact conversion from TradingView:"ATR Trailing Stoploss" by "ceyhun" The screenshot shows similar results from tradingview and Metatrader when tested on ICMarkets on both platforms. This is a light-load processing indicator. It is a non-repaint indicator. Colored Candle option is not available. Buffers are available for processing in EAs. You can message in private chat for further changes you need.

This indicator automatically draws trendlines, Fibonacci levels, support and resistance zones, and identifies BOS (Break of Structure) and CHOCH (Change of Character) patterns on the chart. Just by placing it on the graph, it handles the essential technical analysis tasks for traders, providing a streamlined, effective trading tool this tools is alway make every one easy for trading.

This is an advanced trend indicator designed to accurately identify reversals and the beginning of trend movements. With this tool, you will be able to receive high-quality signals for entering and exiting the market, minimizing false entry points and increasing the profitability of transactions. The indicator is suitable for any assets (currency pairs, stocks, indices) and time intervals, from minute to daily charts.

PLEASE NOTE THIS IS PROACTIVE PRODUCT, NOT A DONE FOR YOU SET AND FORGET. YOU MUST KNOW ABOUT OTPIMIZATION AND WANT TO BUILD YOUR OWN EA . Prop Trading Code is one of a kind product that lets you build your own prop trading EA to attempt to pass a challenge taking it buy each day. This is a generator that has all the conditions to generate a code that you can then use to build your own prop trading EA in your strategy tester. This empowers the trader to generate, define, build, alter and use

Hola chicos, soy The Rangers Fx. Logramos crear un indicador para detectar picos en el índice Boom 1000, el índice Boom 500 y el índice Boom 300; de hecho, estas palabras indicadoras se refieren a todos los Booms que están disponibles y los otros que aún están por llegar en el futuro. Cómo utilizar este indicador En primer lugar, debe cambiar su marco de tiempo al marco de tiempo M1/M5. Este indicador le enviará una alerta sobre cuándo realizar sus operaciones de compra y cuándo salir/cerrar sus

Hola chicos, soy The Rangers Fx. Logramos crear un indicador para detectar picos en el índice Crash 1000, el índice Crash 500 y el índice Crash 300, de hecho, estas palabras indicadoras en todos los Crashes que están disponibles y los otros que aún están por venir en el futuro. Cómo utilizar este indicador Primero que nada, debe cambiar su marco de tiempo al marco de tiempo M1/M5. Este indicador le enviará una alerta sobre cuándo realizar sus operaciones de venta y cuándo salir/cerrar sus operac

Cycle Identifier Pro: Advanced Swing Highs & Lows Indicator Description: Unlock the full potential of your trading strategy with Cycle Identifier Pro , a cutting-edge indicator meticulously designed to pinpoint swing highs and swing lows with unparalleled precision. Whether you’re a seasoned trader or just starting out, Cycle Identifier Pro offers the tools you need to navigate any market condition across all timeframes with confidence. Key Features: Accurate Swing Detection : Swing Highs and Lo
El Indicador Supertrend es una poderosa herramienta de seguimiento de tendencias diseñada para traders que buscan claridad al identificar tendencias alcistas y bajistas en el mercado. Creado para MQL5, ofrece análisis en tiempo real y ayuda a los usuarios a tomar decisiones informadas al resaltar puntos de entrada y salida. Con configuraciones personalizables, este indicador se adapta a diversas condiciones de mercado, garantizando flexibilidad y precisión en las estrategias de trading.

Imbalance DOM Crypto: Potencia tus Operaciones con el Desequilibrio del Libro en Criptomonedas Oportunidades en Pequeños Movimientos de Precio
Imbalance DOM Crypto es una herramienta esencial para analistas que operan con el flujo de órdenes en criptomonedas. Perfecto para scalpers, fue desarrollado para aquellos que buscan aprovechar pequeñas oscilaciones de precio con alta precisión. Con cálculos avanzados, el indicador identifica desequilibrios en el libro de ofertas, proporcionando

Times and Sales Crypto: Potencia tus operaciones con Times and Sales en criptomonedas Aprovecha los pequeños movimientos de precio con precisión Times and Sales Crypto es una herramienta esencial para traders que operan con flujo de órdenes en criptomonedas. Perfecto para scalpers, está diseñado para aquellos que buscan aprovechar las pequeñas fluctuaciones de precio con alta precisión. Usando cálculos avanzados, el indicador utiliza datos de times and sales para proporcionar señales va
Japanese Candle Patterns (JCP) User Guide Overview and Features Japanese candlestick patterns, a foundational element of technical analysis, provide traders with visual insights into market psychology. Each pattern represents the battle between bulls and bears, encapsulating critical information about market sentiment, potential reversals, and continuation signals. Developed centuries ago and later popularized by Steve Nison in Japanese Candlestick Charting Techniques , these patterns are now wi

ICT Liquidity Levels es un indicador avanzado diseñado para traders que buscan precisión en sus operaciones utilizando niveles institucionales. Este indicador muestra niveles clave de precio diarios y por sesión, ofreciendo una visión estructurada que se alinea con la estrategia de ICT Silver Bullet para mejorar la claridad y el enfoque. Características: Niveles Clave Completos: El indicador marca niveles críticos de precios para apoyar la estrategia de trading, incluyendo: Máximo y mínimo

The First Dawn indicator uses a unique mechanism to search and plot signals.
This keeps searching for signals, making it a great indicator for scaping and identification of changes in direction, swing trading and trend trading.
The First Dawn helps you get early signals. The backtest gives the true picture of how the indicator works with real/demo accounts.
Although this is a tiny indicator it is packed with advantageous settings that will help you whether you desire to: Snap the Peaks a

Acerca del Indicador Este indicador se basa en simulaciones de Monte Carlo sobre los precios de cierre de un instrumento financiero. Por definición, Monte Carlo es una técnica estadística utilizada para modelar la probabilidad de diferentes resultados en un proceso que implica números aleatorios basados en resultados observados previamente.
¿Cómo Funciona? Este indicador genera múltiples escenarios de precios para un valor, modelando cambios de precios aleatorios a lo largo del tiempo basados e

This indicator identifies and visually displays Support and Resistance zones on a financial chart, providing traders with critical insights into market structure and potential price action areas. Here's how it operates: Key Features: Zone Identification: Detects Support Zones (price levels where buying pressure is historically strong). Detects Resistance Zones (price levels where selling pressure is historically strong). Categorizes zones into: Weak Zones Untested Zones Turncoat Zones (previousl
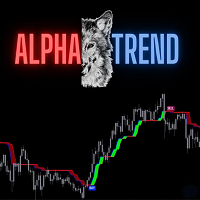
AlphaTrend is a brand new indicator which inspired by Trend Magic. In Magic Trend we had some problems, Alpha Trend tries to solve those problems such as:
1-To minimize stop losses and overcome sideways market conditions.
2-To have more accurate BUY/SELL signals during trending market conditions.
3- To have significant support and resistance levels.
4- To bring together indicators from different categories that are compatible with each other and make a meaningful combination regarding momen

La versión gratuita de ProEngulfing es QualifiedEngulfing, con una limitación de una señal por día y menos funciones. Únete al canal de Koala Trading Solution en la comunidad de mql5 para conocer las últimas novedades sobre todos los productos de Koala. Enlace de acceso: https ://www .mql5 .com /en /channels /koalatradingsolution La versión MT4 de este producto ya está disponible para descargar en el siguiente enlace: https ://www .mql5 .com /en /market /product /52023 Presentamos ProEngulfing

Hurst Cycles Diamonds Description This indicator is an alternative version inspired by the pioneering work of David Hickson and the Hurst Cycles Notes indicator developed by Grafton. The main objective is to provide a clear and intuitive view of the Hurst cycles. Credits Original Concept : David Hickson - Hurst Cycles Theory Inspiration : Grafton - Hurst Diamond Notation Pivots Alternative Version : Fillipe dos Santos Main Features Identifies and displays pivots in multiple time cycles Visual t
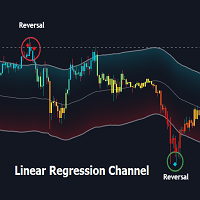
Overview:
The Linear Regression Channel Indicator is a versatile tool designed for Metatrader to help traders visualize price trends and potential reversal points. By calculating and plotting linear regression channels, bands, and future projections, this indicator provides comprehensive insights into market dynamics. It can highlight overbought and oversold conditions, identify trend direction, and offer visual cues for future price movements.
Key Features:
Linear Regression Bands: ( figur

Description :
The "MVRV by Age Approximation" indicator offers traders a unique on-chart visualization of the Market Value to Realized Value (MVRV) ratio, segmented by holding periods, or "age cohorts." This indicator is designed to approximate the MVRV metric by categorizing assets into short-term, mid-term, and long-term holders, providing a clear view of the relative unrealized profit or loss across different holding periods. Using simple moving averages over adjustable periods, this indicato
MLD RSI MT5: Potencia al Máximo el RSI con Alertas Personalizadas Introducción El indicador MLD RSI para MT5 incorpora funcionalidades avanzadas al clásico Índice de Fuerza Relativa (RSI), incluidas alertas personalizables y confirmación de tendencias. Esta herramienta es ideal tanto para principiantes como para traders experimentados y es compatible con múltiples mercados, incluidos Forex, acciones, criptomonedas e índices sintéticos. ¿Qué es el RSI? El Índice de Fuerza Relativa (RSI) mide el i

GTrendDetector Индикатор GTrendDetector предоставляет сигналы на покупку и продажу. Индикатор рассчитывает границы канала по рекурсивному методу, а также среднее, полученное из этих границ. Выход цены закрытия за границы канала генерирует сигналы на покупку/продажу. Индикатор рисуте границы канала, окрашивает область между средней и ценой закрытия, и выводит на график значки в местах смены тенденции. Входные параметры: Source - тип цены для расчета границ канала. Length - количество баров для ра
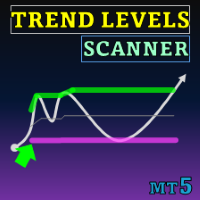
Special offer : ALL TOOLS , just $35 each! New tools will be $30 for the first week or the first 3 purchases ! Trading Tools Channel on MQL5 : Join my MQL5 channel to update the latest news from me El indicador Niveles de Tendencia (Trend Levels) está meticulosamente diseñado para identificar niveles de tendencia críticos — Alto, Medio y Bajo — durante los movimientos del mercado. Con cálculos en tiempo real basados en los valores más altos, más bajos y de nivel medio a lo largo de

Here I bring you the Binary Boss OT1.0 MT5 indicator that provides signals for trading the rise or fall, higher or lower, call or put and more different options on the binary brokers.
This arrow indicator uses the technical trading rules, the candle patterns .The arrow appears at the opening of the candle for quick entries and the indicator provides multiple signals a day for more chances.
Instructions: On Deriv or Iqoptions, set time duration between 40 sec and 5 minutes.(According to your

Makuchaku Super Order Block
Introducing the "Makuchaku Super Order Block" – an all-in-one, powerhouse trading tool that combines the market’s most effective indicators in one, intuitive interface. This is more than just an indicator; it's a comprehensive market intelligence solution. Engineered for peak performance and precision, OBFVG is the best indicator of 2024 and a must-have for every serious trader. Let's dive into the key features of this indicator and how each can enhance your trading
Pivot Lines (PL) User Guide Overview and Features The Pivot Lines Indicator (PL) provides traders with a powerful tool for identifying potential support and resistance levels based on well-established pivot point calculation methods. By offering insights into possible price turning points, this indicator helps traders make more informed trading decisions and refine their entry and exit strategies. With customizable settings for different timeframes and calculation methods, PL is versatile and a

Fibo Daily Channel Indicator The Indicator is a powerful tool for traders, providing precise daily support and resistance levels based on Fibonacci retracement and extension calculations. This indicator automatically draws key pivot points (PP, R1, R2, S1, S2) as well as additional extension levels (R3, R4, S3, S4), helping traders identify potential reversal and breakout zones with ease. It includes customizable alerts and push notifications, allowing traders to receive updates whenever the pr
El indicador de riesgo de tendencia PRT encuentra partes de tendencia del movimiento de precios e indica la presencia de la tendencia mediante un valor en el buffer. Puede utilizarse para operaciones planas para deshabilitar las operaciones cuando existe la posibilidad de que el precio salga del canal (recomendado para D1) en el que se realizan las operaciones.
Tiene dos parámetros de entrada:
• Rango de bandas: rango de cálculo de bandas • Desviación: valor de desviación (el ancho del canal
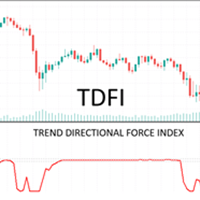
Trade Directional Force Index (TDFI) v1.0 One of the greatest challenges for trend traders lies in effectively timing entries and exits during periods of consolidation. These phases are often characterized by lower-than-average trading volume, making them tricky to navigate. In markets where volume data is unavailable, such as forex, the Trend Direction and Force Index (TDFI) serves as a reliable substitute. This is because volatility and volume are closely intertwined. What if you had an indica

Desbloquea el poder de la inteligencia artificial con Neural FX Indicator de SS7Trader, una herramienta avanzada basada en redes neuronales diseñada para optimizar tu trading en múltiples mercados. Ya sea que operes en Forex, acciones, criptomonedas, índices o XAUUSD, este potente indicador ofrece señales de compra y venta claras y no repintadas que permanecen sin cambios, permitiéndote tomar decisiones seguras en tiempo real. El Neural FX Indicator está disponible exclusivamente para MetaTrader

Sliding Average with Bollinger Bands General Information: The indicator combines two popular technical analysis tools: Moving Averages (Simple Moving Average and Smoothed Moving Average) to assess the trend. Bollinger Bands to analyze market volatility. Main Components: SMA (Simple Moving Average): The simple moving average is calculated as the arithmetic mean of prices over a specified period. Formula: = (1 + 2 + ⋯ + ) / Where: 1, 2, …, are the closing prices for p
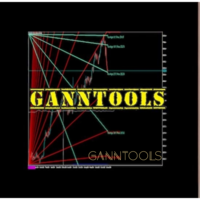
GannTools Indicator
The GannTools Indicator is a powerful trading tool inspired by W.D. Gann's strategies. This indicator provides traders with dynamic support and resistance levels, trend analysis, and key price patterns using Gann angles and cycles. Key Features: Customizable Gann Fans, Angles, and Cycles for precise market analysis. Automatic identification of key price levels and trend directions. Works on all timeframes and instruments for flexible trading strategies. Integrated visualiza

The Optimized MACD Divergence indicator is a powerful tool designed to identify potential trading opportunities by detecting divergences between price action and the MACD indicator. It combines classic divergence analysis with candlestick pattern recognition and volume filtering to provide more accurate and reliable signals. How it Works The indicator operates on the following principles: MACD Calculation: It calculates the MACD indicator using user-defined parameters for fast EMA, slow EMA,
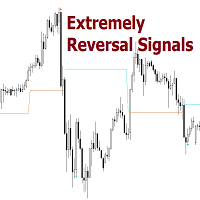
Reversal Signals [AlgoAlpha] – Master Market Reversals with Precision!
Elevate your trading strategy with the Reversal Signals indicator by AlgoAlpha. This advanced tool is designed to pinpoint potential bullish and bearish reversals by analyzing price action and, optionally, volume confirmations. It seamlessly combines reversal detection with trend analysis, giving you a comprehensive view of market dynamics to make informed trading decisions.
Key Features
Price Action Reve
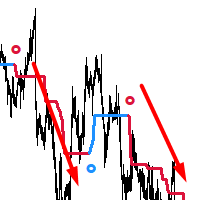
AdaptiveTrendHunter - Indicador de Detección Adaptativa de Tendencias
Características principales: Identificación sencilla de tendencias mediante códigos de color (azul para tendencias alcistas, rojo para tendencias bajistas) Señales claras de entrada marcadas con flechas Ajuste inteligente a la volatilidad del mercado Configuración personalizable de confirmación de tendencia Alertas opcionales para nuevas señales de trading Cómo utilizarlo: Seguimiento de tendencias: Observe las líneas azules q
The MACD Divergence Indicator is a powerful tool designed to identify Classical (Normal) Divergences on the MACD, which can signal potential market reversals or continuation trends. Divergences occur when the price and the indicator move in opposing directions, highlighting potential shifts in momentum. What is a Classical (Normal) Divergence? Classical Divergences are categorized into two main types: Bullish Divergence: Occurs when the price forms lower lows, but the MACD forms higher lows. Thi
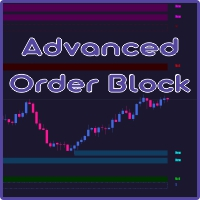
A2 Trade proudly present to you, Advanced and FULLY CUSTOMIZABLE Order Block to assist the traders for find the Supply and Demand or Support and Resistance Levels. The traders could customize of each areas to make it different from another areas, and the traders also can set the Supply and Demand or Support and Resistance timeframes themselves. hope you'll enjoy it.
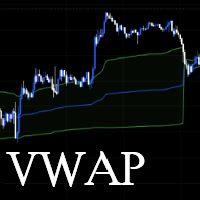
Introducing the Game-Changing SVWAP v2 Expert Advisor! The SVWAP v2 Expert Advisor is not just another tool in your trading arsenal – it’s a revolution in market analysis. Built with precision and cutting-edge technology, this dynamic EA combines the immense power of the Volume Weighted Average Price (VWAP) indicator with intelligently calibrated deviation bands to deliver unparalleled market insights . Designed for traders who demand excellence , SVWAP v2 is the ultimate indicator for dominatin
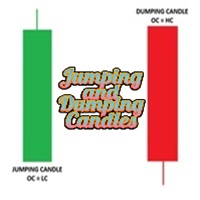
Jumping and Dumping Candles Detector Also known as Pumping and Dumping Candles Detector. Multi - timeframe. Scans historical candles. For MT5 program. With this amazing indicator, adopt your own strategy. Note: Share your strategy with us and we automate it.
Check out my 98% win rate signal : https://www.mql5.com/en/signals/2278767?source=Site +Profile (Expired)

This is the MT5 Ichimoku Dashboard. This dashboard will scan multiple timeframes in MT5 platform, from M1 chart to D1 chart. It will send the buy/sell signals by alert on the platform or sending notification to your phone or message you via a email.
The buy/sell signal can be set by cross of multiple lines: ex: tenkan-sen line, kijun-sen line, the cloud or you can select the price to cross or above/below the kumo cloud... Please discovery in the input setting, You can find the rule that you are

Copytrading en Tiempo Real – Comunidad Ola Trading Si ya probaste nuestras operaciones en modo demo , ahora podés dar el siguiente paso y comenzar a copiar operaciones en tiempo real junto a nuestra comunidad. En esta sección, tendrás acceso a señales reales de trading operadas por el equipo de Ola Trading , activo de lunes a domingo . Una vez que te suscribas, vas a poder copiar nuestras operaciones directamente en tu cuenta real . ¿Cómo comenzar? Suscribite en nuestra página a través de

This indicator combines two tools: MACD and OsMA . MACD is displayed as two lines: The black line represents the main MACD line. The orange line represents the MACD signal line. OsMA Histogram is shown in two colors: Green bars indicate growth. Red bars indicate decline. You can customize the line colors and thickness in the settings. This indicator serves as an addition to the Combo View Impulse System indicator but can also be used independently. Parameters: Fast EMA
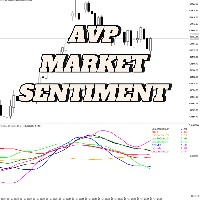
AVP Market Sentiment es una herramienta desarrollada para analizar la relación entre varios activos en la misma ventana de subgráfico. Es especialmente útil para comparar tickers con una interrelación bien estudiada (como los índices futuros versus el VIX, por ejemplo). Es muy útil cuando se desea monitorear varios tickers simultáneamente para la toma de decisiones en uno o más de ellos. La herramienta permite a los usuarios elegir los tipos de medias móviles utilizadas en la plataforma, así com

FTU Qs Buy Sell Arrow MT5
The indicator is for MT5 platform, can be used stand alone but best combined with other indicators or strategies. Many arrow changes at certain times, so best to filter the signals using minimum one concept or strategy Combines various indicators such as stochastic, rsi and moving average to draw an arrow for suggestion of entry or change in trend
Indicator Features: Sell and Buy arrows with settings Visual and sound alert Colour change, more features coming soon Ne

Safe travel is possible only on a road with good markings and correct road signs . Due to the very active use of my indicator on MT4 , I decided to switch it to MT5 . The indicator shows : - pulse waves ( bold sloping lines ) ; - corrective waves ( thin inclined waves ) ; - Series of waves up ( blue ) ; - wave series down ( purple ) ; - wave series lengths ( numbers near the zigzag vertices ) ; - breakdown levels of a series of waves ( short green and red lines ) ; - profit targets ( Fibonacci g

BoomCrash Turbo
"¡Comercio con máxima velocidad y precisión!" BoomCrash Turbo es un poderoso indicador semiautomático diseñado específicamente para operar con los índices Boom y Crash en la plataforma MetaTrader 5. Es ideal para traders que buscan mejorar sus resultados y aprovechar al máximo las oportunidades del mercado. Características del indicador:
Señales precisas: Notificaciones en tiempo real para entradas y salidas de operaciones.
Toma de decisiones acelerada: Perfecto para re

This indicator combines several functionalities: Value Zone Displays two exponential moving averages (EMAs): 13-period EMA in red. 22-period EMA in blue. Impulse System (based on Dr. Alexander Elder's methodology) Candles are color-coded to indicate trade restrictions: Red candles prohibit buying. Green candles prohibit selling. Blue candles allow both buying and selling. Recommended for use on two timeframes for enhanced analysis. 3x ATR Channel A channel based on 3 times the AT

Description: The "Supports and Resistances with Daily Pivots v2" indicator is a comprehensive tool that displays pivot points and support/resistance levels on the chart. It provides both daily, weekly, and monthly pivot levels, helping traders identify potential turning points and support/resistance areas. The indicator also includes alerts to notify traders when the price reaches these levels.
Key Features Pivot Point Types: Standard Pivot: Calculates pivot points using the standard method. F

Индикатор собирает данные из биржевого стакана, суммируя отложенные ордера на покупку или продажу. Далее, по сумме ордеров определяется общее направление, куда смотрят участники рынка. Если суммарные покупки/продажи превышают определенный коэффициент, то производится сигнал. Настройки: Timer=5 // указывается как часто обновлять данные по рынку в секундах. Чаще чем раз в 10 секунд ставить не рекомендуется. X-size =700 // размер окна по оси Х. Y-size=650// размер окна по оси Y. Only "Market Watch"

Trend Indicator with Adaptive Color Change: The Perfect Tool for Effective Trading! Looking to determine the trend direction with maximum precision? Meet our trend indicator , which dynamically changes the color of its moving average based on the current market direction. This tool is suitable for both beginners and experienced traders, helping you make informed decisions with clear, actionable signals. What You’ll Get: Adaptive Trend Analysis : The moving average changes its color according to

Gráfico combinado "Pillar Candles" Si prefiere operar sin indicadores, entonces este indicador será el único en su arsenal. Transformará su gráfico y hará que su análisis del mercado sea más claro.
¿Qué problema resuelve este indicador? Lo más importante para operar con éxito es ver claramente los valores OHLC. La mayoría de los operadores utilizan el tipo de gráfico de velas japonesas. Pero tiene una desventaja significativa. Debido al diferente grosor de los cuerpos y sombras, el ojo human

Swing Points Pro v2 – Enhanced Highs and Lows Indicator with Push Notifications Overview :
The Swing Points Pro v2 indicator is a powerful and reliable tool designed to help traders identify critical swing highs and lows on their charts. Whether you trade Forex, Stocks, or Crypto, this updated version provides advanced features to enhance your market analysis, with real-time push notifications for key market movements. Key Features : Accurate Swing Identification : Pinpoints major swing highs a
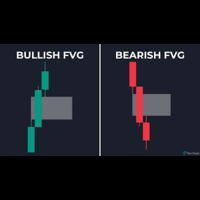
It identifies fair value gaps which are currently valid. Settings: Bullish FVG Color: To set the color of bearish FVGs. Bearish FVG Color: To set the color of bearish FVGs. Minimum Size: For filtering the signals. The restricts a minimum size for the FVG to be considered valid. For custom additions you can reach out to developer here MT4 Version available here

iExposure Fox Wave – Comprehensive Position Monitoring Indicator iExposure Fox Wave is an advanced MetaTrader indicator designed to provide detailed monitoring of all open trading positions in a clear, tabular format. This tool is perfect for traders who want all essential trade information in one place. Key Features: Symbol: Displays the instruments (currency pairs or other symbols) with open positions. Deals: Number of open trades (transactions) for each symbol. Buy lots & Buy price: Total vol

Introducing PivotWave – your ultimate trading companion that redefines precision and market analysis. Designed with traders in mind, PivotWave is more than just an indicator; it’s a powerful tool that captures the pulse of the market, identifying key turning points and trends with pinpoint accuracy. PivotWave leverages advanced algorithms to provide clear visual signals for optimal entry and exit points, making it easier for traders to navigate volatile market conditions. Whether you are a begin
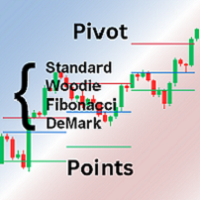
This Pivot Points Indicator can be switched between the following well-known types: Standard/Classic (7 levels) Woodie (5 levels) Fibonacci (7 levels) DeMark (3 levels) Pivot Points are calculated based on the previous day's values - according to the most common formulas on the web - and serve as an important tool for many traders, especially in day trading. They indicate possible resistance and support where increased buyer and seller interest can be expected. A common trading approach, for
¿Sabe usted por qué MetaTrader Market es el mejor lugar para vender estrategias comerciales e indicadores técnicos? Con nosotros, el desarrollador no tiene que perder tiempo y fuerzas en publicidad, protección del programa y ajustes de cuentas con los compradores. Todo eso ya está hecho.
Está perdiendo oportunidades comerciales:
- Aplicaciones de trading gratuitas
- 8 000+ señales para copiar
- Noticias económicas para analizar los mercados financieros
Registro
Entrada
Si no tiene cuenta de usuario, regístrese
Para iniciar sesión y usar el sitio web MQL5.com es necesario permitir el uso de Сookies.
Por favor, active este ajuste en su navegador, de lo contrario, no podrá iniciar sesión.