Indicadores técnicos de pago para MetaTrader 5 - 2

The Volume+ and VSA Signals indicator for MT5 is based on the Volume Spread Analysis (VSA) methodology to provide the signals. The signals are displayed at closing of bars on the main window or subwindow in the form of symbols. The symbols are not repainting. The indicator produces a signal on an individual bar and this signal is not buy or sell signal. When a minor trend goes in the opposite direction of a major trend, there are sequences of major trend-following signals that give a higher pro

Create and trade timeframes in seconds. The bar time duration is freely adjustable from 1 second and up. The chart is accurately constructed using real ticks from the broker's server. Main characteristics The indicator is an overlay on the main chart, making it possible to utilize one-click trading and on-chart order manipulation. History calculated using real tick data. Built-in technical studies: 4 moving averages (Simple, Exponential, Smooth, Linear-weighted, Volume-weighted using tick or rea

Contact me to send you instruction and add you in group.
QM (Quasimodo) Pattern is based on Read The Market(RTM) concepts. The purpose of this model is to face the big players of the market (financial institutions and banks), As you know in financial markets, big traders try to fool small traders, but RTM prevent traders from getting trapped. This style is formed in terms of price candles and presented according to market supply and demand areas and no price oscillator is used in it. RTM con
ICT Template Indicator visualizes and automatically updates all important ICT elements for Scalpers, Day and Swing traders. It allows you too keep your chart clean and bring any elements by just one click to the buttons. Thanks to mobile notifications on external liquidity levels, you will not miss any opportunity and you don't have to sit behind the screens whole day. Each element has fully customizable colours, width, line types, max timeframe to be shown etc... so you can really tweak your ch

Ali Levels Pro is an indicator designed to identify and draw levels of interest including: Opening Range High/Low with seconds precision, Previous Session High/Low (if you are a Intraday trader who trades Indices or Commodities maybe you want to know yesterday New York Session high and low), Overnight Session High/Low, Previous Day High/Low, Previous Week High/Low, and Previous Month High/Low.
Traders use this levels as support and resistance levels. By searching for confluences between

Smart Fibo Zones are powerful, auto-generated Fibonacci Retracements that are anchored to key market structure shifts . These zones serve as critical Supply and Demand levels, guiding you to identify potential price reactions and confirm market direction. Fibonacci calculations, widely used by professional traders, can be complex when it comes to identifying highs and lows. However, Smart Fibo Zones simplify this process by automatically highlighting order blocks and key zones, compl

This is the Full Version, to get the free version please contact me. The free version works on “USDJPY” charts. All symbols and time frames scanner. Contact me after payment to send you the User-Manual PDF File. OVER and UNDER
Over & Under pattern is an advanced price action trading concept in the trading industry. The Over & Under pattern is more than a confluence pattern or entry technique than a trading strategy. It is a reversal pattern that is created after a significant obvious trend. I

Un patrón de gráfico de triángulo simétrico representa un período de contracción y consolidación antes de que el precio se vea obligado a romper al alza o romperse. Una ruptura desde la línea de tendencia inferior marca el inicio de una nueva tendencia bajista, mientras que una ruptura desde la línea de tendencia superior indica el inicio de una nueva tendencia alcista.
Versión MT4 disponible aquí: https://www.mql5.com/en/market/product/68709/
Este indicador identifica estos patrones y le a
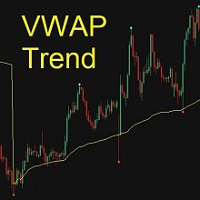
The Anchored VWAP (Volume-Weighted Average Price) indicator is a popular technical analysis tool used by traders and investors to analyze the price action over a period of time. This indicator will automatically identify the trend turning points to help traders more easily see when market is continuing the trend, pulling back, or reversing by crossing the VWAP line. Stack on multiple time frame periods to use like other moving average indicators. You can customize price calculatio

Imbalance / FVG MTF Mark Imbalance on chart of Selected Multi Time frames. Trend is Manually set to filter signals in the chosen direction by a button on the chart. .
Futures Auto Mark Imbalance / FVG on chart on selected time frames
Select time frames by buttons on chart
Popup Alert, Push Notification or email when New Imbalance Form
Popup Alert, Push Notification or email when Imbalance is Taken out
Select Alert Mode to be a single or multiple Imbalance ( OR / AND option ) when Imbalan

Smart Drawing Assist PRO MT5. Buttons will appears next to the selected object. The buttons are straightforward and amazingly easy to use. Features are as follow: Draw zigzag . Enabling you to draw patterns, draw zigzag, and draw shapes. All you have to do is click the button and start clicking point to point and it will draw automatically. Change object color . Rectangle/Trendline/HLine/Vline/Text/Price Arrow/Arrowed Line/ and your suggestion please. Flatten trendline . make a perfect flat line

The Average Price indicator calculates the average prices of BUY (LONG) and SELL (SHORT) open positions, taking into account the size of open positions, commissions and swaps.
The indicator builds the average line of LONG open positions, after crossing which, from the bottom up, the total profit for all LONG positions for the current instrument becomes greater than 0.
The indicator builds the average line of SHORT open positions, after crossing which, from top to bottom, the total profit f

This is an advanced multi-timeframe version of the popular Hull Moving Average (HMA) Features Two lines of the Hull indicator of different timeframes on the same chart. The HMA line of the higher timeframe defines the trend, and the HMA line of the current timeframe defines the short-term price movements. A graphical panel with HMA indicator data from all timeframes at the same time . If the HMA switched its direction on any timeframe, the panel displays a question or exclamation mark with a tex

KT Volume Profile shows the volume accumulation data as a histogram on the y-axis providing an ability to find out the trading activity over specified time periods and price levels.
Point of Control (POC) in a Volume Profile
POC represents a price level that coincides with the highest traded volume within the whole volume profile histogram. POC is mostly used as a support/resistance or as an essential price level where market retest before going in a specific direction.
Features Very easy

The Smart Liquidity Profile is color-coded based on the importance of the traded activity at specific price levels, allowing traders to identify significant price levels such as support and resistance levels, supply and demand zones, liquidity gaps, consolidation zones, Buy-Side/Sell-Side Liquidity and so on. Smart Liquidity Profile allows users to choose from a number of different time periods including 'Auto,' 'Fixed Range,' 'Swing High,' 'Swing Low,' 'Session,' 'Day,' 'Week,' 'Month,' 'Quart

Heikin Ashi candlesticks are a powerful tool for traders, offering a clear and smooth visualization of market trends. Unlike traditional candlesticks, they filter out market noise, providing a cleaner view of the market's direction and strength, which helps traders make more informed decisions. The Hull Heikin Ashi Smoothed indicator from Minions Labs takes this a step further by integrating the Hull Moving Average for enhanced smoothing and precision. This indicator not only simplifies trend id

The indicator shows divergence between the slope of lines connecting price and MACD histogram peaks or troughs. A bullish divergence (actually a convergence) occurs when the lines connecting MACD troughs and the lines connecting the corresponding troughs on the price chart have opposite slopes and are converging. A bearish divergence occurs when the lines connecting MACD peaks and the lines connecting corresponding price peaks have opposite slopes and are diverging. In such a case, the indicato
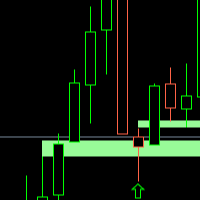
FVG WATCHER is an indicator that helps traders identify fair value gaps in the market. The indicator draws fair value gaps and alerts the user when the fair value gap has been swept. It allows users to specify how it should be swept, what time range to alert, and the size of the fair value gap to alert. It also allows the user to apply a moving average trend filter for better choice of alerts. The indicator also allows push mobile notifications. What makes FVG Watcher special is that it can be
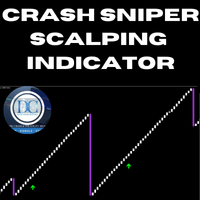
Crash Sniper Scalping Indicator for MQL5
The **Crash Sniper Scalping Indicator** is a powerful and reliable tool specifically designed for traders looking to profit from the Crash markets. Whether trading Crash 1000, Crash 900, Crash 600, Crash 500, or Crash 300 indices, this indicator provides high-precision signals to simplify scalping. With its clear visual cues and accuracy, it's an essential tool for traders aiming to capitalize on quick market movements.
Key Features: - **Multi-Timefr

Fully featured Pivots and Levels indicator Pivots: Floor (normal), Woody, Camarilla, Fibonacci Levels: ATR, Historical Volatility with standard deviations, Close Price Volatility with standard deviations
Features: - 4 +/- levels
- MTF, pivots/levels based on Daily, Weekly, 4hr or even 15min - Hour and minute time offset
- Texts with prices and pip distances to central pivot/level - Inputs for Camarilla/Fibonacci/ATR/Volatility levels
- Alerts, popup, push, email, sound, live or completed ca

This indicator uses the metaquotes ZigZag indicator as base to plot fibonacci extension and fibonacci retracement based in the Elliot waves. A fibonacci retracement will be plotted on every wave draw by the ZigZag. A fibonacci extension will be plotted only after the 2nd wave.
Both fibonacci will be updated over the same wave tendency. Supporting until 9 consecutive elliot waves.
Parameters:
Depth: How much the algorithm will iterate to find the lowest and highest candles Deviation: Amoun

This indicator is the mql version of the Twin Range Filter indicator. Description of TradingView version: An experiment to combine two range filters and plot the average of both to smooth out the signals.
This works significantly better than the typical ATR set-up, but there's still too much noise here to set and forget with bots. Use it as the basis of your own system with additional filtering on top. I welcome your suggestion for improving the indicator
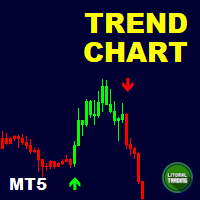
Are you the trend surfing type? Do you like to follow the big sharks? Nope? So you are the type that trades reversion? Awaiting the trend exhaustion and entering on trade?
So this indicator is for you ! With it is extremely easy to identify the trend and when it reverses because the chart is automatically colored according to a defined moving average. You can change it settings and make it your own (or hide it).
In addition it is possible to have indicative arrows on chart and also popup and
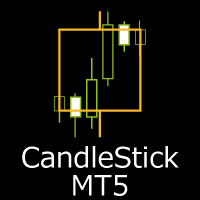
What you can do with CandleStick CandleStick is a useful indicator for doing MTF analysis. This indicator displays the CandleStick of another time frame on the chart . By understanding the information in multiple time charts at the same time, it is easier to understand the overall market view. It is also a useful tool for validating and studying past quotes and trades. There are similar products made by others, but I designed and developed it so that it is easy for me to use.
Features of Candl
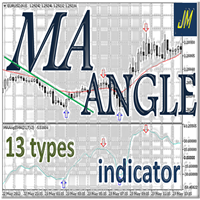
"MA Angle 13 types" is an indicator that informs of the inclination angle of the moving average curve that is displayed on the screen. It allows selecting the MA method to use. You can also select the period, the price and the number of bars the angle is calculated for. In addition, "factorVisual" parameter adjusts the information about the MA curve angle displayed on this screen. The angle is calculated from your tangent (price change per minute). You can select up to 13 types of MA, 9 standa

GG TrendBar Indicator - Your Multitimeframe ADX Trading Solution Experience the power of multi-timeframe trading with the "GG TrendBar MT5 Indicator." This versatile tool, built upon the ADX indicator, offers precise insights by considering multiple timeframes, ensuring you make well-informed trading decisions. Basic Details : Indicator Type : GG TrendBar Indicator (Multi-Timeframe ADX) Key Metrics : Real-time ADX analysis across multiple timeframes. Customization : Enable or disable specific ti
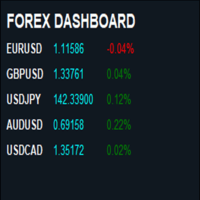
What’s the Forex Dashboard All About? Alright, so you’re diving into the world of forex trading, and you’ve probably heard about dashboards. But what are they exactly? Think of it as your command center for keeping tabs on multiple currency pairs all at once. It’s like having a radar that tells you what’s happening in the forex market without having to sift through tons of charts and data. What Does It Show You? Currency Pairs : You’ll see a list of popular currency pairs, like EUR/USD (Euro to
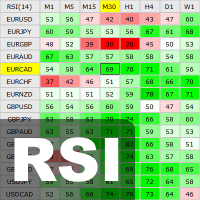
This indicator shows the current RSI values for multiple symbols and multiple timeframes and allows you to switch between timeframes and symbols with one click directly from the matrix. With this indicator, you can analyze large number of symbols across multiple timeframes and detect the strongest trends in just a few seconds.
Features Shows RSI values for multiple symbols and timeframes simultaneously. Colored cells with progressive color intensity depending on the RSI values. Ability to chan

Description of the Indicator The indicator "BullsBearsPulse" is designed for MetaTrader 5 and provides a visual representation of the Bulls Power and Bears Power indicators. These indicators are useful tools for technical analysis, particularly for the EUR/USD currency pair, to help traders identify potential trading opportunities. Functionality Bulls Power : This indicator measures the strength of the bulls (buyers) in the market. It calculates the difference between the highest price and a 20

The balance of supply and demand is a simple and effective market analysis method. The supply and demand diagram can show you in advance, even before the trend reversal, where the supply ends and the demand is already emerging, where the demand ends and the supply is emerging, while substantially increasing the probability of making a deal in the right direction and with a high profit factor.
Indicator signals The indicator uses the price/volume values to generate signals: ED – excess demand.

<p><b>The Power of 3 ICT</b> es la mejor herramienta para ayudarte a vigilar HTF mientras operas en marcos de tiempo más bajos. Este indicador te permitirá ver hasta 2 velas HTF diferentes en tu gráfico LTF, de esa manera siempre sabrás cómo se ve la acción del precio actual en los marcos de tiempo más altos y si estás tomando tu operación siguiendo la tendencia del marco de tiempo más alto.</p>
<div class="atten"> <p><a href=" https://www.mql5.com/en/blogs/post/758051 " title=" https://ww

# 33% off - limited time only # ChartSync Pro MT5 is an indicator, designed for the MetaTrader 5 trading terminals. It enables the trader to perform better multi-timeframe technical analysis, by synchronizing symbols and objects into virtually unlimited charts. Built by traders for traders! Telegram Premium Support - Dd you purchase the Chart Sync indicator and need a bit of help? Send us a screenshot with your purchase and your Telegram ID so we can add you to our premium support Telegram g

This indicator converted from 5 min Buy and Sell Range Filter - guikroth version on TradingView Popularity of the Range Filter
The Range Filter is a very popular and effective indicator in its own right, with adjustments to the few simple settings it is possible to use the Range Filter for helping filter price movement, whether helping to determine trend direction or ranges, to timing breakout or even reversal entries. Its practical versatility makes it ideal for integrating it's signals into

The indicator displays the delta and the cumulative delta based on the "Time & Sales" deals list data. In addition to the standard timeframes, the indicator displays data regarding the seconds timeframes (S5, S10, S15, S20, S30) to choose from. Using the rectangle, user can select an arbitrary area in the indicator subwindow to view the ratio of the volumes of deals of buyers and sellers within this area.
Indicator features:
The indicator works correctly only on those trading symbols for whi

Was: $99 Now: $34 Blahtech Daily Range indicator displays the average daily range alongside the individual session ranges. Using the daily open price as a reference the indicator shows fixed range and dynamic range targets as lines on the charts. These lines clearly show when the average range has been exhausted. Daily and session ranges can be useful for confirming entries or setting targets and is an excellent odds enhancer for many trading systems. Links [ Documentation | Install |

Descripción :
El indicador "Estructura de mercado HH HL LH LL" es una herramienta potente y al mismo tiempo sencilla para analizar la dinámica de precios en los mercados financieros. Este indicador ayuda a los comerciantes e inversores a identificar cambios en las tendencias e identificar puntos importantes en las series temporales de precios.
Componentes clave del indicador:
HH (máximo más alto): el máximo en el que el precio cierra por encima del máximo anterior. HH indica una tendenc

To download MT4 version please click here . - This is the exact conversion from TradingView: "Linear Regression Candles" By "ugurvu". - The overall look of the indicator is like Heiken Ashi. - It can be used as a trend confirmation indicator to detect the right trend direction. - This indicator lets you read the buffers for Candles' OHLC. - This is a non-repaint and light processing load indicator - You can message in private chat for further changes you need. Thanks

The indicator displays volume clusters or volume profiles to choose from. For trading symbols which contain the tape of deals, the indicator can perform calculations based on the tape of deals.
Input variables
StepPoint - cluster step in points, if the value is zero, the step is assigned automatically. HistoryTicks - size of tick history (for VolumeType in the mode TimeAndSales). AssociatedTimeframe - binding the indicator to the specified timeframe of the chart, if the value is equal to

ATLogic - Análisis de criptomonedas: navega por los volátiles mercados de criptomonedas con zonas de entrada y salida claramente definidas.
Indicador ATLogic: Una herramienta versátil para todos los instrumentos de trading ATLogic es una herramienta integral y fácil de usar para el análisis técnico, diseñada para una amplia gama de instrumentos financieros, incluyendo todos los pares de divisas, índices y criptomonedas. Este indicador versátil ofrece a los traders poderosas perspectivas en div

To get access to MT4 version please contact in private messages. This is the exact conversion from TradingView: " Impulse MACD" by LazyBear.
This is a light-load processing and non-repaint indicator. All input options are available except candle coloring option. Buffers are available for processing in EAs. You can message in private chat for further changes you need.

** All Symbols x All Timeframes scan just by pressing scanner button ** *** Contact me to send you instruction and add you in "ABCD scanner group" for sharing or seeing experiences with other users. Introduction This indicator scans AB=CD retracement patterns in all charts. The ABCD is the basic foundation for all harmonic patterns and highly repetitive with a high success rate . The ABCD Scanner indicator is a scanner reversal ABCD pattern that helps you identify when the price is about to cha
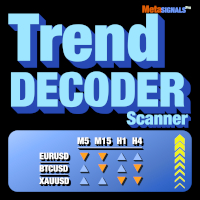
Obtenga señales de TrendDECODER para varios activos y varias unidades de tiempo | Determine la mejor unidad de tiempo para entrar | Maximice sus beneficios y operaciones ganadoras Indicador y escáner sin repintado y sin retrasos - ideal para el comercio manual y automatizado - para todos los activos y todas las unidades de tiempo 49$ para las primeras 50 copias - luego 99$ Después de su compra, por favor, deje un comentario o una reseña y le enviaremos un indicador EXTRA valorado en 99$

Very powerful indicator! converted from TradingView with upgraded alerts and added notifications. Ideal use in EAs.
Use as a supplementary Indicator to confirm your entries, but it is as good on it's own.
The indicator consists of 3 different Trend Meters and a 2 Trend Bars which are used to confirm trend
How to Use:
The more Trend meters are lit up the better =>>
-more GREEN COLOR at one bar means more confirmation to open buy trade,
- more RED COLOR signals for one bar = more

Quieres convertirte en un trader de 5 estrellas constantemente rentable? 1. Lee la descripción básica de nuestro sencillo trading sistema y su mayor actualización de estrategia en 2020 2. Envíe una captura de pantalla de su compra para obtener su invitación personal a nuestro exclusivo chat de trading
Lighthouse es un indicador de soporte y resistencia increíblemente preciso y fiable.
Muestra los niveles de trading más importantes y los dibuja según su relevancia.
Si un nivel se

Indicador Heikin Ashi multidivisa y multiplazo. Muestra el estado actual del mercado. En el panel del escáner puede ver la dirección, la fuerza y el número de barras de la tendencia actual. Las velas de Consolidación/Reversión también se muestran usando colores. Puede especificar las monedas y períodos que desee en los parámetros. Además, el indicador puede enviar notificaciones cuando cambia la tendencia o cuando aparecen velas de reversión y consolidación (dojis). Al hacer clic en una celda,

The indicator displays market profiles of any duration in any place on the chart. Simply create a rectangle on the chart and this rectangle will be automatically filled by the profile. Change the size of the rectangle or move it - the profile will automatically follow the changes.
Operation features
The indicator is controlled directly from the chart window using the panel of buttons and fields for entering parameters. In the lower right corner of the chart window there is a pop-up "AP" but

This indicator is converted from UT Bot alerts indicator by @QuantNomad of Trading View to MT5. its considering ATR and creating new candles on chart and also is giving good entry points based on its candles. all buffers of new candles and also entry signals are included as buffer so can be used easily on any EA. there are also some different strategies on the internet that can be used or contact me to create it for you.

Easy Market makes the market easier to trade. It allows you to see an "eternally" side (no trend) market, making it extremely easy to see when the price is overbought or oversold. Both trend and consolidation traders will like Easy Market. You can use it as an auxiliary window (below chart) or in full screen mode. See the screenshots and note how it gives you accurate entries! If you have any doubt or suggestion, please, contact us! Ejoy!
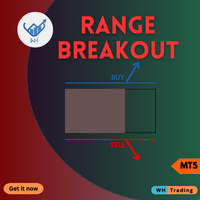
Desbloquee una nueva dimensión del trading con nuestro indicador MQL5 de vanguardia, Range BreakOut MT5
Esta poderosa herramienta está diseñada para identificar y capitalizar los movimientos de precios a medida que salen de los rangos establecidos.
proporcionándole la precisión y confianza necesarias para prosperar en el dinámico mundo de los mercados financieros.
Versión MT4 : WH Range BreakOut MT4
Características:
Detección de rango precisa. Señales de ruptura en tiempo real. Pará

Libera el Potencial de tus Operaciones con el Indicador AlphaWave! Tranquilidad en tus Operaciones: El Indicador AlphaWave ha sido diseñado para traer calma a tus operaciones, suavizando el gráfico y proporcionando una lectura precisa de la dirección de la tendencia. Nunca ha sido tan fácil tomar decisiones de operación claras. Tecnología Revolucionaria de Suavizado con 10 Modos: Experimenta una presentación de gráfico suave y clara con el Indicador AlphaWave. La tecnología revolucionaria de su

** All Symbols x All Time frames scan just by pressing scanner button ** *** Contact me to send you instruction and add you in "Swing scanner group" for sharing or seeing experiences with other users. Introduction: Swing Scanner is the indicator designed to detect swings in the direction of the trend and possible reversal swings. The indicator studies several price and time vectors to track the aggregate trend direction and detects situations in which the market is oversold or overbou

Welcome to Propsense, the best solution for new and veteran traders with a simple FREE strategy! NEW to MT5! This indicator is a unique and affordable trading tool built on the teachings of a former bank trader. With this tool, you will be able to see inefficient points with ease. Additionally, traders will have a clean Heads Up Display which will show your running and closed P/L in pips AND currency units. As a highly requested option, a candle timer has been added which will allow you to j

El indicador encuentra los niveles de volumen de precio máximo y mínimo (perfil de mercado) en el gráfico de barras de trabajo para el número especificado de barras. Perfil compuesto. La altura del histograma es completamente automática y se adapta a cualquier instrumento y marco de tiempo. Se utiliza un algoritmo de autor y no repite análogos conocidos. La altura de los dos histogramas es aproximadamente igual a la altura promedio de la vela. La alerta inteligente le ayudará a informar sobre
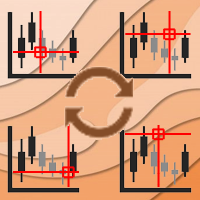
Async Charts is an indicator to synchronize charts and display a customized crosshair (cursor) on all selected charts. This is a useful utility for traders using multiple timeframes of analyzing multiple symbols for trade entry or exit.
Main Features : Real time Crosshair Synchronization on All Selected Charts
Supports Multiple Timeframes and Multiple Symbols at the same time
Auto Scroll Option
Graphical Adjustment of Color, Font, Size, ...
Locking All or Locking Specific Charts
More and

Fractal Levels based on Higher Timeframe es una potente herramienta diseñada para construir precisos niveles de soporte y resistencia basados en fractales del marco temporal superior, le proporciona señales de compra y venta con convenientes alertas.
Cómo funciona : El indicador analiza los niveles fractales en el marco temporal superior y los muestra en su gráfico actual. Puede ajustar fácilmente el marco temporal superior en las propiedades del indicador para obtener la máxima precisión y r

Estilo visual de bandas VWAP 1.0 Los indicadores del mercado financiero son herramientas esenciales utilizadas por los comerciantes e inversores para analizar y tomar decisiones en los mercados financieros. VWAP y las Bandas de Bollinger son dos herramientas populares de análisis técnico utilizadas por los comerciantes para medir las tendencias del mercado y la volatilidad de los precios. En este producto, proponemos combinar los dos indicadores para crear un producto único que proporcione un a

Was: $69 Now: $34 Blahtech VWAP - Volume Weighted Average Price (VWAP) is the ratio of price to total volume. It provides an average price over a specified time interval. Links [ Install | Update | Documentation ] Feature Highlights
Configurable VWAP Line Sessions, intervals, anchored or continuous Previous day settlement line Standard Deviation bands Alerts at bar close or real time Automatic Broker or Tick volumes Significantly reduced CPU usage
Input Parameters
Expert Advisor
Tool converted from tradingview indicator. Modified version with pivot points calculated in a more intuitive way.
This tool displays relative volatility and directional trend. Excellent way to pickup diversions and reversals. Length can be lowered to 11 or 13 in settings to show price range.
Can be used to identify patterns such as parallel channels and likely direction of price action.

The indicator determines and marks the short-term lows and highs of the market on the chart according to Larry Williams` book "Long-term secrets to short-term trading". "Any time there is a daily low with higher lows on both sides of it, that low will be a short-term low. We know this because a study of market action will show that prices descended in the low day, then failed to make a new low, and thus turned up, marking that ultimate low as a short-term point. A short-term market high is just

This is the forex visual orders tool & forex position size (lot) calculator with intuitive panel. Risk Reward Ratio Indicator works on all kind of symbols: currency pairs, indices, metals, commodities, cryptocurrencies, etc.
If you want to make sure that Risk Reward Ratio Indicator works on your favorite symbols contact us ( visit our profile ) and ask for 7-day free trial to test this tool without limits. If you want to place orders easier, faster and more intuitive? If you like to mark tr

The draws trend lines with adjustable trend width, with trend breakout settings and notifications of trend breakout (Alert, Sound, Email) and of a new appeared arrow. Arrows point at the direction of the order to open (BUY, SELL).
Parameters MaxHistoryBars - the number of bars in the history. Depth (0 = automatic settings) - Search area. width trend ( 0 = automatic settings) - Trend width. (true = closed bars on direction trend),(false = just closed bars for line) - true = closure of candlesti

Diagrama de bloques: una forma alternativa de comercio Si es un comerciante que está confundido por las velas en innumerables gráficos, o no sabe cómo dibujar líneas o cómo dibujar líneas de soporte y resistencia, debería encontrar otro método de negociación que se adapte a sus necesidades en este momento. NS. Al igual que un conductor se detiene para una revisión completa después de encontrar problemas repetidamente, lo mismo ocurre con una transacción. El gráfico de ladrillos proporciona un mé
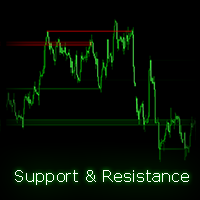
Encuentra y traza automáticamente canales de soporte y resistencia (S/R) en tu gráfico, haciendo que sea fácil identificar niveles clave. El indicador admite múltiples marcos de tiempo, lo que te permite mostrar canales de diferentes marcos de tiempo en tu gráfico actual. Además, ofrece colores transparentes para una mayor claridad visual y te permite personalizar los colores de los canales según tus preferencias. ¿Cómo funciona este indicador? El indicador encuentra puntos de giro (altos y bajo

A Heatmap with a Volume Profile is like a thermal imager or x-ray machine. It will help you to estimate the relative distribution of volume during the price movement and to understand the relationship between volume and price. Indicator Volume Profile "Volumos Maxima" is a powerful tool for analyzing this relationship. After simple experimentation with heatmap, you can find that each trading instrument has its own “ characteristic ” way of distributing volume. And this will help you to make a b

RSI ALARM (Para Metatrader 5) Este indicador funciona como un RSI normal con todas sus configuraciones (Periodicidad, colores, niveles, etc), pero adicional se puede establecer alarmas en el nivel superior e inferior (Ejemplo 70 y 30), con la posibilidad de ajustar estos niveles moviendo las líneas azul y roja para establecer los niveles superior e inferior. También se puede activar y desactivar una función adicional que crea una flecha en el grafico cuando se cumpla el RSI esperado superior o

This indicator shows external bars ("Aussenstäbe") in the chart in candle form.
The colors of the candles can be set individually.
Also different colors for bearish and bullish bars are possible.
In addition, the color of the wicks or outlines is also adjustable.
Outside bars are mentioned e.g. by Michael Voigt in the book "Das große Buch der Markttechnik".
All other candles are inner bars.

Gráfico de segundos para MetaTrader 5
Los indicadores le permiten crear gráficos en el terminal MetaTrader 5 con un período de tiempo en segundos. El período de tiempo en dicho gráfico se establece en segundos, no en minutos u horas. Por lo tanto, puede crear gráficos con un período de tiempo inferior a M1. Por ejemplo, S15 es un período de tiempo con un período de 15 segundos. Puede aplicar indicadores, asesores expertos y scripts al gráfico resultante.
Obtiene un gráfico completamente fun

Automatically detect bullish or bearish order blocks to optimize your trade entries with our powerful indicator. Ideal for traders following ICT (The Inner Circle Trader). Works with any asset type, including cryptocurrencies, stocks, and forex. Displays order blocks on multiple timeframes, from M2 to W1. Alerts you when an order block is detected, migrated, or a higher timeframe order block is created/migrated. Perfect for both scalping and swing trading. Enhanced by strong VSA (Volume Spread A

El indicador Boom and Crash Spike Detector está codificado en base a una estrategia avanzada principalmente para detectar Boom and Crash en los precios. Se implantaron algoritmos complejos para detectar auges y caídas de alta probabilidad en los precios. Alerta sobre posibles fases de auge o choque: Fase de auge: cuando el precio aumenta demasiado rápido. Crash Phase: cuando el precio baja demasiado rápido.
OFERTA POR TIEMPO LIMITADO: El indicador está disponible por solo 30 $ y de por vida.

Improved version of the free HMA Trend indicator (for MetaTrader 4) with statistical analysis. HMA Trend is a trend indicator based on the Hull Moving Average (HMA) with two periods. HMA with a slow period identifies the trend, while HMA with a fast period determines the short-term movements and signals in the trend direction.
The main differences from the free version: Ability to predict the probability of a trend reversal using analysis of history data. Plotting statistical charts for analyz
El Mercado MetaTrader es la única tienda donde se puede descargar la versión demo de un robot comercial y ponerla a prueba, e incluso optimizarla según los datos históricos.
Lea la descripción y los comentarios de los compradores sobre el producto que le interese, descárguelo directamente al terminal y compruebe cómo testar el robot comercial antes de la compra. Sólo con nosotros podrá hacerse una idea sobre el programa, sin pagar por ello.
Está perdiendo oportunidades comerciales:
- Aplicaciones de trading gratuitas
- 8 000+ señales para copiar
- Noticias económicas para analizar los mercados financieros
Registro
Entrada
Si no tiene cuenta de usuario, regístrese
Para iniciar sesión y usar el sitio web MQL5.com es necesario permitir el uso de Сookies.
Por favor, active este ajuste en su navegador, de lo contrario, no podrá iniciar sesión.