Indicadores técnicos para MetaTrader 5 - 7

Auto Fibo Expansion is an indicator that projects the Fibonacci expansion levels above and below the opening price of the day. It does the calculation based on the previous day and projects the levels on the current day. It is very efficient to find "psychological" zones of support and resistance. Its appearance is all configurable and you can set up to 30 different levels. Enjoy! This is a free indicator, but it took hours to develop. If you want to pay me a coffee, I appreciate a lot <3 PayP
FREE

Presentamos el poderoso indicador NRTR (Nick Rypock Trailing Reverse) - una herramienta técnica imprescindible para los traders que buscan identificar las inversiones de tendencia y establecer niveles efectivos de stop trailing. Desarrollado por Nick Rypock, este indicador cuenta con un algoritmo único que se adapta a las cambiantes condiciones del mercado, convirtiéndose en una adición invaluable para el arsenal de cualquier trader.
Aquí están las dos formas populares en las que los traders
FREE

CPR Pivot Lines It Will Draw Pivot Point R1,R2,R3 S1,S2,S3 Tc Bc Best Part Is That You Can Even Add Values Of High,Low,Close Manually Also To Get Your All Levels On Chart.So If Your Broker Data Of High ,Low ,Close Is Incorrect Then You Don’t Have To Depend On Them Anymore. You Can Even Modify All Lines Style. It Will Show Line In Floting Style And Not Continues Mess.
FREE

Lorentzian A.I Indicator System Revolutionize your trading strategy with the Lorentzian A.I Indicator System, an advanced tool designed for traders who demand precision and adaptability. Whether you're trading Crypto, Indices, Forex, or Stocks, this state-of-the-art indicator uses cutting-edge technology to keep you ahead of the market. Key Features: Advanced Lorentzian Classification (LC): Utilize sophisticated LC algorithms to generate precise buy and sell signals, ensuring you make informed
FREE

Optimized Trend Tracker OTT is an indicator that provides traders to find an existing trend or in another words to ser which side of the current trend we are on.
We are under the effect of the uptrend in cases where the prices are above OTT ,
under the influence of a downward trend, when prices are below OTT
it is possible to say that we are.
The first parameter in the OTT indicator set by the two parameters is the period/length.
OTT will be much sensitive to trend movements if i

To get access to MT4 version please click here . This is the exact conversion from TradingView: "SwingArm ATR Trend Indicator" by " vsnfnd ". Also known as : "Blackflag FTS" by "Jose Azcarate" This is a light-load processing and non-repaint indicator. All input options are available except multi time frame. Buffers are available for processing in EAs. Extra option to show buy and sell signal alerts. You can message in private chat for further changes you need.
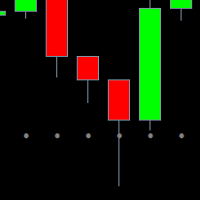
Cuántas ganancias se pierden debido a takeprofit instalado incorrectamente. Y Cuántos patrones de velas se negaron a trabajar debido al hecho de que en el lugar de su formación no había una zona de interés de los oferentes. Las ganancias perdidas y las entradas no rentables con la elección correcta de la dirección global siempre son una pena en el Triple. El comercio trae mucho dolor y caos cuando tratamos de operar sin objetivos claros. Por lo general, en los manuales de negociación o en las pr
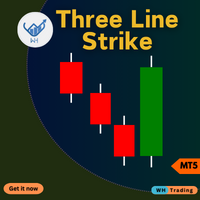
Indicador de huelga de tres líneas para MetaTrader 5 (MT5). Esta herramienta avanzada está diseñada para ayudarle a identificar posibles reversiones en el mercado con precisión y facilidad.
Ya sea usted un principiante o un operador experimentado, este indicador puede mejorar sus decisiones comerciales y maximizar sus ganancias. Contact me after purchase for guidance Características clave: Señales de reversión precisas : detecta posibles cambios de tendencia basados en el patrón de ejercic

RSI Crossover Alert es un poderoso sistema de notificación diseñado específicamente para operadores que utilizan el índice de fuerza relativa (RSI) en sus estrategias comerciales. Este indicador se enfoca en identificar cruces de RSI, que ocurren cuando la línea RSI rápida cruza por encima o por debajo de la línea RSI lenta. Al combinar estos cruces, el indicador filtra efectivamente las señales falsas, lo que permite a los operadores tomar decisiones comerciales más precisas. El RSI Cros

The Bollinger R (Bollinger Reversals) is designed to recognize short term high profitable counter trend patterns from the chart. This system combines both Bollinger Bands and mean reversion to define positions where the market could potentially reverse direction. This is the MT5 version of Bollinger R Description Bollinger Bands are well known in the trading community. I have added the concepts mean reversion and "distance between Price and a Moving Average" to help confirm and trade the “bounce

Brilliant Reversal Indicator for MetaTrader 5 - Your Ultimate Alert-Driven Trading Solution Unlock unparalleled trading success with the "Brilliant Reversal Indicator" tailored for MetaTrader 5. This powerful tool has been meticulously designed to empower traders by identifying critical reversal opportunities with lightning-fast alerts. Key Features: Precise Reversal Detection: The Brilliant Reversal Indicator for MT5 specializes in pinpointing potential trend reversals, providing you with a str

El indicador de sesiones de trading destaca los inicios y finales de cada sesión de trading. Versión de pago del producto Trading_Sessions_Indicator_Pro con la posibilidad de personalizar el Inicio/final de las sesiones >>>
[OPCIONES] Timeshift - Use si hay Sessions offset en el tiempo
[Parámetros preestablecidos:] Asian session Open=0; Asian session Close=9; Asian session OpenSummertime=1; Asian session CloseSummertime=10; European session Open=8; European session Close=17; European sessi
FREE

RSI with moving average is great to see when the price is overbought and oversold instead of RSI only.
INPU T PARAME TERS : RSI:
Period - RSI period.
Price - RSI applied price.
Color scheme - RSI color scheme (4 available). MOVING AVERAGE:
Period - MA period.
Type - MA type.
Apply - MA applica tion.
Shift - MA shif t (correc tion). PRICE LINE:
Show - specify if line with price, only line or nothing.
Style - line style. OTHER:
Overbought level - specify the level .
Overboug
FREE
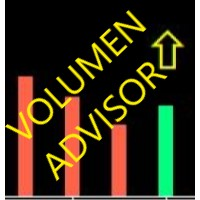
Útil herramienta que te avisará cuando detecte un posible movimiento por entrada de volumen. Fundamentalmente en Futuros.
Detecta zonas de NO OFERTA / NO DEMANDA.
Compara el volumen de la vela en curso con las anteriores. Si el volumen ha ido decreciendo, cuando los contratos actuales, superen al anterior, ALERTA!
- Puede cargarse en el gráfico principal o ventanas. - Para cualquier temporalidad. - Te avisa con una ventana emergente, en qué gráfico saltó la alarma. - Cuando detecta el pat
Stochastic Alert Indicator for MetaTrader 5
The Stochastic Alert Indicator is a powerful and customizable tool designed for the MetaTrader 5 platform, perfect for traders who want to monitor overbought and oversold conditions while staying informed of potential buying and selling pressure. Key Features: Overbought/Oversold Detection: Automatically detects when the market reaches overbought (above 80) or oversold (below 20) levels, providing you with timely alerts for potential reversal points
FREE

Supply and Demand indicator does not repaint as it counts the number of tests/retests occurred in the past x number of times. As a trader you need a path to be able to place your buy and sell trades such as: Supply and Demand, Falling & raising channels . Experienced trades will draw the key levels and channels around the timeframes. But, they will not be able to draw them on the small time frames as the price changes too frequent. This indicator is based on Shved supply and demand indicator, b
FREE

HiperCube AutoTrend Lines Este indicador le ayuda a identificar fácilmente soportes y resistencias, dibujar líneas en el gráfico y saber dónde se encuentra un punto importante en el mercado. Esta herramienta es la mejor manera de semiautomatizar sus operaciones, haciendo parte del trabajo por usted. La resistencia o el soporte son niveles importantes que a veces son difíciles de identificar, pero ahora eso no le causará más confusión.
HiperCube Autotrends está diseñado para cualquier marco te
FREE

Necessary for traders: tools and indicators Waves automatically calculate indicators, channel trend trading Perfect trend-wave automatic calculation channel calculation , MT4 Perfect trend-wave automatic calculation channel calculation , MT5 Local Trading copying Easy And Fast Copy , MT4 Easy And Fast Copy , MT5 Local Trading copying For DEMO Easy And Fast Copy , MT4 DEMO Easy And Fast Copy , MT5 DEMO Bandas de Bollinger avanzadas:
1. El riel de Bollinger cambiará de color con la dirección "
FREE

Understanding the levels of the previous day or week is very important information for your trading.
This indicateur allow to draw Previous day High/Low Previous week High/Low
Congifuration High & Low for: Previous day, week Line Style, color Label position, size, color Any questions or comments, send me a direct message here https://www.mql5.com/en/users/mvonline
FREE

Smart Tape - это индикатор ленты всех сделок с возможностью агрегации по цене и времени и фильтрацией по величине объема, включает в себя два отключаемых варианта отображения. Вариант 1: перемещаемое окно по графику со списком сделок (Time Sales). Список обновляется сверху вниз и не имеет возможности просмотра истории. Количество отображаемых строк выбирается пользователем. Порядок отображения в строке: время с точностью до миллисекунд, тип сделки (B - покупка или S - продажа

Что такое Heiken Ashi? Heiken Ashi — это метод построения графиков, который можно использовать для прогнозирования будущего движения цены. Он похож на традиционные свечные графики. Однако в отличие от обычного свечного графика, график Heiken Ashi пытается отфильтровать часть рыночного шума для лучшего определения трендовых движений на рынке. Как рассчитать Heiken Ashi?
Heiken Ashi использует формулу COHL, которая означает «Закрытие, Открытие, Максимум, Минимум». Это четыре компонента, кото
FREE
The Omega Trend Indicator is an advanced tool that has been specifically designed to detect market trends early, and follow them efficiently. The indicator draws two lines. The main (thicker) Trend Line represents the presumed lower or upper volatility limits of the current market trend. A break in the main Trend Line indicates a potential reversal or shift in the movement of the trend. The Trend Line also indicates the best point to place a stop loss order. In Omega Trend Indicator, the Trend L
FREE

Original supertrend indicator in Tradingview platform. Indicator type: Price Action indicator Introduction: The Supertrend Indicator - Enhancing Your Trend Analysis. If you haven't yet found a Supertrend indicator with good graphics on the MQL5 platform, this is the indicator for you. Overview: The Supertrend Indicator is a powerful tool designed to provide traders with valuable insights into the current and historical trends of financial markets. It serves as a valuable addition to any t
FREE

El indicador "HLC_bar_MT5 Wyckoff" para MT5 se creó para facilitar el análisis en el momento de la negociación. La barra HLC fue utilizada por Richard Wyckoff y actualmente se usa ampliamente en operaciones "VSA" . Wyckoff descubrió que el uso de High, Low y Close hacía que el gráfico fuera mucho más limpio y fácil de analizar. El indicador " HLC_bar_MT5 Wyckoff " permite: # Cambiar el ancho de la barra; # Deja la barra del mismo color; # Y resalte la barra que abrió y cerró al mismo precio. Los

It is the MQL5 version of zero lag MACD that was available for MT4 here: https://www.mql5.com/en/code/9993 Also there was a colored version of it here but it had some problems: https://www.mql5.com/en/code/8703 I fixed the MT4 version which has 95 lines of code. It took me 5 days to write the MT5 version.(reading the logs and testing multiple times and finding out the difference of MT5 and MT4!) My first MQL5 version of this indicator had 400 lines of code but I optimized my own code again and n
FREE

This is the Volume Avarage Weighted Price (VWAP) it's a indicator that shows where is the avarage of the current volumes and the levels at which the price is considered premium, above the second upper band, or discount, under the second lower band, it's also very usefull to use the VWAP level as a target for operations since it's a very liquid level so the price it's attracted to it. feel free to leave a feedback either positive or negative based on your expereince with this indicator, enjoy the
FREE

El indicador utiliza múltiples marcos de tiempo para analizar las mejores entradas de compra en el auge 1000. Está diseñado para ayudar a operar únicamente en picos de auge. el indicador tiene dos flechas; los rojos y azules. la formación de la flecha roja indica que debe estar preparado para una flecha azul que es una señal de entrada de compra. el indicador no ofrece puntos de salida. siempre recopile 3 pips, es decir, si ingresó a una operación a 10230,200, puede salir a 10260,200 con SL a 1
FREE

HiLo Activator is a technical analysis indicator developed by Robert Krausz, a renowned hungarian trader with a career in the USA.
It is a trend indicator that helps you to predict the cange of the current trend. In an uptrend it is displayed at the bottom of the candles; in a downtrend it is displayed at the top.
Its only setting is the calculation period.
It is possible to have alerts when a new trend begin. Enjoy! This is a free indicator, but it took hours to develop. If you want to pay m
FREE

Hi-Lo es un indicador cuyo propósito es ayudar con mayor precisión a las tendencias de un activo determinado, lo que indica el mejor momento posible para comprar o vender.
¿Qué es Hi-lo?
Hi-Lo es un término derivado del inglés, donde Hi está vinculado a la palabra High y Lo a la palabra Low. Es un indicador de tendencia que se utiliza para evaluar la negociación de activos en el mercado financiero.
Por lo tanto, su uso se da para identificar si un activo en particular está mostrando una t
FREE

T he most Flexible & Reliable Trend-Based Fibonacci indicator by Safe Trading. This indicator helps you calculate Trend-Based Fibonacci levels base on the main and retracement trends to predict future price . If you just looking for a simple Fibonacci Retracement indicator, please use this Free indicator .
### FEATURES ### Auto-calculate up to 7 Trend-Based Fibonacci levels on adjustable frame. Adjust Fibonacci levels as your need. Adjust the start and the end of calculated frame
FREE

Enjoy the Free Candle Color indicator.
Kijun Sen is an element of Ichimoku Kinko Hyo Indicator, it's far too complicated for many traders hence they tend to be confused. We have simplified it so the Kijun Sen will change colors as it activates without the Tenkan Sen, Senkou Span, Up Kumo and Down Kumo. Customize to your period parameter and colors of your choice. Great for beginners and seasoned traders. Set your period and enjoy
GOOD LUCK and ALL THE BEST IN YOUR TRADING JOURNEY !!!!!
FREE

Renko es un gráfico intemporal, es decir, no tiene en cuenta el período de tiempo, sino el cambio de precio, lo que hace que el cambio de precio en el gráfico sea más claro.
Hyper Renko es el indicador que proporciona esto.
Para configurar, solo tiene un parámetro, el tamaño de la vela en la marca * que desea usar.
* tick: es la variación más pequeña posible de un activo.
Gracias por elegir un indicador Hyper Trader.
Wikipedia: Un gráfico de renko indica una variación mínima en el val
FREE

The " YK Find Support And Resistance " indicator is a technical analysis tool used to identify key support and resistance levels on a price chart. Its features and functions are as follows:
1. Displays support and resistance levels using arrow lines and colored bands, with resistance in red and support in green.
2. Can be adjusted to calculate and display results from a specified timeframe using the forced_tf variable. If set to 0, it will use the current timeframe of the chart.
3. Uses
FREE

Best Pivot Point Indicator display pivot points and support and resistance lines for the intraday trading. It calculates them using its own formula based on the previous trading session The indicator can display the following levels in addition to plain pivot points: Previous session's High and Low, today's Open. Sweet spots. Fibonacci levels. Camarilla pivots. Midpoint pivots.
FREE

We value your feedback and believe that your experience with the Hull Moving Average (HMA) is essential to us and other traders. Help us continue to improve and refine our product by sharing your thoughts and insights through a review!
The Hull Moving Average (HMA) Indicator – Your Key to Smoother Trends and Profitable Trades! Are you tired of lagging and choppy moving averages that hinder your ability to spot profitable trading opportunities? Look no further! The Hull Moving Average (HMA) is
FREE

COLORED TREND MA / MACD CANDLES draw MA Candles above/below Moving Average draw MACD Candles above and below 0 and Signal-Line
Your Advantage: a simple view of the trend direction a simple view over the higher trend direction a calmer chart for the eye clear rules can be defined Settings: Value Quick-Set : pre-Settings MACD 3 / 9 / 6 MACD customize MA Candles Fast EMA : 12 Slow EMA : 26 MACD SMA : 9 1. MA Period : default 14 and 20, which are my favorite for all timeframes, I believe in the 1
FREE

Necessary for traders: tools and indicators Waves automatically calculate indicators, channel trend trading Perfect trend-wave automatic calculation channel calculation , MT4 Perfect trend-wave automatic calculation channel calculation , MT5 Local Trading copying Easy And Fast Copy , MT4 Easy And Fast Copy , MT5 Local Trading copying For DEMO Easy And Fast Copy , MT4 DEMO Easy And Fast Copy , MT5 DEMO MACD se denomina media móvil de similitud y diferencia, que se desarrolla a partir de la media
FREE

### Indicador Ultimate Pivot Levels para MetaTrader 5
Ultimate_Pivot_Levels es una herramienta versátil diseñada para mejorar su experiencia de trading al trazar con precisión los niveles de pivote en sus gráficos. Permite ingresar sus valores deseados manualmente o utilizar métodos de cálculo de pivotes bien conocidos para crear niveles de pivote. Dibuja los niveles en el fondo y le permite personalizar los niveles, el tamaño y los colores de las áreas, y mantiene sus ajustes mientras extien
FREE

** NOTE: This indicator uses realtime data. Thus DO NOT download Demo version. If you still need demo version, please refer to free version .
Symbol Chart Changer is an indicator/utility that offers you the option to switch between symbols and timeframes.
You can choose any symbol and timeframe on the same chart with just a few clicks. In addition, this indicator also shows the profit of the symbol through the color of the buttons.
Features: Click buttons on the chart to monitor all your

Smart Drawing Assist PRO MT5. Buttons will appears next to the selected object. The buttons are straightforward and amazingly easy to use. Features are as follow: Draw zigzag . Enabling you to draw patterns, draw zigzag, and draw shapes. All you have to do is click the button and start clicking point to point and it will draw automatically. Change object color . Rectangle/Trendline/HLine/Vline/Text/Price Arrow/Arrowed Line/ and your suggestion please. Flatten trendline . make a perfect flat line

¿Cuántas veces ha buscado un PIVOT que funcione en una vela específica cada día?
A muchos operadores les gusta estimar la dirección de la tendencia del día basándose en un momento específico cada día, como 30 minutos después de la apertura del mercado, o a las 12 del mediodía, etc.
Este indicador le permite especificar una hora determinada (hora y minuto) y traza un pivote desde esa hora hasta el día siguiente a la misma hora. Muestra cinco líneas basadas en esa hora/vela concreta: mediana,
FREE

¡Bienvenido a RSI Colored Candles, un innovador indicador diseñado para mejorar tu experiencia de trading integrando el Índice de Fuerza Relativa (RSI) directamente en tu gráfico de precios! A diferencia de los indicadores RSI tradicionales, RSI Colored Candles utiliza un esquema de cuatro colores para representar los niveles de RSI directamente en tus velas, ¡proporcionándote valiosos insights de un vistazo! Características y Beneficios: Diseño que Ahorra Espacio: ¡Adiós a las ventanas de indic
FREE

This indicator can be considered as a trading system. It offers a different view to see the currency pair: full timeless indicator, can be used for manual trading or for automatized trading with some expert advisor. When the price reaches a threshold a new block is created according to the set mode. The indicator beside the Renko bars, shows also 3 moving averages.
Features renko mode median renko custom median renko 3 moving averages wicks datetime indicator for each block custom notificatio
FREE

El indicador analiza la estructura de precios de los fractales y determina posibles puntos de reversión en la dinámica del mercado. Los fractales se pueden utilizar como niveles de soporte y resistencia.
Ventajas:
Funciona en todos los instrumentos y series temporales, No vuelve a dibujar sus resultados, Colores personalizables de elementos indicadores. Combina perfectamente con cualquier estrategia de tendencia, Ajustando la fuerza de los fractales.
Indicador de versión MT4 -> AQUÍ / AW F
FREE

[ZhiBiDW Trend] es un indicador simple, intuitivo y eficaz de las tendencias y los choques. Es adecuado para períodos de gráficos de más de 15 minutos y menos de 4 horas, adecuados para todas las variedades del mercado.
Señal de compra: aparece una flecha azul hacia arriba; la flecha aparecerá con un precio preestablecido para Stop Loss y Take Profit.
Señal de venta: aparece una flecha roja hacia abajo; la flecha aparecerá con un precio preestablecido para Stop Loss y Take Profit.
Descripc
FREE

El indicador "BIG FIGURE INDICATOR" identifica y dibuja automáticamente líneas horizontales en los gráficos de precios en niveles específicos, como números enteros o medios números (por ejemplo, 1.0000 o 1.5000 en el comercio de divisas). Estos niveles se consideran psicológicamente significativos porque representan números redondos en los que los grandes traders e inversores pueden centrarse, lo que lleva a posibles niveles de soporte o resistencia. El indicador de gran número puede ayudar a l
FREE

Un patrón de gráfico de triángulo simétrico representa un período de contracción y consolidación antes de que el precio se vea obligado a romper al alza o romperse. Una ruptura desde la línea de tendencia inferior marca el inicio de una nueva tendencia bajista, mientras que una ruptura desde la línea de tendencia superior indica el inicio de una nueva tendencia alcista.
Versión MT4 disponible aquí: https://www.mql5.com/en/market/product/68709/
Este indicador identifica estos patrones y le a

Las líneas de resistencia de velocidad son una poderosa herramienta para determinar la tendencia y las líneas de resistencia. El indicador construye líneas utilizando gráficos extremos y fórmulas matemáticas especiales. El indicador se puede utilizar para determinar la dirección de la tendencia y los puntos de inversión.
<---------------------------->
Parámetros del indicador:
"Depth of search" - profundidad (en barras) de búsqueda de gráficos extremos "Back step of search" - distancia mí
FREE

Donchian Channel is an indicator created by Richard Donchian. It is formed by taking the highest high and the lowest low of the last specified period in candles. The area between high and low is the channel for the chosen period.
Its configuration is simple. It is possible to have the average between the upper and lower lines, plus you have alerts when price hits one side. If you have any questions or find any bugs, please contact me. Enjoy!
FREE
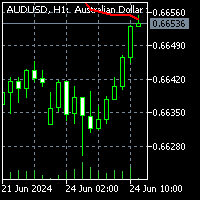
To download MT4 version please click here .
- This is the exact conversion from TradingView: "Chandelier Exit" By "everget". - This is a non-repaint and light processing load indicator - input options related to coloring and labels are removed to fit into MetaTrader graphics. - Buffers are available for processing within EAs. - You can message in private chat for further changes you need.

Este indicador está basado en el famoso indicador fractal pero con mucha personalización y flexibilidad.
Esta es una herramienta poderosa para identificar cambios de tendencias y maximizar su potencial de ganancias.
Con sus funciones avanzadas y su interfaz fácil de usar, es la mejor opción para operadores de todos los niveles. Versión MT4: Ultimate Fractals MT4 Características :
Recuento de velas fractales personalizable. Líneas de inversión. Configuraciones personalizables. Interfaz a
FREE
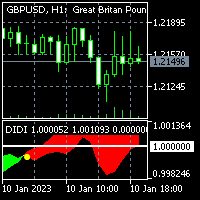
To get access to MT4 version please click here . - This is the exact conversion from TradingView: "Didi Index" by " everget ". - This is a popular version of DIDI index on tradingview. - This is a light-load processing and non-repaint indicator. - Buffer is available for the lines on chart and arrows on chart. - You can message in private chat for further changes you need. Thanks for downloading

6-BAND VWAP (Volume Weighted Average Price)
Fully customized and EA-friendly VWAP Bands Indicator.
Main Features:
Choose the period of VWAP calculation reset (Daily, Weekly or Monthly): For day trading use the Daily VWAP, and for longer term analysis use the Weekly or Monthly calculations. Choose how many bands (deviations) you want to show, up to 6. Choose zero to display only the main VWAP line. Fine adjustment of the deviation of the bands: Find the best band’s deviation for the in

Constructor de Temas Básico: Simplifica la Personalización de Tu Gráfico Transforma tu experiencia de trading con el Constructor de Temas Básico , un indicador versátil diseñado para simplificar la personalización de la apariencia de tu gráfico en MetaTrader 5. Este intuitivo indicador ofrece un panel fácil de usar que te permite cambiar entre varios temas y esquemas de color con facilidad, mejorando tanto el atractivo visual como la funcionalidad de tu entorno de trading. Free MT4 version El C
FREE

The Hybrid Stochastic indicator is a Stochastic RSI described by the famous Tushar Chande and Stanley Kroll in their book called " The New Technical Trader" . The main goal of this indicator is to generate more Overbought and Oversold signals than the traditional Relative Strength indicator (RSI). Combining these 2 indicators expands the range of the overbought and oversold territory. The idea behind it is to use the Stochastic formula over RSI values. If you want to know more about its internal
FREE

This is a simple Candle Stick Pattern Indicator, which shows in the current time period all standardisized Patterns in the chart. All Patterns will be calculatet automatically based on standard conditions. Following Candle Stick Patterns are included: Bullish Hammer | Bearish Hammer Bullish Inverted Hammer | Bearish Inverted Hammer Bullish Engulfing | Bearish Engulfing Piercing | Dark Cloud Cover Bullish 3 Inside | Bearish 3 Inside There are only a few settings at the begining to take. Every Pat
FREE

Elliot Waves Analyzer calculates Elliot Waves to Help Identify Trend direction and Entry Levels. Mainly for Swing Trading Strategies. Usually one would open a Position in trend direction for Wave 3 or a Correction for Wave C . This Indicator draws Target Levels for the current and next wave. Most important Rules for Elliot Wave Analysis are verified by the Indicator. This free version is limited for Analyzing one Timperiod Waves. Waves are Shown only in PERIOD_H4 and above. Not Useful for Intr
FREE

The TRIXs Indicator is the combination of the TRIX (Triple Exponential Moving Average) indicator with the addition of a SMA (Simple Moving Average) signal. It provides signs of trend continuity and the start of a new trend.
The entry and exit points of operations occur when the indicator curves cross.
It performs better when combined with other indicators.
FREE

This SMT (Smart Money Technique) divergence indicator identifies discrepancies in price movement between two different trading symbols, helping traders detect potential market reversals. This tool compares the price action of two correlated assets, such as two currency pairs or indices, to spot divergences where one asset's price moves in the opposite direction of the other. For example, while one symbol may be making higher highs, the other might be making lower highs, signaling a divergence. T
FREE

The indicator displays a renko chart and a supertrend indicator in real time. After installing the indicator, the window will display the Renko chart and the supertrend indicator in the same window. This allows you to more clearly and visually see the entry and exit points when a trend reversal occurs. The signal to open a position is the intersection of the Renko candlestick of the supertrend indicator point and the appearance of the opposite signal of the supertrend indicator.
The indicator
FREE

JCAutoFibonacci 简繁自动绘制斐波那契 1.Zigzag3浪,大中小三浪分别代表市场潮流、趋势、涟漪,以不同参数实现。 使用自定义函数获取三浪高低点,以最近高低点作为绘制价格与时间。 2.Fibonacci,黄金分割线,水平线比例0、0.236、0.318、0.50、0.618、1.0、1.236、1.382、1.50、1.618、2.0等。 斐波那契返驰理论包括:反弹/回调现象、反转现象。合理绘制Fibonacci获取市场有效SR。分别绘制三浪。 3.自定义Fibo颜色,自定义水平线比例(0为不显示),自定义水平线颜色,自定义可选择,自定义右射。 备注:如遇使用问题,请联系邮箱:16692618587@163.com
FREE

Introduction This indicator detects volume spread patterns for buy and sell opportunity. The patterns include demand and supply patterns. You might use each pattern for trading. However, these patterns are best used to detect the demand zone (=accumulation area) and supply zone (=distribution area). Demand pattern indicates generally potential buying opportunity. Supply pattern indicates generally potential selling opportunity. These are the underlying patterns rather than direct price action. T
FREE

ChannelRSI5 El indicador de índice de fuerza relativa (RSI) con niveles dinámicos de zonas de sobrecompra y sobreventa.
Los niveles dinámicos cambian y se ajustan a los cambios actuales en el indicador y los precios, y representan una especie de canal.
Configuración del indicador period_RSI: período promedio para calcular el índice RSI. apply_RSI: el precio aplicado. Puede ser cualquiera de las constantes de precio: PRICE_CLOSE: precio de cierre, PRICE_OPEN: precio de apertura, PRICE_HIGH: p
FREE

Este indicador identifica y resalta las ineficiencias del mercado, conocidas como Fair Value Gaps (FVG), en los gráficos de precios. Utilizando un algoritmo personalizado, el indicador detecta estas áreas de desequilibrio donde el precio se mueve de manera brusca, creando posibles oportunidades de trading. Parámetros del Indicador: Bullish FVG Color (clrBlue) : Color para destacar las ineficiencias alcistas. El valor por defecto es azul. Bearish FVG Color (clrRed) : Color para resaltar las inefi
FREE

When prices breakout resistance levels are combined with momentum oscillator breaks out its historical resistance levels then probability emerges to record farther higher prices. It's strongly encouraged to confirm price breakout with oscillator breakout since they have comparable effects to price breaking support and resistance levels; surely, short trades will have the same perception. Concept is based on find swing levels which based on number of bars by each side to confirm peak or trough
FREE

Idea extracted from the books by Anna Coulling and Gavin Holmes using Volume and Spread Analysis (VSA) techniques coupled with Al Brooks' expertise with Price Action these candles are magical, identify the exact moment
of the performance of the big players are acting in the market represented by the colors:
1) Red Candles we have an Ultra High activity,
2) Candles Orange we have a Very High Activity
3) Candles Yellow we have one High Activity
4) White Candles represent normal activ
FREE

Sessions are very important in trading and often good area where to look for setup. In SMC, ICT we will look for Asian session to serve as liquidity
This indicator displays: High & Low of the Asia session Midnight New York time opening line
Congifuration Line Style, color Label position, size, color Start of the level (Start of the day, Start of the session, Highest or Lowest point in the session)
Any questions or comments, send me a direct message here https://www.mql5.com/en/users/mvonl
FREE

The original author is David Weis, an expert in the Wyckoff Method. The Weis Wave is a modern adaptation of the 1930's Wyckoff Method, another expert in Tape Reading techniques and Chart Analysis. Weis Waves takes market volume and stacks it into waves according to price conditions giving the trader valuable insights about the market conditions. If you want to learn more about this subject you can find tons of videos in YouTube. Just look for "The Wickoff Method", "Weis Wave" and "Volume Spread
FREE

Developed by Chuck LeBeau, the Chandelier Exit indicator uses the highest high / lowest low -/+ a multiple of the ATR value to draw trailing stop lines (orange under buys, magenta over sells) that advance with the trend until the trend changes direction.The value of this trailing stop is that it rapidly moves upward in response to the market action. LeBeau chose the chandelier name because "just as a chandelier hangs down from the ceiling of a room, the chandelier exit hangs down from the high
FREE

Was: $99 Now: $34 Blahtech Daily Range indicator displays the average daily range alongside the individual session ranges. Using the daily open price as a reference the indicator shows fixed range and dynamic range targets as lines on the charts. These lines clearly show when the average range has been exhausted. Daily and session ranges can be useful for confirming entries or setting targets and is an excellent odds enhancer for many trading systems. Links [ Documentation | Install |
¿Sabe usted por qué MetaTrader Market es el mejor lugar para vender estrategias comerciales e indicadores técnicos? Con nosotros, el desarrollador no tiene que perder tiempo y fuerzas en publicidad, protección del programa y ajustes de cuentas con los compradores. Todo eso ya está hecho.
Está perdiendo oportunidades comerciales:
- Aplicaciones de trading gratuitas
- 8 000+ señales para copiar
- Noticias económicas para analizar los mercados financieros
Registro
Entrada
Si no tiene cuenta de usuario, regístrese
Para iniciar sesión y usar el sitio web MQL5.com es necesario permitir el uso de Сookies.
Por favor, active este ajuste en su navegador, de lo contrario, no podrá iniciar sesión.