Indicadores técnicos para MetaTrader 5 - 32

Trend is the direction that prices are moving in, based on where they have been in the past . Trends are made up of peaks and troughs. It is the direction of those peaks and troughs that constitute a market's trend. Whether those peaks and troughs are moving up, down, or sideways indicates the direction of the trend. The indicator PineTrees is sensitive enough (one has to use input parameter nPeriod) to show UP (green line) and DOWN (red line) trend.

Optimistic trader may enter the market when the price crosses the blue line. More reliable entry will be when the price crosses the yellow line. When the price comes back and crosses the red line you can open a position in the course of price movements. If the price is moving between aqua lines - stay out of the market.

When the bands come close together, constricting the moving average, it is called a squeeze. A squeeze signals a period of low volatility and is considered by traders to be a potential sign of future increased volatility and possible trading opportunities. Conversely, the wider apart the bands move, the more likely the chance of a decrease in volatility and the greater the possibility of exiting a trade. This indicator can be used at any time frames and currency pairs. The following input parame

The three basic types of trends are up, down, and sideways. An uptrend is marked by an overall increase in price. Nothing moves straight up for long, so there will always be oscillations, but the overall direction needs to be higher. A downtrend occurs when the price of an asset moves lower over a period of time. This is a separate window indicator without any input parameters. Green Histogram is representing an Up-Trend and Red Histogram is representing a Down-Trend.

Fibonacci Arcs in the full circles are based on the previous day's candle (High - Low). These arcs intersect the base line at the 23.6%, 38.2%, 50%, 61.8%, and 78.6%. Fibonacci arcs represent areas of potential support and resistance. Reference point - the closing price of the previous day. These circles will stay still all day long until the beginning of the new trading day when the indicator will automatically build a new set of the Fibonacci Arcs.

Support and resistance represent key junctures where the forces of supply and demand meet. On an interesting note, resistance levels can often turn into support areas once they have been breached. This indicator is calculating and drawing 5 pairs of "Support and Resistance" lines as "High and Low" from the current and 4 previous days.

The Bull and Bear Power indicators identify whether the buyers or sellers in the market have the power, and as such lead to price breakout in the respective directions. Bulls Power vs. Bears Power is a unique tool that displays on each candle the balance between the bears (sellers) and the bulls (buyers). This particular indicator will be especially very effective when the narrow histogram and the wide histogram reside on the same side (above or under the Zero line)

This indicator is a visual combination of 2 classical indicators: Bears and MACD. Usage of this indicator could be the same as both classical indicators separately or combine. Input parameters: input int BearsPeriod = 9; input ENUM_MA_METHOD maMethod = MODE_SMA; input ENUM_APPLIED_PRICE maPrice = PRICE_CLOSE; input int SignalPeriod = 5.

This indicator is a visual combination of 2 classical indicators: Bulls and MACD. Usage of this indicator could be the same as both classical indicators separately or combined. Input parameters: BearsPeriod = 9; ENUM_MA_METHOD maMethod = MODE_SMA; ENUM_APPLIED_PRICE maPrice = PRICE_CLOSE; SignalPeriod = 5.

Trend indicators tell you which direction the market is moving in , if there is a trend at all because they tend to move between high and low values like a wave
This indicator shows Up Trend (Green Histogram), Down Trend (Red Histogram) and Sideways Trend (Yellow Histogram). Only one input parameter: ActionLevel. This parameter depends of the length of the shown sideways trend.

This is a multiple timeframe version of the classic Parabolic SAR indicator (stands for "stop and reverse"). PSAR follows price being a trend following indicator. Once a downtrend reverses and starts up, PSAR follows prices like a trailing stop. You can choose the timeframes for displaying PSAR on the chart. Of course, you can see PSAR only from the current and higher timeframes. Input parameters: bM15 - PSAR from M15 bM30 - PSAR from M30 bH1 - PSAR from H1 bH4 - PSAR from H4 bD1 - PSAR from D1
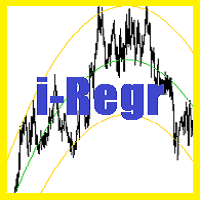
Un canal de regresión es un indicador técnico que consta de dos líneas paralelas equidistantes de la línea de tendencia de regresión. Estas líneas crean un canal dentro del cual el precio de un activo tiende a oscilar. La distancia entre los límites del canal y la línea de regresión central está determinada por la desviación máxima del precio de cierre con respecto a la línea de regresión. Este enfoque permite a los operadores comprender mejor la dinámica actual del mercado y tomar decisiones in
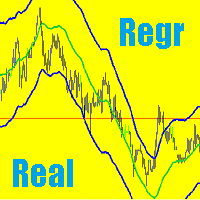
Implementación del canal de regresión en MetaTrader 5 con visualización de residuos en tiempo real El canal de regresión en MetaTrader 5 consta de dos líneas, equidistantes por encima y por debajo de la línea de tendencia de regresión. La distancia entre los límites del canal y la línea de regresión está determinada por la desviación del precio de cierre más alto con respecto a la línea de regresión, que es relevante para los puntos de regresión más recientes.
Problema y solución Normalmente,

El indicador muestra patrones armónicos en el gráfico basado en Dynamic ZigZag ( https://www.mql5.com/en/market/product/5356 ) y es casi un análogo completo de una de las versiones de los conocidos korHarmonics. El indicador reconoce los siguientes patrones y sus variedades: ABCD, Gartley (Butterfly, Crab, Bat), 3Drives, 5-0, Batman, SHS, One2One, Camel, Triangles, WXY, Fibo y Vibrations. Solo la visualización de patrones ABCD y Gartley está habilitada en la configuración de forma predetermi

MA Crossing displays two moving averages on the chart painting their crossing points in different colors - blue (buy) and red (sell). The indicator clearly defines the trend direction and power and simplifies the perception of market signals. The indicator may be useful in the strategies involving two moving averages' crossing method. The indicator's input parameters allow you to select the following settings for each moving average: period (Fast Period, Slow Period); smoothing period (Simple, E

Currency Power Meter muestra el poder de las principales monedas entre sí. El indicador muestra la fuerza relativa de la moneda / par en el momento actual en un período de tiempo (diario, semanal, mensual). Es útil para los comerciantes del día, los comerciantes de swing y comerciantes de la posición con opciones período adecuado.
Monedas poder 'es la verdadera razón de la tendencia del mercado: La moneda más fuerte frente a la moneda más débil combinará en un par más de tendencia. Como sabem

Version for MetaTrader 5. The indicator is based on point and figure chart, but their period is equal to ATR indicator values. Displays in the form of steps. Steps above zero indicate an uptrend. Below zero on a downtrend. Parameters: ATRPeriod - ATR period for calculation of steps. Note: The indicator uses closes price, thus it is recommended to consider completed bars.

Rooster - is a handy tool that allows you to receive alerts from your favorite indicators: Supports up to 3 indicators, built-in and custom; Supports up to 4 different signals at the same time; Able to show pop-up alerts, send e-mail and push notifications. This is version for MetaTrader 5, version for MetaTrader 4 is here . Detailed manual is sent on request. Default settings demonstrate MACD lines crossing signal.
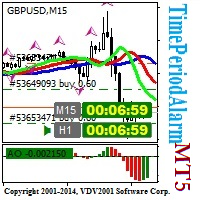
The TimePeriodAlarm indicator shows time till closure of a bar. If the 'Time period' is specified explicitly (i.e. not 'current'), the indicator displays the time till bar closure of the current period and the explicitly specified period. Ten seconds before the closure of the bar (at the period specified explicitly), a preliminary sound alert is played and a color alert is generated, then the main signal (can be set by the user) in the parameter 'Sound file(.wav)' is played. The sound file shoul

El indicador de mapa de calor Este indicador de mapa de calor le permite mostrar un "mapa de calor" de todos los símbolos seleccionados en Market Watch. En esta versión, muestra el & nbsp; porcentaje & nbsp; de cambio de precio en relación con el último cierre diario , lo que puede ofrecer una descripción general rápida del mercado. Esta es una herramienta para ayudar a los operadores a identificar qué tan fuerte es una moneda en relación con todos los demás pares. Esta es una herramienta visual

This indicator shows the ratio of the number of buyers'/sellers' orders for the Russian FORTS futures market. Now, you can receive this information in real time in your МetaТrader 5 terminal. This allows you to develop brand new trading strategies or improve the existing ones. The data on the ratio of the orders number is received from the database (text CSV or binary one at user's discretion). Thus, upon completion of a trading session and disabling the terminal (or PC), the data is saved and u
This indicator shows the ratio of the volume of buyers'/sellers' orders for the Russian FORTS futures market. Now, you can receive this information in real time in your МetaТrader 5 terminal. This allows you to develop brand new trading strategies or improve the existing ones. The data on the ratio of the volumes of orders is received from the database (text CSV or binary one at user's discretion). Thus, upon completion of a trading session and disabling the terminal (or PC), the data is saved a

This indicator is designed for M1 timeframe and shows: sum of ticks when the price goes up divided by sum of ticks when the price goes down (red color); sum of points when the price goes up divided by sum of points when the price goes down (green color). The correlation between the number of ticks and the number of points for each and every minute will give enough data for scalping.

This indicator calculates the next possible bar for each currency pair and timeframe. If the next possible Close will be greater than Open, the next possible bar will be in Aqua color. If the next possible Close will be less than Open, the next possible bar will be in Orange color. Of course, the next possible bar will not show the big price movement. This indicator is most useful in the quiet time.

Many indicators are based on the classical indicator Moving Average . The indicator All_TF_MA shows crossing of 2 MA from each TimeFrames . You will be able to change main input parameters for each MA for every TF. Example for M1 TF: Period1_Fast = 5 Method1_Fast = MODE_EMA Price1_Fast = PRICE_CLOSE Period1_Slow = 21 Method1_Slow = MODE_SMA Price1_Slow = PRICE_TYPICAL

This indicator is based on the classical indicator CCI (Commodity Channel Index) and will be helpful for those who love and know how to use not a visual but digital representation of the indicator. All TimeFrames CCI MT5 indicator shows values from each timeframe. You will be able to change the main input parameters for each CCI for every TF. Example for M1: sTF1_____ = "M1"; Period1 = 13; Price1 = PRICE_CLOSE.

This indicator is based on the classical STOCHASTIC indicator and will be helpful for those who love and know how to use not a visual, but digital representation of the indicator. All TimeFrames Stochastic MT4 indicator shows values from each timeframe (M1, M5, M15, M30, H1, H4, D1, W1 and MN1). You will be able to change the main input parameters for each Stochastic from every TF. Example for M1: sTF1_____ = M1 K_Period1 = 5 D_Period1 = 3 S_Period1 = 3 Method1 = MODE_EMA

This indicator is based on the classical indicator Parabolic SAR and will be helpful for those who love and know how to use not a visual, but digital representation of the indicator. All TimeFrames PSAR MT5 indicator shows values from each timeframe (M1, M5, M15, M30, H1, H4, D1, W1 and MN1). You will be able to change the main input parameters for each Stochastic from every TF. Example for M1: sTF1 = M1 pStep1 = 0.02 pMax1 = 0.2

This indicator is based on the classical indicator RSI (Relative Strangth Index) and will be helpful for those who love and know how to use not a visual but digital representation of the indicator. All TimeFrames RSI MT5 indicator shows values from each timeframe. You will be able to change the main input parameters for each RSI for every TF. Example for M1: sTF1_____ - label (string) of M1 TF. Period1 - number of bars used for the indicator calculations. Price1 - price used. Can be any of the p

The Volume indicator is an excellent tool for measuring tick volume or real volume activity. It quickly and easily helps traders evaluate the volume's current size. The indicator for classification of the volume size uses the moving average and its multiples. Accordingly, the area where the volume is located (relative to the moving average) is labeled as ultra-low, low, average, high, very high, or ultra-high. This indicator can calculate the moving average by four methods: SMA - Simple Moving

The ATR indicator is a helpful tool for measuring the range of bars. It quickly and easily helps evaluate the ATR's current spread (range), which is especially useful for VSA traders. The indicator for classifying the range of bars (candles) uses the moving average and its multiples. Accordingly, the area where the volume is located (relative to the moving average) is labeled as ultra-low, low, average, high, very high, or ultra-high. Our ATR indicator is rendered as a histogram. This indic

Moving Average RAINBOW Forex traders use moving averages for different reasons. Some use them as their primary analytical tool, while others simply use them as a confidence builder to back up their investment decisions. In this section, we'll present a few different types of strategies - incorporating them into your trading style is up to you! A technique used in technical analysis to identify changing trends. It is created by placing a large number of moving averages onto the same chart. When a

HiLo Activator v1.02 by xCalper The HiLo Activator is similar to moving average of previous highs and lows. It is a trend-following indicator used to display market’s direction of movement. The indicator is responsible for entry signals and also helps determine stop-loss levels. The HiLo Activator was first introduced by Robert Krausz in the Feb. 1998 issue of Stocks & Commodities Magazine.

This indicator is based on the classical indicators: RSI (Relative Strangth Index) and CCI (Commodity Channel Index) and will be helpful for those who love and know how to use not a visual but digital representation of the indicators. The indicator shows values from each timeframe. You will be able to change the main input parameters for each RSI and CCI for every TF. Parameters OverboughtLevel_R = 70; OversoldLevel_R = 30; OverboughtLevel_C = 100; OversoldLevel_C = -100; Example for M1: sTF1 =

This indicator is designed for M1 time frame and shows 2 lines: Sum of Points when the price goes up divided on Sum of Ticks when the price goes up (Aqua color). Sum of Points when the price goes down divided on Sum of Ticks when the price goes down (Orange color). You will see all major data as a comment in the left upper corner of the chart. Keep in mind that Sum of Points will be greater or equal to Sum of Ticks. Of course, the ATT is calculating all ticks forward only, beginning from the tim

Purpose and functions of the indicator The indicator determines and marks the moments of trend change on the chart based on the theory of fractal levels breakout on any of the analyzed timeframes. If a breakout based on all rules is valid, a horizontal line with corresponding color will appear on the chart. If there is an uptrend, the line will be blue. In the descending trend, the line will be red. The blue line is a strong support level, the trader should look for buying opportunities above th

Fibolopes (name converted from Envelopes) Indicator is based on the Fibonacci sequence. The input parameter FiboNumPeriod is responsible for the number in the integer sequence (0, 1, 1, 2, 3, 5, 8 13, 34, 55, 89...) Bands will shown on 500 bars starting from the current bar. This indicator is calculating a ZigZag (Aqua line) which in combination with Fibolopes forms a system signals for opening (Z crossing Fibolopes) a new position and closing (Z crossing Fibolopes in opposite direction) an exis

This indicator shows an Up trend (Green square ) if a fast MA is above slow MA and Down trend (Red square) if a fast MA is below a slow MA from all Time Frame for each currency pairs. Input parameters From Symb1 to Symb9 — You may change any of these Symbols to any legal currency pair existed on your platform. Period_Fast=5 — Averaging period for the first MA1. Method_Fast=MODE_EMA — Smoothing type for MA1. Price_Fast=PRICE_CLOSE — The price used for MA1. Period_Slow=21 — Averaging period for th
This indicator shows data from 9 currency pairs by your choice for all 9 Time Frames. If a digital value of the RSI is less or equal to DnLevel = 30 (or whatever number you decided to put) then a Green square will appear. This is potentially an oversold condition and maybe a good time to go Long. If a digital value of the RSI is greater or equal to UpLevel = 70 (or whatever number you decided to put) then a Red square will appear. This is potentially an overbought condition and maybe a good time

This indicator shows an Up trend ( Green square ) if a parabolic SAR value is below the current price, and Down trend ( Red square ) if a parabolic SAR value is above the current price from all Time Frame for each currency pairs. Input parameters from Symb1 to Symb9 — You may change any of these Symbols to any legal currency pair existed on your platform. step=0.0; — Represents the acceleration factor for PSAR indicator. maximum=0.2; — Maximum value for the acceleration factor for PSAR indicator

This indicator shows Commodity Channel Index (CCI) data from 9 currency pairs by your choice for all 9 Time Frames. If a digital value of the CCI is less or equal to DnLevel = -100 (or whatever number you decided to put) then a Green square will appear. This is potentially an oversold condition and maybe a good time to go Long. If a digital value of the CCI is greater or equal to UpLevel = 100 (or whatever number you decided to put) then a Red square will appear. This is potentially an overbough
This indicator shows bands (flexible corridor) for a current price movement and the change of trend. The indicator can be used on any time frames and currency pairs. The following input parameters can be easily changed for your needs: nPeriod = 13; - number of bars which the indicator will use for calculation Deviation = 1.618; - coefficient for bands distance from the middle line MaShift = 0; - shift from current bar

Fibonacci sequence is defined by integer sequence: 0, 1, 1, 2, 3, 5, 8, 13, 21, 34, 55, 89, 144, ... By definition, it starts from 0 and 1, the next number is calculated as a sum of two previous numbers. Instead of the standard moving average, the indicator uses the following calculation of average price: Bar0 + Bar1 + Bar2 + Bar3 + Bar5 + Bar8 + Bar13 + Bar21 + ... This indicator shows 2 moving Fibonacci lines and arrows when 2 these lines crossing each other. If an Aqua line is crossing a Yell
DeMarker (DeM) indicator is another member of the Oscillator family of technical indicators. Traders use the index to determine overbought and oversold conditions, assess risk levels, and time when price exhaustion is imminent. This indicator shows DeMarker data from 9 currency pairs of your choice for all 9 timeframes. If a digital value of DeM is less or equal to DnLevel = 0.3 (or whatever number you decided to put), Green square appears. This is potentially an oversold condition and may be a

This indicator is based on the classical indicators: RSI (Relative Strength Index), CCI (Commodity Channel Index) and Stochastic . It will be helpful for those who love and know how to use the digital representation of the indicators. The indicator shows values from each timeframe (M1, M5, M15, M30, H1, H4, D1, W1 and MN1). You will be able to change the main input parameters for each RSI, CCI and Stochastic for every timeframe.
Parameters OverboughtLevel_R = 70 - RSI UpLevel OversoldLevel_R =
This indicator works on every currency pairs and time frames (TF). One input parameter: nPeriod - number of bars for histogram calculation. I recommend to optimize nPeriod value for each TF. If Green histogram poles are crossing the zero line from below then Long position may be opened. If Red histogram poles are crossing the zero line from above then Long position may be opened.

This indicator is designed for H1 and H4 timeframes (TF) only. No input parameters because it is tuned to these two TF. It draws two step-like lines: a main Silver line and a signal Red line. These two lines are calculated so that to enhance the filtration of the market noise. Buy when the main line goes above the signal line. Sell when the main line goes below the signal line.

Pivot Points MT5 is a universal color multicurrency/multisymbol indicator of the Pivot Points levels systems. You can select one of its three versions: Standard Old, Standard New and Fibo . It plots pivot levels for financial instruments in a separate window . The system will automatically calculate the Pivot Point on the basis of market data for the previous day ( PERIOD_D1 ) and the system of support and resistance levels, three in each. A user can choose colors for the indicator lines. The on

This indicator provides the analysis of tick volume deltas. It calculates tick volumes for buys and sells separately, and their delta on every bar, and displays volumes by price clusters (cells) within a specified bar (usually the latest one). This is a limited substitution of market delta analysis based on real volumes, which are not available on Forex. The indicator displays the following data in its sub-window: light-blue histogram - buy (long) volumes; orange histogram - sell (short) volumes

The multi-timeframe indicator of the levels of the Pivot Points. Every closed daily period has its own so-called reference point - Pivot Point, which sets the levels for smaller intraday timeframes for the following day. The Pivot Points indicators existing in the codes have no method of showing the dynamics of the pivot point changes on the historical data of the price chart. Pivot Point calculation formula. Pivot=(High + Low + Close) /3 High — the maximum of the previous day; Low — the minimum

The indicator MilkyWay is calculating and draws a blue or red ribbon as a trend and as a filter. In case the price is moving inside the ribbon you should not enter the market. In case you see a blue trend and the current price is above the blue ribbon than this is a good time to go Long. In case you see a red trend and the current price is below the red ribbon than this is a good time to go Short. Only 1 input parameter: nBars = 500; - number of Bars where the ribbon will appears.
This indicator and its usage was developed by Brazilian trader and analyst Odir Andrade Aguiar (nickname Didi) from Doji Star.
Usage It is based on the ratio of moving averages with periods 3 (FAST) and 20 (SLOW) by the 8-period moving, which are default settings. When SLOW and FAST are very close and near 1.0-line (white center line), they can indicate a buy or sell signal in next candles. Such signal is know as Agulhada (Needleful). Buy entry happens when FAST line moves UP while SLOW line m

Tired of plotting trendlines? The PZ TrendLines MT5 indicator applies a mechanical approach to the construction of trend lines for you! [ Installation Guide | Update Guide | Troubleshooting | FAQ | All Products ] It can draw up to 18 trendlines Trendlines can be optionally based on fractals Each line represents a breakout level Each trendline can be broken or rejected Configurable amount of lines Configurable colors
Author Arturo López Pérez, private investor and speculator, software engineer

This indicator is based on the classical indicator RSI (Relative Strength Index) and will be helpful for those who love and know how to use not a visual but digital representation of the indicator. All MT5 TimeFrames RSI indicator shows values from each time frames: M1, M2, M3, M4, M5, M6, M10, M12, M15, M20, M30, H1, H2, H3, H4, H6, H8, H12, D1, W1, AND MN1. You will be able to change the main input parameters for each RSI for every TF.
Example for M1 sTF1___ = "M1"; Period1 = 13; Price1 = PR

This indicator displays pivot points in the chart, including historical vales, and supports many calculation modes for Pivot Points and S/R levels. [ Installation Guide | Update Guide | Troubleshooting | FAQ | All Products ] It plots historical levels for backtesting purposes
It allows you to select the reference timeframe It implements different Pivot Point calculation modes It implements different SR calculation modes
It implements customizable colors and sizes
Calculation Modes The indi

This indicator is based on the classical indicator CCI (Commodity Channel Index) and will be helpful for those who love and know how to use not a visual but digital representation of the indicator. All MT5 TimeFrames CCI indicator shows values from each time frames: M1, M2, M3, M4, M5, M6, M10, M12, M15, M20, M30, H1, H2, H3, H4, H6, H8, H12, D1, W1, AND MN1. You will be able to change the main input parameters for each CCI for every TF.
Example for M1 sTF1___ = "M1"; Period1 = 13; Price1 = PR

This indicator is based on the classical indicator Stochastic and will be helpful for those who love and know how to use not a visual but digital representation of the indicator. All MT5 TimeFrames Stochastic indicator shows values from each time frames: M1, M2, M3, M4, M5, M6, M10, M12, M15, M20, M30, H1, H2, H3, H4, H6, H8, H12, D1, W1, AND MN1. You will be able to change the main input parameters for each Indicator for every TF. First line of data is representing a Main calculations of the St

Do you like scalping? Th is indicator displays information about the latest price quotes received from the broker. [ Installation Guide | Update Guide | Troubleshooting | FAQ | All Products ]
Identify tick trends easily A blue row means the price has increased A red row means the price has decreased Customizable colors and font sizes Display your desired amount of rows The indicator is non-repainting
Parameters Rows: amount of rows with data to display in the chart Font size: font size of th

This indicator is based on the classical indicator Parabolic SAR and will be helpful for those who love and know how to use not a visual but digital representation of the indicator. All MT5 TimeFrames PSAR indicator shows values from each time frames: M1, M2, M3, M4, M5, M6, M10, M12, M15, M20, M30, H1, H2, H3, H4, H6, H8, H12, D1, W1, AND MN1. You will be able to change the main input parameters for each CCI for every TF.
Example for M1 sTF1___ = "M1"; pStep1 = 0.02; pMax1 = 0.2;
Input para

This indicator is based on the classical indicator ADX ( Average Directional Index) and will be helpful for those who love and know how to use not a visual but digital representation of the indicator. All MT5 TimeFrames ADX indicator shows values from each time frames: M1, M2, M3, M4, M5, M6, M10, M12, M15, M20, M30, H1, H2, H3, H4, H6, H8, H12, D1, W1, and MN1. You will be able to change the main input parameters for each ADX for every TF.
Example for M1 sTF1___ = "M1"; adxPeriod1 = 14;
Inp
This indicator is based on the classical indicator RSI (Relative Strength Index) and will be helpful for those who love and know how to use not a visual but digital representation of the indicator. All MT5 TimeFrames RSI indicator shows values from each time frames: M1, M2, M3, M4, M5, M6, M10, M12, M15, M20, M30, H1, H2, H3, H4, H6, H8, H12, D1, W1, AND MN1. You will be able to change the main input parameters for each RSI for every TF and you will have a choice what TFs you want to see. Exampl
Many indicators are based on the classical indicator Moving Average . The indicator All_MT5_MA_FX shows the correlation between 2 MA (fast and slow) from each MT5 TimeFrames . You will be able to change main input parameters for each MA for every TF. Example for M1 TF: TF_M1 = true Period1_Fast = 5 Method1_Fast = MODE_EMA Price1_Fast = PRICE_CLOSE Period1_Slow = 21 Method1_Slow = MODE_SMA Price1_Slow = PRICE_TYPICAL
Scanner PriceAction is a convenient indicator for tracking PriceAction patterns by selected symbols on timeframes from M15 to Weekly. You will never omit a profitable trade. You will not have to look through numerous charts trying to find a suitable pattern. Scanner PriceAction will show you a chart and a period where one or another PriceAction set has been formed. All that is left to do is to switch to a specified symbol, size up the situation, and decide whether you want to enter the market. T
This indicator is based on the classical indicator Parabolic SAR and will be helpful for those who love and know how to use not a visual but digital representation of the indicator. All MT5 TimeFrames PSAR indicator shows values from each time frames: M1, M2, M3, M4, M5, M6, M10, M12, M15, M20, M30, H1, H2, H3, H4, H6, H8, H12, D1, W1, AND MN1. You will be able to change the main input parameters for each PSAR for every TF and you will have a choice what TFs you want to see.
Example for M1 TF_

The Correlation Matrix indicator shows the actual correlation between the selected instruments. The default setting is set to 28 currency pairs, gold, and silver, but the indicator can compare any other symbols.
Interpretation of the indicator Positive correlation (correlation is above 80 %). Negative correlation (correlation is below -80 %). Weak or no correlation (correlation is between -80 and 80 %).
Main features The indicator shows the actual correlation between the selected ins
This indicator is based on the classical indicator Average Directional Index (ADX) and will be helpful for those who love and know how to use not a visual but digital representation of the indicator. ADX MT5 indicator shows values from each time frames: M1, M2, M3, M4, M5, M6, M10, M12, M15, M20, M30, H1, H2, H3, H4, H6, H8, H12, D1, W1, AND MN1. You will be able to change the main input parameters for each ADX for every TF and you will have a choice what TF you want to see.
Example for M1 TF_
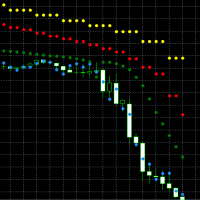
This indicator is based on the classical indicator Parabolic SAR. You can observe up to 4 different timeframes. All MT5 TimeFrames are supported. It's possible to use lower or higher timeframes than the current chart timeframe. Input Parameters: For each of the 4 Timeframes you can configure: The specific Period ( ENUM_TIMEFRAMES ) The usage of the PSAR Value ("visible and relevant for the signal", "visible and not relevant for the signal" or "invisible and not relevant for the signal (ign

The indicator generates early signals basing on ADX reading data combined with elements of price patterns. Works on all symbols and timeframes. The indicator does not redraw its signals. You see the same things on history and in real time. For better visual perception signals are displayed as arrows (in order not to overload the chart).
Features The best results are obtained when the indicator works on two timeframes. For example: M30 – the indicator shows the main trend; M5 – the indicator ge

This indicator is based on the classical oscilator Stochastic and will be helpful for those who love and know how to use not a visual but digital representation of the indicator. Stochastic MT5 indicator shows values from each time frames: M1, M2, M3, M4, M5, M6, M10, M12, M15, M20, M30, H1, H2, H3, H4, H6, H8, H12, D1, W1, AND MN1. You will be able to change the main input parameters for each Stochastic for every TF and you will have a choice what TFs you want to see. The indicator shows the di

The indicator colors bullish, bearish and doji candles. Also, the amount of candles (bullish, bearish and doji) for the last N days is calculated. You can select colors for both bodies and shadows of candles, as well as enable coloring of only candle bodies МetaТrader 4 version: https://www.mql5.com/en/market/product/11624 Parameters color bulls = color of bullish candle bodies color shadow bulls = color of bullish candle shadows color bears = color of bearish candle bodies color shadow bears =
MetaTrader Market es el mejor lugar para vender los robots comerciales e indicadores técnicos.
Sólo necesita escribir un programa demandado para la plataforma MetaTrader, presentarlo de forma bonita y poner una buena descripción. Le ayudaremos publicar su producto en el Servicio Market donde millones de usuarios de MetaTrader podrán comprarlo. Así que, encárguese sólo de sus asuntos profesionales- escribir los programas para el trading automático.
Está perdiendo oportunidades comerciales:
- Aplicaciones de trading gratuitas
- 8 000+ señales para copiar
- Noticias económicas para analizar los mercados financieros
Registro
Entrada
Si no tiene cuenta de usuario, regístrese
Para iniciar sesión y usar el sitio web MQL5.com es necesario permitir el uso de Сookies.
Por favor, active este ajuste en su navegador, de lo contrario, no podrá iniciar sesión.