Indicadores técnicos para MetaTrader 5 - 22

Il s'agit d'un indicateur personnalisé basé sur l'évolution des prix en chandeliers. Il génère des alertes pour les signaux d'achat ou de vente sur n'importe quel instrument de trading. Il existe du matériel explicatif disponible pour les techniques de validation des signaux, d’entrée et de sortie. Pour en savoir plus, recherchez Benjc Trade Advisor sur YouTube pour des vidéos explicatives.
La dernière version comprend des filtres de tendance et d'oscillateur pour améliorer la précision du si

To get access to MT4 version please click here . This is the exact conversion from TradingView: "Candle body size" by "Syamay". This is a light-load processing indicator. This is a non-repaint indicator. Buffers are available for processing in EAs. All input fields are available. You can message in private chat for further changes you need. Thanks for downloading
FREE

Estilo visual de bandas VWAP 1.0 Los indicadores del mercado financiero son herramientas esenciales utilizadas por los comerciantes e inversores para analizar y tomar decisiones en los mercados financieros. VWAP y las Bandas de Bollinger son dos herramientas populares de análisis técnico utilizadas por los comerciantes para medir las tendencias del mercado y la volatilidad de los precios. En este producto, proponemos combinar los dos indicadores para crear un producto único que proporcione un a

The Rubdfx swing indicator is a useful tool for traders looking to identify trend changes in a particular instrument they are trading. It is designed to draw a line on the main chart, and the signals are indicated by color changes with signal alerts. The color green is used to indicate a bullish trend, while the color pink is used to indicate a bearish trend. These colors can be customized to fit the trader's preferences or theme. The Rubdfx swing indicator has the ability to spot both long-te
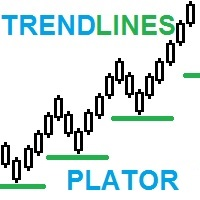
TrendPlator: Un Potente Indicador de Proyección de Tendencias para Estrategias de Trading Optimizadas ¡Descubre el poder de nuestro nuevo indicador! Con la capacidad de calcular líneas de tendencia de marcos temporales más amplios y proyectarlas directamente en tu marco temporal actual, proporciona un soporte estratégico que llama la atención de todos los traders. Estos puntos se convierten en poderosos niveles de soporte o resistencia para tus operaciones, impulsando tu estrategia de trading. I

The DR IDR Range Indicator PRO plots ADR, ODR and RDR ranges for a given amount of days in the past. A key feature that appears is that it calculates the success rate of the ranges for the shown days. This indicator is perfect for backtest since it shows ranges for all of the calculated days, not just the most recent sessions. In the PRO version you can now: use fully customizable advanced statistics to base your trades on get an edge via calculating statistics on up to 3 different day period

Este indicador de múltiples marcos de tiempo y múltiples símbolos alerta sobre los cambios de color de Heiken Ashi Smoothed. Como beneficio adicional, también puede buscar cambios de color (tendencia) en la media móvil del casco. Combinado con sus propias reglas y técnicas, este indicador le permitirá crear (o mejorar) su propio sistema poderoso. Características
Puede monitorear todos los símbolos visibles en su ventana Market Watch al mismo tiempo. Aplique el indicador a un solo gráfico y mon

Este indicador de marco de tiempo múltiple y símbolo múltiple identifica cuándo la línea de señal estocástica cruza la línea principal estocástica. Como alternativa, también puede alertar cuando el estocástico está saliendo (sin que la línea de señal cruce la línea principal) de un área de sobrecompra/sobreventa. Como beneficio adicional, también puede buscar bandas de Bollinger y cruces de sobrecompra/sobreventa RSI. Combinado con sus propias reglas y técnicas, este indicador le permitirá crear

Due to Technical and Logical manipulations by Brokerage, I have come a long way to bring this rear indicator that combines numerous strategies that have the following abilities: Market Trend Identification : Understand the overall trend of the market. Reversal Points : Identify potential points where the market may change direction. Entry and Exit Points : Determine optimal times to enter and exit trades. For a comprehensive understanding of how to use this indicator, please watch the accompanyi

¡Únase a operar con el indicador WolfeWaveBuilder! Esta es una herramienta única creada específicamente para obtener las decisiones de inversión más exitosas y rentables. Es ideal para cuentas reales y se beneficia de una estrategia comercial completamente probada y virtualmente garantizada. ¡No pierdas tu oportunidad! ¡Comience a ganar dinero operando con el indicador WolfeWaveBuilder!
Versión MT5 https://www.mql5.com/ru/market/product/8920
Características del indicador
Da señales

Indicador usado para sabermos os pontos de suporte de resistência no gráfico.
Funciona em todos ativos e timeframes.
Acerte exatamente os pontos de entradas e saídas das suas operações. SEE OUR RESULTS ON INSTAGRAM: https://www.instagram.com/diogo.cansi/ TELEGRAM GROUP = https://t.me/robosdsc More information by email dscinvestimentos@gmail.com or by Whatsapp 55-991372299
FREE

The Engulf Seeker indicator is a powerful tool designed to detect engulfing candlestick patterns with precision and reliability. Built on advanced logic and customizable parameters, it offers traders valuable insights into market trends and potential reversal points.
Key Features and Benefits: Utilizes revised logic to analyze previous candles and identify strong bullish and bearish engulfing patterns. Convenient arrow-based alert system notifies traders of pattern occurrences on specific symb

Además de encontrar formaciones de huelga de tres líneas alcistas y bajistas, este indicador de múltiples símbolos y marcos de tiempo mutli también puede buscar los siguientes patrones de velas (consulte las capturas de pantalla para obtener una explicación de los patrones): Tres soldados blancos (inversión> patrón de continuación) Tres cuervos negros (inversión> patrón de continuación) Las formaciones no aparecen con mucha frecuencia en períodos de tiempo más altos cuando la opción estricta en

The Magic EMA indicator is of great help in determining trend direction. It can be an excellent addition to your existing strategy or the basis of a new one. We humans can make better decisions when we see better visually. So we designed it to show a different color for rising and falling trends. Everyone can customize this in the way that suits them best. By setting the Trend Period, we can optimize it for longer or shorter trends for our strategy. It is great for all time frames.
IF YOU NEE
FREE

The " Pure View " indicator is designed to quickly display and hide indicators on the chart. Description
1. Currently Pure View works with Stochastic, MACD, RSI indicators 2. Displaying and hiding indicators occurs using hot keys 3. The key combination Shift + C will display or hide the "Stochastic" indicator on the chart 4. The key combination Shift + V will display or hide the "RSI" indicator on the chart 5. The key combination Shift + B will display or hide the "MACD" indicator on the chart
FREE

Este poderoso indicador analisa o gráfico e mostra zonas de Rejeição de Preços! Isto é, locais onde o preço foi, mas não foi aceito pelo mercado! A visualização desta zona de Rejeição, facilita o entendimento do trader na tomada de decisões de onde operar e como operar!
O indicador é composto por 4 linhas, sendo classificadas em 2 grupos: Linhas Vermelha e Amarela: Denotam os extremos onde o preço conseguiu chegar, mas não foi aceito! Linhas Laranja e Azul: A partir delas, denotam o Início da
FREE
Presentamos el Indicador iTrend: una herramienta de vanguardia diseñada para proporcionar información clara y confiable del mercado para traders de todos los niveles. Este indicador analiza eficientemente cada vela de forma individual, detectando el impulso alcista o bajista con una precisión sin igual, asegurando que te mantengas por delante de los movimientos del mercado sin ningún tipo de redibujado. Características clave: Señales precisas SIN REDIBUJADO: Una vez que se genera una señal, perm

El indicador de superposición de gráficos muestra la acción del precio de varios instrumentos en el mismo gráfico, lo que le permite evaluar qué tan diferentes fluctúan los pares de divisas entre sí. [ Guía de instalación | Guía de actualización | Solución de problemas | FAQ | Todos los productos ]
Encuentre pares de divisas sobrecomprados o sobrevendidos fácilmente Trace hasta seis pares de divisas superpuestos en el mismo gráfico Mostrar símbolos invertidos si es necesario Adaptarse al ta

Kill zones ICT es un potente indicador que le permitirá ver los mercados desde una mejor perspectiva. La herramienta de este indicador es mostrar en el gráfico uno de los factores más importantes del trading que es el tiempo. Con su sencilla interfaz podrá ver fácilmente cuáles son las horas con mayor volatilidad y movimiento así como las sesiones con menor actividad. ¿Cómo puedo utilizar este indicador para operar con conceptos TIC/Liquidez?
¿Qué se puede hacer con Kill Zones ICT?
Comp

Moving Average Scanner es un escáner de múltiples períodos de tiempo perfecto para ver la tendencia en varios períodos de tiempo de un vistazo sin cambiar el gráfico. Puede utilizar hasta 4 medias móviles de su elección en 9 unidades de tiempo. Es totalmente configurable y se puede mover a cualquier parte del gráfico simplemente "arrastrar y soltar". Las medias móviles se pueden configurar en 4 métodos de cálculo diferentes. También puede configurar alertas basadas en la cantidad de promedios mó

Shows min and max of last M5 Candle. Can be used to trade breakouts of last M5 candle. The M5 Candle Breakout Strategy avoids to stay too long in a sindways phase. See documentation on @swisstrader3713, where you can follow my live trading. The only parameters are the color of the lines defining the M5 stretch. Best use the indicator in M1 timeframe. The M5 Breakout Strategy has helped me to reduce overtrading.
FREE

Midpoint Bands is a channel-like indicator that draws two lines on the chart - an upper band and a lower band, pointing out possible reversal levels.
This is one of the indicators used in the Sapphire Strat Maker - EA Builder.
Sapphire Strat Maker - EA Builder: https://www.mql5.com/en/market/product/113907
The bands are simply calculated like this:
Upper Band = (HighestHigh[N-Periods] + LowestHigh[N-Periods])/2 Lower Band = (LowestLow[N-Periods] + HighestLow[N-Periods])/2
FREE

El indicador incluye dos partes. Parte I: Las velas de colores muestran la tendencia principal Las velas de colores sirven para identificar el estado del mercado mediante las velas de colores. Como se muestra en las capturas de pantalla, si el color es Aqua, el mercado se encuentra en un estado en el que se deben realizar órdenes largas o salir de órdenes cortas. Si el color es Tomate, es el momento de realizar pedidos cortos o salir de pedidos largos. Si el color cambia, es mejor esperar a que

Ultimate Trend Finder (Multi Pair And Multi Time Frame) : ---LIMITED TIME OFFER: NEXT 25 CLIENTS ONLY ---46% OFF REGULAR PRICE AND 2 FREE BONUSES ---SEE BELOW FOR FULL DETAILS Institutional traders use moving averages more than any other indicator. As moving averages offer a quick
and clear indication of the institutional order flow. And serve as a critical component in the decision making
within numerous institutional trading rooms.
Viewing the market through the same lens as the i

Este indicador nos permite identificar condiciones inusuales de volatilidad.
Si la línea ATR está por debajo de la línea Bollinger media, se supone que la volatilidad está por debajo de la media.
Si la línea ATR está por encima de la línea Bollinger media, se supone que la volatilidad está por encima de la media.
Si la línea ATR rompe la banda superior de Bollinger, se supone que la volatilidad es alta.
Si la línea ATR rompe la banda inferior de Bollinger, se supone que la volati
FREE

Ultimate Engulfing Bar Scanner (Multi Pair And Multi Time Frame) : ---LIMITED TIME OFFER: NEXT 25 CLIENTS ONLY ---46% OFF REGULAR PRICE AND 2 FREE BONUSES ---SEE BELOW FOR FULL DETAILS Nothing is more important than institutional price action and order flow.
And a strong engulfing candle is a clear indication that the institutions have flipped their sentiment.
Engulfing bar patterns are widely used by institutional traders around the world. As they allow you to manage
your trades withi

The Average Cross System indicator is a versatile tool designed for traders using the MetaTrader 4 (MT4) platform. This indicator provides a straightforward yet effective way to identify potential buy and sell signals based on moving average crossovers, a widely used technical analysis strategy. Key Features: Moving Average Crossovers: The heart of the Average Cross System is the detection of moving average crossovers. It automatically identifies when a shorter-term moving average crosses above
FREE

MACD indicators https://mql5.com This MACD indicator looks slightly different from the MACD indicator found in many other charting software. When the value of the signal line parameter is greater than the value of the MACD parameter, the indicator will give a buy prompt, and when the signal line parameter is less than the value of the MACD parameter, the indicator will give a sell prompt.
FREE

An easy indicator that simply shows the moment we connect to the market. We can easily see what has happened while we were gone because the line has two different colors that show the start time. It is only that, a visualization aid that allow us to mark the market behavior while it was night time in our country, or if we have stopped several hours. Input: Server start working date: Day of month Month Year Hour Minutes
FREE

This indicator is a zero-lag indicator and displays exact trend as is. True Trend Moving Average Pro works best in combination with True Trend Oscillator Pro that displays strength of trend change.
True Trend Oscillator Pro: https://www.mql5.com/en/market/product/103589
If you set PERIOD input parameter to 1 this indicator becomes a sharpshooter for binary options.
Default input parameters: TT_Period = 10; TT_Meth = MODE_SMA; TT_Price = PRICE_MEDIAN;
Before you buy this product, please
FREE

Correction Breakthrough es una poderosa herramienta para detectar posibles puntos de ruptura desde un corredor correctivo o comercial, basado en el análisis de formaciones de precios e inercia de movimientos de precios.
_________________________________
Cómo utilizar las señales indicadoras:
El indicador forma una señal durante la barra de precios actual. Se recomienda utilizar la señal formada después de cerrar la barra de señal por encima/por debajo de la flecha de señal. El indicador
FREE

Se você está procurando uma maneira de melhorar seus resultados de negociação, então o indicador VWAPiEagleVision é o que você precisa! Este robô é programado para rastrear o VWAP em tempo real e usar essas informações para identificar tendências e oportunidades de negociação lucrativas.
O VWAP (Volume Weighted Average Price) é um indicador amplamente utilizado pelos traders para determinar o preço médio ponderado pelo volume negociado. Ele é comumente usado por traders institucionais e pode
FREE

Spire - показывает трендовый, сигнальный, свечной прорыв в сторону верхней или нижней границы канала, а так же временную или долгую консолидацию в виде прямоугольного канала. Сигналы тренда не перерисовываются. В основу идеи индикатора входит Bollinger Bands.
Изменяемые параметры Signal trend -изменение цветовой гаммы сигнального символа тренда Lower limit - изменение цветовой гаммы нижней границы канала Upper limit - изменение цветовой гаммы верхней границы канала Internal field -изменение
FREE

ContiStat restricted - Free DEMO version of the ContiStat indicator
Free version of the indicator is ment as DEMO of full paid version. Full functionality is available, however The indicator work only on M30 chart period . Find the ContiStat indicator for full functionality
Brief description The ContiStat indicator calculate statistic frequency of green (up) and red (down) movement in the chart and determine movement dynamics (silver curve). There are two key parameters to understand the Conti
FREE

El indicador técnico propuesto es un sistema de medias móviles de múltiples marcos temporales diseñado para ayudar a los operadores del mercado financiero a seguir de cerca los movimientos tendenciales. Al combinar medias móviles de diferentes períodos, este indicador ofrece una visión más completa de la dirección de la tendencia, lo que permite a los traders identificar oportunidades de trading con mayor precisión. Al utilizar este indicador, los operadores pueden maximizar sus ganancias al tom
FREE

Highly configurable Awesome Oscillator (AO) indicator. Features: Highly customizable alert functions (at levels, crosses, direction changes via email, push, sound, popup) Multi timeframe ability Color customization (at levels, crosses, direction changes) Linear interpolation and histogram mode options Works on strategy tester in multi timeframe mode (at weekend without ticks also) Adjustable Levels Parameters:
AO Timeframe: You can set the current or a higher timeframes for AO. AO Bar Shift:
FREE

Advanced Trend Builder is a trend indicator using the original calculation algorithm. ATB can be used on any data and timeframe. My recommendation use for calculation numbers 4 - 16 - 64 - 256 and so on ..., but this is only recommendation. The middle of the trend wave is a special place where market behavior is different, when developed ATB was main idea to find the middle of the wave trend. Input parameters: Bars will be used for calculation - number of bars used for a trend line calculation.
FREE
Aydmaxx Trade Tracker Description: Aydmaxx Trade Tracker is a powerful and user-friendly tool for traders, allowing you to monitor the current profit or loss for each trade in real-time. The indicator displays the information directly on the screen, helping traders quickly assess the results of their trading operations. Key Features: Displays the current profit or loss for all open positions in real-time. Customizable corner of the screen for displaying information (default is the bottom right c
FREE

O Afastamento da Média Móvel, é uma poderosa ferramenta de análise técnica projetada para fornecer uma representação visual do afastamento entre o preço atual e uma média móvel específica. Este indicador, desenvolvido para o MetaTrader, oferece aos traders uma perspectiva clara das mudanças na dinâmica de preço em relação à tendência de médio prazo.
Versão MT4: https://www.mql5.com/pt/market/product/111705
FREE

SSACD - Singular Spectrum Average Convergence/Divergence This is an analogue of the MACD indicator based on the Caterpillar-SSA ( Singular Spectrum Analysis ) method. Limited version of the SSACD Forecast indicator. Limitations include the set of parameters and their range.
Specificity of the method The Caterpillar-SSA is an effective method to handle non-stationary time series with unknown internal structure. The method allows to find the previously unknown periodicities of the series and mak
FREE

Having trouble marking where the various forex sessions start and end? Or perhaps your strategy requires you trade only in a specific session, then this is for you.
The session indicator shades the session you require in a certain color so that you can identify it easily. The sessions shown include: London session, New York session, Asian Session, Asian - London overlap and London - New York Overlap.
Difference source give varying time ranges for the various session, mostly differing by not
FREE

FractalEfficiencyIndicator A ratio between 0 and 1 with the higher values representing a more efficient or trending market, It is used in the calculation of Perry J. Kaufman Adaptive Moving Average (KAMA), dividing the price change over a period by the absolute sum of the price movements that occurred to achieve that change. The Fractal Efficiency or also known as Efficiency Ratio was first published by Perry J. Kaufman in his book ‘Smarter Trading‘. This is mostly considered a filter for v
FREE
Schaff trend RSI indicator (It is related with EMA and RSI) It is suited for sub-Indicator to undertand trend(or direction change)
As you can see the screenshot, it's good with Nagaraya-Watson Envelope Indicator (or others) I am using this indicator as Screenshot setting. (Schaff value is default value. 23, 50, 9, close) If you want to get Nagaraya-Watson Envelope, Link: https://www.mql5.com/ko/market/product/97965

Many traders use Price Action as entry and exit signal. Since the beginning of chart analysis, traders have found several candlestick patterns that can indicate possible "behaviors" of the market. Candlestick Pattern indicator is an indicator for MetaTrader platform that can detect many of these patterns and show them on screen or to alert traders about them. though they detect slightly different sets of candle patterns. Candlestick Pattern indicator also has a more modern look compared
FREE

Este indicador / oscilador múltiple (en adelante indicador), marco de tiempo múltiple e indicador de símbolo múltiple identifica cuando ocurre una divergencia entre el precio y uno, dos o tres indicadores. Identifica divergencias tanto regulares / clásicas (inversión de tendencia) como ocultas (continuación de tendencia). Tiene opciones de filtro de tendencias RSI y MA que permiten filtrar solo las configuraciones más fuertes. Combinado con sus propias reglas y técnicas, este indicador le permit

This indicator identifies short-term, medium-term and long-term highs and lows of the market according to the method described by Larry Williams in the book "Long-term secrets to short-term trading".
Brief description of the principle of identifying the market highs and lows A short-term high is a high of a bar with lower highs on either side of it, and, conversely, a short-term low of a bar is a low with higher lows on either side of it. Medium-term highs and lows are determined similarly: a
FREE

This tick indicator draws synthetic bars/candlesticks that contain a definite number of ticks. Parameters: option prices - price option. It can be Bid, Ask or (Ask+Bid)/2. the number of ticks to identify Bar - number of ticks that form OHLC. price levels count - number of displayed price levels (no levels are displayed if set to 0 or a lower value). calculated bar - number of bars on the chart. Buffer indexes: 0 - OPEN, 1 - HIGH, 2 - LOW, 3 - CLOSE.
FREE

Indicador-pronosticador. Es bastante cómodo como un ayudante, actúa como punto de referencia en cuanto al carácter futuro del movimiento del precio. El pronóstico se realiza usando el método de la búsqueda de una parte más similar (en adelante, patrón) en el historial. El indicador se dibuja en forma de una línea que muestra el resultado del cambio de los precios del cierre de las barras. En los ajustes del indicador se puede ajustar la profundidad del historial, número de barras que se someten
FREE

ToolBot Advisor Indicator (RSI, ATR, ADX, OBV) FREE An effective indicator for your negotiations
The toolbot indicator and advisor brings leading (OBV) and lagging (RSI, ATR, ADX) indicators so that you have more security in your negotiations. In addition, it informs you of possible up and down trends as well as providing you with incredible advisors who will give you information about trading opportunities.
With this indicator you will have more security and speed in your decision making
FREE

The ShowSessions indicator for MT5 shows up to two, self-selected, time intervals, for a free choosen number of days past and a few future days. Weekends are marked with an additional red vertical line. The indicator makes manuel backtesting of strategies more easily, but you can use ist for daily trading as well. Please note that the server time does not always correspond to the actual time.
FREE

Media Band é um indicador que projeta 8 bandas paralelas a uma media movel de referencia. Podendo auxiliar na visualização da volatilidade do mercado financeiro. Este indicador foi inspirado na necessidade de avaliar melhor uma boa oportunidade de compra e venda dos ativos de acordo com o "seu" operacional. Não pode ser utilizado como recomendação e sim a fins de estudos do Mercado Financeiro.
FREE

Simple indicator to calculate fibonacci retracement levels on time. Add to chart and move trend line to set the fibonacci retracement levels. Inputs Levels - levels for which to calculate values, separated by space, default are fibonacci levels Show time - if true, time will be shown on levels Show date - if true, date will be shown on levels Show fibonacci level - if true, value of levels will be shown Fibonacci lines color - color of levels Trend line color - color of trend line which de
FREE

Switch Tray is a shortcut tray tool for commonly used trading pairs provided to traders. It can be placed at the bottom of the chart, and commonly used trading pairs can be set by themselves. 1. You can set the shortcut switch button for your commonly used trading pairs. The default is [EURUSD/GBPUSD/XAUUSD/USDJPY/USDCHF/USDCNH]. / slash is the separator. 2. The button of each trading pair is also equipped with the number of open positions of a certain trading pair. 3. Multi-cycle quick switchi
FREE

Highly configurable Relative Vigor Index (RVI) indicator.
Features: Highly customizable alert functions (at levels, crosses, direction changes via email, push, sound, popup) Multi timeframe ability ( higher and lower timeframes also) Color customization (at levels, crosses, direction changes) Linear interpolation and histogram mode options Works on strategy tester in multi timeframe mode (at weekend without ticks also) Adjustable Levels Parameters:
RVI Timeframe: You can set the lower/highe
FREE

An indicator for visualizing time ranges of key trading sessions: Asian, European, and American. The indicator features functionality for setting the start and end times of each trading session, as well as an adjustable timezone of the trading server. The main advantages of the indicator include the ability to operate with minimal CPU load and memory usage. Moreover, it offers the option to specify the number of displayed historical days, providing the user with flexible market dynamics analysis
FREE

Expert Market Edge is scalping, trending, reversal indicator, with alerts . You can use it all and fit with your strategy whatever it fits you. My recommendation is to combine with my Colored RSI , and when 2 signals are matched, and pointing same direction (for example buy on this indicator, and green on RSI, you can take a long position, stop loss should be last local low, if you want to be more conservative, add ATR. ) you can take position. If you using moving averages, that's even better i

The indicator shows the price or volume in milliseconds, great for identifying entry patterns by price or volume aggression, and fast scalping. Features Timeframe in milliseconds Price aggression oscillator Customizable screen The indicator can indicate entry movements, such as: Crossing with a high slope before the first 500 ticks of the chart Identifying wave patterns
The speed of the chart display will depend on your hardware, the lower the milliseconds the more it will require from the har
FREE

Indicator for fast navigation through financial instruments. When you click on the button, you go to the chart of the financial instrument, the name of which was written on the button. In other words, the indicator opens or unfolds an existing chart window. For each chart, you can customize the name of the financial instrument, text color and background color; in total, you can customize symbols buttons that you trade often. The indicator can be installed on any charts for which you need to swit
FREE

QuantumAlert RSI Navigator is a free indicator available for MT4/MT5 platforms, its work is to provide "alerts" when the market is inside "overbought and oversold" regions in the form of "buy or sell" signals. This indicator comes with many customization options mentioned in the parameter section below, user can customise these parameters as needful. Join our MQL5 group , where we share important news and updates. You are also welcome to join our private channel as well, contact me for the priva
FREE

TickChart Indicator plots tick line on the main window of MetaTrader.
In the Lite version, the number of ticks is limited to 20 and the alert function described below is omitted. The tick-line shows the most detailed, fastest and real-time activities of the market, which are usually hidden in bars or candles longer than 1 minute. Usually, several new tick-line segments appear while a bar of M1 time frame is completed. After the release of an important economic indicator, the number of ticks pe
FREE

This indicator solves the problem of chart scaling where the bar becomes too thin and it becomes difficult to determine the bar's open and close prices.
Thick Bar indicator - allows you to change the thickness of the lines and the color of the stroke, due to which you can get a thicker bar on the chart. The default indicator has a bar thickness of 2 and preset colors that can be changed in the settings
FREE

Swiss CandleTime What ist CandleTime for This indicaor just displays the remaining time for a candle to build. It is best used if you trade with timframes from 3 minutes. I use it in M3 to keep postions. If I have two following red candles i usually liquidate the position. Timeframes M1 to H1 Inputs Arrow displayed => Edit your arrow string Arrow for waiting conditions => Arrow if chart is offline Text Color => color of the text Tell if there is a trend change => tells you, if the two preciding
FREE

This spread indicator displays the actual spread of each candle. It highlights the maximum spread and the minimum spread of the chosen symbol. This indicator is very helpful to see in real time the spread evolution helping to avoid taking a trade when the spread is too high.
Inputs:
Print value in Points: if true displays the spread as a whole number
D isplay minimum and maximum spread of the past N days: select the number of days to consider the maximum and minimum spread
Automatically
FREE

LLega a ustedes el indicador que va a revolucionar el comercio con índices sintéticos CRASH en la plataforma de trading Deriv mt5.
God Spike Crash.
Características principales: Sirve solo en índices CRASH. Posee filtro de tendencia. Envía alertas solo cuando el mercado se encuentra la baja. Alertas sonoras. Puede enviar alertas al móvil.
Modo de uso: Aplicar en temporalidades de m1 y m5. Esperar la alerta sonora. Analizar que haya una fuerte tendencia o que ya haya empezado. No tomar al

The indicator highlights in color the places on the chart where the price moves in one direction continuously from the selected number of candles.
You can specify the number of points from the beginning of the movement to select only movements from this amount.
It can be useful for looking for reversals or sharp impulses.
I also recommend purchasing this utility to determine local weekly / monthly trends and support and resistance lines. https://www.mql5.com/en/market/product/61401
FREE

The indicator draws actual Fibonacci levels for your trading activity.
The levels are redrawn every time after the price touches the low (0%) or the 100% fibonacci level.
In the parameters, select the trading activity: Long term investor Medium term investor Medium-term investor active Short term investor Short-term investor active Speculator Speculator active Scalper Scalper active Try this indicator in action, and you will no longer have to look for coordinates for drawing fibonacci level
FREE

Análisis de trading preciso al alcance de tu mano: software de análisis de trading de nueva generación El software de análisis de trading convencional disponible en el mercado a menudo solo proporciona estadísticas de la relación entre ganancias y pérdidas por hora o por semana, lo que no satisface la necesidad de un análisis de trading más preciso. Sin embargo, en el mercado de trading real, cada día presenta circunstancias únicas. Los lunes son tranquilos, los miércoles son activos con un tri
FREE

パラボリックのデータをもとにトレンドの方向性を1分足から月足まで表示します。 1分足から 月足 まで表示されているので今どの方向に価格が動いているのかがすぐに分かります。
更新はティク毎ではなくディフォルトでは1秒毎、もちろん変更も可能なのでチャートの表示が遅くなるようなことはありません。
機能:
どの通貨でも表示可能になります。
アイコンの色を指定することが可能になります。
表示位置(X軸、Y軸)が変更可能 になります。
表示位置 (左上 、 右上 、 左下 、 右下) が 指定 が可能 になります。
フォント を指定することが可能になります。
フォントサイズ が 変更可能 になります。
アイコンのサイズ が 変更可能 になります。
週足、 月足 の非表示 が 可能 になります。
FREE

Micro Demo ******************* Секундные графики в Meta Trader 5 ********************** Более точного инструмента для входа в сделку вы не найдёте. Платная полная версия: Micro "Second charts" В демоверсии секундные периоды сменяются случайным образом через случайные интервалы времени. Отсутствует автоматическая настройка периодов бесплатных индикаторов.
Входные параметры: Displayed bars - отображаемые бары Step of price levels, pp, 0-off - шаг отрисовки ценовых уровней, пункты Scale
FREE

Normal Parabolic SAR with label of long or short state. Tells also "Parabolic long" and "short". Can be used in multitimeframe layouts together with Swiss HolyGrail indicator or in different timeframes. So, if all the indicators show "long" or "short" you can be sure that the risk of a wrong direction is small. The standard values for Parabolic SAR are 0.02 for step and 0.2 for maximum. You may experiment with changing the maximum to get smother curves. Note that changes in parabolic SAR are la
FREE
MetaTrader Market ofrece a todos los desarrollador de programas de trading una sencilla y cómoda plataforma para ponerlos a la venta.
Le ayudaremos con la presentación y explicaremos cómo preparar la descripción de su producto para el Market. Todos los programas que se venden a través del Market están protegidos por una codificación adicional y pueden ser iniciados sólo en el ordenador del comprador. La copia ilegal es imposible.
Está perdiendo oportunidades comerciales:
- Aplicaciones de trading gratuitas
- 8 000+ señales para copiar
- Noticias económicas para analizar los mercados financieros
Registro
Entrada
Si no tiene cuenta de usuario, regístrese
Para iniciar sesión y usar el sitio web MQL5.com es necesario permitir el uso de Сookies.
Por favor, active este ajuste en su navegador, de lo contrario, no podrá iniciar sesión.