• Tipo del indicador
  • Precio
     - 
  • Resetear
Ve el tutorial sobre el Market en YouTube
Cómo comprar un robot comercial o indicador
Inicia el robot en el
hosting virtual
Pruebe un indicador/robot comercial antes de comprarlo
¿Quieres ganar en el Market?
Cómo ofrecer un producto para que lo compren

Indicadores técnicos para MetaTrader 5 - 19

icon Usando como base las señales de los indicadores técnicos, usted podrá tomar decisiones sobre la apertura y el cierre de transacciones en fórex y los mercados de valores. La esencia de los indicadores consiste en la transformación matemática del precio y/o el volumen de un instrumento financiero para pronosticar los cambios de precio en el futuro. Ponga a prueba los indicadores técnicos para predecir mejor el comportamiento del mercado y ganar dinero con ello.
Trend Reversal alert: The concept of the EA is to give you a message/alert when something happens in the market, so you will never pass a tradechance for a trendreversaltrade. The EA give you the message when the chance is higher for a trendreversal, but it is important to say that this doesn`t mean that you should trade every signal. The advantage provided by the program is that you don`t need to sit the hole time for the PC and look at the chart because you get a message when a good trendrever
FREE
Imbalance MTF mt5
Barend Paul Stander
Imbalance / FVG MTF Mark Imbalance on chart of  Selected Multi Time frames. Trend is Manually set to filter signals in the chosen direction by a button on the chart. . Futures Auto Mark Imbalance / FVG on chart on selected time frames Select time frames by buttons on chart Popup Alert, Push Notification or email when New Imbalance Form Popup Alert, Push Notification or email when Imbalance is Taken out Select Alert Mode to be a single or multiple Imbalance ( OR / AND option )  when Imbalan
Candle Trend Bars
Muhammed Emin Ugur
Unlock the power of trend analysis with the Candle Trend Bars Indicator – your go-to tool for identifying and understanding market trends like never before. This innovative indicator transforms traditional candlestick charts into a dynamic and visually intuitive representation of market trends. Key Features: Trend Clarity: Gain a clear and concise view of market trends with color-coded bars that instantly convey the direction of price movements. User-Friendly Design: The indicator is designed wi
FREE
Highly configurable CCI indicator. Features: Highly customizable alert functions (at levels, crosses, direction changes via email, push, sound, popup) Multi timeframe ability Color customization (at levels, crosses, direction changes) Linear interpolation and histogram mode options Works on strategy tester in multi timeframe mode (at weekend without ticks also) Adjustable Levels Parameters: CCI Timeframe:  You can set the current or a higher timeframes for CCI . CCI  Bar Shift:   you can set
FREE
Medias
Claudio Andrade Colares
Indicador de seguimiento de tendencias con filtro promedio de señal de entrada Este indicador actúa como rastreador y filtro de tendencias, utilizando promedios móviles como señales de entrada. Las medias móviles son clave para determinar diferentes horizontes de tendencia: - El promedio primario estándar de 200 períodos indica la tendencia a largo plazo. - El promedio secundario de 50 períodos indica la tendencia de mediano plazo. - El promedio terciario de 20 períodos indica la tendencia
FREE
DBS Time
Dmitriy Burlachenko
5 (3)
A small utility displays the time in five time zones. You can customize the display of one to five time zones. For each time it is configured: show or not; name; time offset from GMT; color; In general settings, you can change: date / time format ("hh: mi", "hh: mi: ss", "yyyy.mm.dd hh: mi", "yyyy.mm.dd hh: mi: ss") font name; font size; offset from the left edge of the chart; offset from the top edge of the chart;
FREE
Average Session Range: Calculate and Average the Sessions High-Low Range of Specific Time Sessions Over Multiple Days. The Session Average Range is a sophisticated and precise tool designed to calculate the volatility of specific time sessions within the trading day. By meticulously analyzing the range between the high and low prices of a defined trading session over multiple days, this tool provides traders with a clear and actionable average range. **Note:** When the trading platform is closed
FREE
MA Alert Indicator  You do not need anymore to constantly and tediously look at the chart . If your strategy uses any type of moving average with any settings, just add this indicator to the chart according to your required settings You will be notified whenever the price hits your MA , whether touch or candle close by crossing it. Also, an arrow symbol will be displayed on the chart based on movement. If you d o not have access to your computer, just set your MetaTrader notification by t
Ind2tompson
Vasilii Luchnikov
El indicador 2indtompson es un indicador de comparación de dos herramientas para determinar los volúmenes, para equilibrar las operaciones de negociación de pares o para el comercio de arbitraje, preparado a partir de una versión analógica para el terminal MT4. Por lo tanto, si necesita comparar cuánto pesarán las dos herramientas y no sabe cómo hacerlo, coloque el indicador en el gráfico y calculará automáticamente los volúmenes necesarios para el equilibrio. Además, el indicador muestra el est
FREE
Simple Calendar Events is an indicator that will mark important Important Economy Events on your chart. For example, if you are trading something that is USD based, you would like to know when some important events are coming, you can expect some volatility or some different Price action, so you can base your strategy on it.  If you trade something that is country based you can also choose that, and it will show you when the event is, so you can be prepared for it. When you hover with the mouse
FREE
Trend Analyzer MT5 is a top-tier trend analysis indicator. It gives you a complete overview over current trend of multiple instruments over various time frames. It uses sophisticated statistical approach in order to determine the trend with the highest precision possible. Thanks to the Trend Analyzer MT5 you will know on which instruments you should focus on. Channel Group:   Click Here Features: Top-tier trend analysis One chart setup  Multiple time frames Multiple instruments Interactive da
FREE
The indicator is based on the relationship between two sets of Stochastic lines. The first set consists of 6 Stochastic with periods: 5, 8, 10, 12, 14, 16.  The second set consists of 6 Stochastic with periods: 34, 39, 44, 50, 55, 60. These periods are customizable. Input parameters Stochastic MA Method Method of calculation ===== Short-term ===== Stochastic #1 %K Period Stochastic #2 %K Period Stochastic #3 %K Period Stochastic #4 %K Period Stochastic #5 %K Period Stochastic #6 %K Period Short
FREE
Cybercycle Trend
Muhammed Emin Ugur
Introducing the "Cybercycle Trend" Forex Oscillator, a powerful technical indicator designed to enhance your trading experience in the foreign exchange market. This innovative tool utilizes advanced algorithms to identify and analyze market trends, providing you with valuable insights and helping you make informed trading decisions. The Cybercycle Trend Forex Oscillator is specifically designed to detect and measure cyclical price movements in the forex market. By incorporating this oscillato
FREE
ICT Institutional Levels
Aesen Noah Remolacio Perez
This indicator automatically draws horizontal lines at 00s, 20s, 50s and 80s levels.  If you trade ICT concepts and are an ICT Student, then you know that these levels are used as institutional support/resistance levels and/or fibonacci retracement anchor points.  Features Draws horizontal lines at 00, 20, 50 and 80 levels above and below current market price . Choose the amount of levels to show on chart Customizable line colors  Recommended for forex currency pairs. Saves time looking for the
FREE
This indicator displays fractal symbols and bars Use this indicator to show different symbols for bearish and bullish fractals: Choose from 144 symbols (refer to table below) Colors, size and offset of fractals can be modified Fractal price bar or candle color can be changed Hide fractals and show fractal price bar only Frequency in fractal calculation can be changed How to use 1. Select which symbols to use for bearish and bullish fractals; 2. Select which colors to use for bearish and bulli
FREE
Tool converted from tradingview indicator. Modified version with pivot points calculated in a more intuitive way. This tool displays relative   volatility   and directional trend. Excellent way to pickup diversions and reversals. Length can be lowered to 11 or 13 in settings to show price range. Can be used to identify patterns such as parallel channels and likely direction of price action.
Crash 1000 Scalping Indicator for the Crash 1000 Deriv Synthetic Index. Introduction The Crash 1000 Scalping Indicator is a specialized tool designed for the Crash 1000 index on the Deriv Synthetic market. This indicator is particularly useful for scalping on the M1 timeframe, helping traders to identify precise entry and exit points for buy positions. It is designed to be non-repainting, providing clear signals with audible alerts and push notifications, and is compatible with mobile devices th
Crash Sniper Scalping Indicator for MQL5 The **Crash Sniper Scalping Indicator** is a powerful and reliable tool specifically designed for traders looking to profit from the Crash markets. Whether trading Crash 1000, Crash 900, Crash 600, Crash 500, or Crash 300 indices, this indicator provides high-precision signals to simplify scalping. With its clear visual cues and accuracy, it's an essential tool for traders aiming to capitalize on quick market movements. Key Features: - **Multi-Timefr
Short term extremum
Gennadiy Stanilevych
5 (1)
The indicator determines and marks the short-term lows and highs of the market on the chart according to Larry Williams` book "Long-term secrets to short-term trading". "Any time there is a daily low with higher lows on both sides of it, that low will be a short-term low. We know this because a study of market action will show that prices descended in the low day, then failed to make a new low, and thus turned up, marking that ultimate low as a short-term point. A short-term market high is just
Orderflow Footprint
Panthita Aichoi
4 (1)
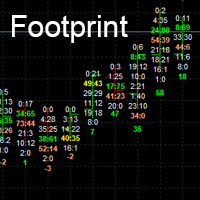
Footprint charts can add a level of depth to your visuals that standard charts cannot achieve. Footprint charts are a powerful way to visualize the ups and downs of the market, helping you potentially to make better trading decisions. Orderflow Footprint in MT5. show # of market orders at each tick. Inputs    Point Scale *1 to *10000    Number of candle to show.    Font Size    Max Bid Color (Top Seller)    Max Ask Color (Top Buyer)    Max Bid and Ask Color    Normal color
Color Levels  - удобный инструмент для тех, кто использует технический анализ с использованием таких инструментов, как Трендовая линия и Прямоугольник. Имеется возможность настройки двух пустых прямоугольников, трех закрашенных и двух трендовых линий. Настройки индикатора крайне просты и делятся на пронумерованные блоки: С цифрами 1 и 2 вначале - настройки пустых прямоугольников (рамок); С цифрами 3, 4 и 5 - настройки закрашенных прямоугольников; С цифрами 6 и 7 - настройки трендовых линий. Объ
Este es un indicador lineal de una potencia monetaria que tiene la capacidad de filtrar suavizando los valores. Muestra el poder actual de las monedas seleccionadas (el número máximo es 8), así como los valores históricos. El cálculo depende del período de tiempo del gráfico seleccionado en el que se lanza el indicador. El indicador muestra datos como líneas para todas las monedas o como un histograma para el par de divisas actual. La intersección de los índices de fortaleza de la moneda para el
KT Custom High Low MT5
KEENBASE SOFTWARE SOLUTIONS
KT Custom High Low shows the most recent highs/lows by fetching the data points from multi-timeframes and then projecting them on a single chart. If two or more highs/lows are found at the same price, they are merged into a single level to declutter the charts. Features It is built with a sorting algorithm that declutters the charts by merging the duplicate values into a single value. Get Highs/Lows from multiple timeframes on a single chart without any fuss. Provide alerts when the current
Magneto MT5
Vladimir Blednov
Описание Данный индикатор строит (альтернативные, математически рассчитанные) уровни поддержки и сопротивления, а так же уровни, к которым с большой вероятностью придет цена в ближайшее время. Следует обратить внимание на то, что расчет уровней производится на исторических данных, и качество котировок играет важную роль при построении индикатором линий. Замечу, что отрисованные Magneto и Magneto Weekly линии не изменяют свои значения на всем расчетном периоде. Важное изменение! Добавлена функция
Este indicador ha sido diseñado a base del indicador Heiken Ashi. Ayuda al usuario elegir la dirección de la operación. Esta utilidad también tiene incorporada la función del aviso sonoro cuando aparece una nueva señal. Aparte, está disponible la función de avisos vía e-mail. Su dirección del e-mail, así como los parámetros del servidor SMTP tienen que estar indicados en los ajustes del terminal MetaTrader 5 (la pestaña "Correo electrónico"). Flecha azul arriba = Compra. Flecha roja abajo = Vent
FREE
Alert Line Pro MT5
Hoang The Manh
5 (1)
This is MT5 version, MT4 on this link: Alert Line Pro MT4 Alert line pro allows to make alert when price cross these objects:  Horizontal lines Trendline Price Zone (Rectangle) Alert when close current bar (have new bar) When the price crosses the alert lines, the software will sound an alarm and send a notification to the MetaTrader 5 mobile application. You need to settings your   MetaQuotes ID of MT5 apps to MetaTrader5 software to get notification to the mobile phone. Sound files must be pl
ATR Moving Average
David Gitau Gakunga
5 (1)
ATR Moving Average draws a moving average of the standard Average True Range( ATR ) in the same window. Settings Name Description ATR period Set Price per iod for ATR calculation ATR level Set ATR value for thresholding( only whole number, ignore leading zeros e.g. 0.00089 = 89 ) MA Period Set moving Average Period MA Method Set moving average method( Simple, Exponential, Smoothed and Linear Weighted ) MA Shift Set moving average shift Enable Alerts ? Generate Alert when ATR crosses
FREE
Chandelier closed
Luis Enrique Ricales
Developed by Charles Le Beau and featured in Alexander Elder's books, the Chandelier Exit sets a trailing stop-loss based on the Average True Range (ATR). The indicator is designed to keep traders in a trend and prevent an early exit as long as the trend extends. Typically, the Chandelier Exit will be above prices during a downtrend and below prices during an uptrend. Calculation The original Chandelier Exit formula consists of three parts: a period high or period low, the Average True
FREE
True Volatility
Cristian Eriksson
5 (1)
ATR is an excellent indicator to visualize if volatility is increasing or decreasing. But what if you want to compare the volatility to another pair or instrument? Since each pair with different quote currency has different pip value, the output of the ATR doesn't really say that much. Comparing pairs to other instruments is even harder.  What you as a trader care about is how much the pair has moved up or down in percentage, therefore normalizing ATR to percent would make things much easier.  T
FREE
The  Day Trading Price Pattern  indicator is an indicator of entry points that searches for and displays Price Action system patterns on dozens of trading instruments and on all standard time frames: (m1, m5, m15, m30, H1, H4, D1, Wk, Mn).  Show all the main Price Patterns are introduced in the Ebook  Day Trading With Price Action - Galen Wood You won't never miss any potential trading setup. Want to send all the signals to your Telegram Channel? Checkout this guide Advantages 1. Patterns:
FREE
Functional in the Forex market. Functional in the B3 market - Bolsa Brasil Balcão. Motivation The technical Fibonacci retraction indicator for many is essential and the basis for all market movement forecasts. The name of the tool comes from the Italian mathematician Leonardo de Pisa (13th century). This DEMO version will work in Meta Trader with Demo and Strategy Tester. To purchase the Full version that works on a Real account, click on: https://www.mql5.com/en/market/product/38089
FREE
Shape Pack MT5
John Louis Fernando Diamante
This indicator provides common shapes as drawing object options. The shapes are rotatable, resizable, draggable, and will keep their proportions (according to their handle trendline) across different chart scales. Multiple drawings are supported. Shapes: Square Rhombus Triangle (quadrilateral & isosceles) Circle (grid, overlapped grid, flexi grid, rotatable grid, concentric circles) Features: rays (all object edges will be rays) show/hide each individual drawing type, or all delete last drawn
FREE
Heikin Ashi candlesticks are a powerful tool for traders, offering a clear and smooth visualization of market trends. Unlike traditional candlesticks, they filter out market noise, providing a cleaner view of the market's direction and strength, which helps traders make more informed decisions. The Hull Heikin Ashi Smoothed indicator from Minions Labs takes this a step further by integrating the Hull Moving Average for enhanced smoothing and precision. This indicator not only simplifies trend id
Price DNA MT5
Ruben Octavio Gonzalez Aviles
Price DNA es un indicador de tendencia que utiliza medias móviles ponderadas por relación compuesta para reducir los desfases y permitir la detección temprana de tendencias. El indicador no se repinta y puede aplicarse a cualquier instrumento financiero en cualquier marco temporal. ¿Cómo funciona el ADN de precio? El indicador mostrará múltiples ondas en el gráfico, que indican la dirección de la operación actual. Cinco ondas verdes o cinco rojas indican una fuerte tendencia alcista o bajista,
Diagrama de bloques: una forma alternativa de comercio Si es un comerciante que está confundido por las velas en innumerables gráficos, o no sabe cómo dibujar líneas o cómo dibujar líneas de soporte y resistencia, debería encontrar otro método de negociación que se adapte a sus necesidades en este momento. NS. Al igual que un conductor se detiene para una revisión completa después de encontrar problemas repetidamente, lo mismo ocurre con una transacción. El gráfico de ladrillos proporciona un mé
Highly configurable Osma indicator. Features: Highly customizable alert functions (at levels, crosses, direction changes via email, push, sound, popup) Multi timeframe ability Color customization (at levels, crosses, direction changes) Linear interpolation and histogram mode options Works on strategy tester in multi timeframe mode (at weekend without ticks also) Adjustable Levels Parameters: Osma Timeframe:  You can set the lower/higher timeframes for Osma. Osma   Bar Shift:  Y ou can set th
FREE
The Magic SMMA indicator is of great help in determining trend direction. It can be an excellent addition to your existing strategy or the basis of a new one. We humans can make better decisions when we see better visually. So we designed it to show a different color for rising and falling trends. Everyone can customize this in the way that suits them best. By setting the Trend Period, we can optimize it for longer or shorter trends for our strategy. It is great for all time frames. IF YOU NE
FREE
This MT5 alert is designed to identify potential buying opportunities based on several technical indicators and price action patterns. Here's how it works: Buy Conditions 1. RSI Condition:    The Relative Strength Index (RSI) for the current period is below a specified low threshold (RsiLow). This indicates oversold conditions. 2. Candlestick Pattern:    It checks for a specific candlestick pattern across three consecutive candles:    - The current candle (1) closes higher than it opens (bull
FREE
Day Trade System
Nardus Van Staden
5 (1)
Introducing The Day Trader System: Your Shortcut to Day Trading Success! Are you a day trader seeking simplicity without compromising profitability? Look no further! We present The Day Trader System – your go-to solution for identifying lucrative opportunities in the fast-paced world of Forex. Simple Yet Powerful: The Day Trader System is a straightforward yet highly effective indicator designed exclusively for day traders. Say goodbye to complexity and hello to a system that simplifies
FREE
*Non-Repainting Indicator Bruce Webb Explains How To Use Bruce's Price Predictor In Detail And Free Forex Strategy  https://youtu.be/hfoB1tZZpTo Bruce's Price Predictor is an indicator that shows precise price reversals. A great arsenal to add to any chart.  Bruce's Price Predictor points price reversals with high degree of accuracy and it is great for scalping on the 1min time frame, Or swing trading on the 1hr time frame. Buy and sell arrows are shown on the chart as for entry signals. They do
Este indicador de marco de tiempo múltiple y símbolo múltiple identifica formaciones superiores / inferiores dobles o triples o una ruptura del escote siguiente (superior / inferior confirmada). Ofrece filtros RSI, pin bar, envolvente, pinzas, estrella matutina / vespertina, así como opciones de filtro de divergencia que permiten filtrar solo las configuraciones más fuertes.  El indicador también se puede utilizar en modo de gráfico único. Lea más sobre esta opción en el producto   blog .   Comb
Cybertrade Double Bollinger Bands - MT5  The Bollinger Bands indicator shows the levels of different highs and lows that a security price has reached in a given duration and also their relative strength, where the highs are close to the upper line and the lows are close to the lower line. Our differential is to present this indicator in a double form, with the availability of its values ​​to simplify automation. It works on periods longer than the period visible on the chart. All values ​​are
FREE
YY Mono Waves MT5
Yuryi Yatsenko
3 (1)
The Mono Waves indicator is designed to display the wave behavior of the market on a chart. Its appearance is presented on slide 1.   This indicator uses the PPPC (Point-Percent Price Channel) indicator, which can be downloaded for free from the  Market .              When the market moves up, the upper border of the price channel is built on High candlestick prices (for more details, see the description of the PPPC indicator at the link given above). The higher the High prices rise
FREE
WaSwap MT5
Wachinou Lionnel Pyrrhus Sovi Guidi
WaSwap MT5 Indicator shows the current Swap Long and current Swap Short with color. * Set the Swap Threshold and the color to identify when the current swap is below or above the Spread Threshold. * Set X axis and Y axis and chose the Corner and the Anchor to position the Swap Label on the chart. * Write the font and the font size for more confort. * Activate alert if the current Swap Long or the current Swap Short is below the swap threshold. * The user will never swing with a negati
FREE
This  variant of the ZigZag  indicator is recalculated  at  each  tick  only at the bars that were not calculated yet and,  therefore, it does  not  overload  CPU  at  all  which  is  different   from  the standard indicator. Besides, in this indicator drawing of  a  line is  executed exactly in ZIGZAG style  and, therefore, the  indicator  correctly and simultaneously  displays  two  of its extreme points (High and Low) at the same bar! Depth is a minimum number of bars without the second ma
FREE
ADX by AV
Alexey Viktorov
4.25 (4)
This is an unusual representation of the Average Directional Movement Index. The indicator has been developed at the request of a trader and for the purposes of learning the development of indicators in MQL5. The line shows the same as the standard Average Directional Movement Index (ADX); The upward histogram shows the difference between +DI and -DI, when +DI is above -DI; The downward histogram shows the difference between +DI and -DI, when +DI is below -DI.
FREE
HiperCube VIX
Adrian Lara Carrasco
Bienvenido a HiperCube VIX Este indicador le proporciona información real del mercado de volumen de sp500 / us500 Definición HiperCube VIX, conocido como el índice de volatilidad CBOE, es una medida ampliamente reconocida del miedo o estrés del mercado. Señala el nivel de incertidumbre y volatilidad en el mercado de valores, utilizando el índice S&P 500 como un indicador del mercado en general. El índice VIX se calcula en función de los precios de los contratos de opciones sobre el índice S
FREE
Zigzag Indicator For RSI, To easily identify the highs and lows of the rsi signal. It is easier to observe divergent and convergent signals. Default setting: InpRsi           =14      //Rsi Period InpDepth      =12;  // Depth InpDeviation =5;   // Deviation InpBackstep  =3;   // Back Step If you want open Exness account try this link :  https://one.exness-track.com/a/teg5teg5 Dev buy taphu: Ha Van Tan - hatatrata - Trader's profile - MQL5 community   Email: tan.ha@outlook.com
FREE
GenMA
Igor Radko
GenMA MTF The signal indicator WITHOUT REDRAWING gives recommendations on the direction of trading. When the price moves through the internal channel, it gives signals (red and blue arrows) that recommend a possible change in the direction of the price movement up or down. When the price crosses the external channel, it gives signals (yellow arrows), warning that a strong price movement is possible, which will not immediately change the direction of trading. When the price crosses the a
FREE
CCi Oscillator Breakout
Mohamed Hassan Mohamed Hassan Alsherbiny
Probability emerges to record higher prices when CCi oscillator breaks out oscillator historical resistance level when exhibit overbought values. Since, oscillator breakout of support and resistance have similar effect as price breaks support and resistance levels, therefore, its highly advised to confirm price breakout with oscillator breakout; certainly, will have the same output in short trades. Concept is based on find swing levels which based on number of bars by each side of peak or troug
FREE
¿Quieres tener éxito en el mercado Forex? Nuestro innovador indicador   AI Swing Trading es su clave secreta para operar con éxito y rentabilidad. Te presentamos esta herramienta única: Nuestro indicador está equipado con una red neuronal incorporada que le permite analizar grandes cantidades de datos, identificar cambios y predecir movimientos de precios. Esta tecnología le permite tomar decisiones comerciales informadas basadas en un análisis de mercado en profundidad. El algoritmo del indi
Spread Monitor MT5
Fabio Cavalloni
5 (1)
This is a usefull utility for monitoring spread and also for recording informations to a file. (Files will be placed into "Common\Files\Spread Monitor"). There is the possibility to let the indicator calculate high/low into the past thanks to downloading ticks. (It's a slow and approsimate thing! The best way to use it is to attach to a chart and let it recording spread in real time). There is also a buffer with the average of spread in latest X periods. Easy and effective.
FREE
Have you ever wondered which currency is the strongest at any particular time? Or which currency pair is trending the most. Well, the currency strength meter helps with just that.  It compares  USD ,  EUR ,  AUD ,  CHF ,  GBP ,  CAD  and  NZD  depending on the timeline you have chosen in settings, and ranks them on the number of pips each has moved compared to the rest. N/B: All currency charts of the above pairs must have loaded. You can do this by highlighting all major and minor currencies in
FREE
The DD_Profit_Monitor MT5  indicator is a trading tool developed by the Dagangduit Core Team . This indicator is designed to monitor profits in real-time with the following key features: All Time Profit : Displays the total profit earned since the beginning of the trading account's usage. This feature helps traders see the overall performance of their trading activities. Daily Profit : Displays daily profits, allowing traders to monitor their daily performance more specifically. Key Features: Al
FREE
RSI Alarm Osw
William Oswaldo Mayorga Urduy
RSI ALARM  (Para Metatrader 5) Este indicador funciona como un RSI normal con todas sus configuraciones (Periodicidad, colores, niveles, etc), pero adicional se puede establecer alarmas en el nivel superior e inferior (Ejemplo 70 y 30), con la posibilidad de ajustar estos niveles moviendo las líneas azul y roja para establecer los niveles superior e inferior. También se puede activar y desactivar una función adicional que crea una flecha en el grafico cuando se cumpla el RSI esperado superior o
Hi All ! I want to share with you my favorite indicator to identify strong trend bias. It helps me a lot with my entries and exits.  You can use it on any market and any instrument. It works best on daily tiimeframe 1D but you can also use it on 1H and be carefull with lower timeframes This indicator uses MACD, RSI and Stoch. The idea is simple, when MACD crosses above a Signal line and RSI > 50 and Stoch > 50 we consider the trend is going UP on the opposite we consider its DOWN Feel free to us
FREE
Based on the trend-following principle of CCI, it has been improved to become an indicator that can identify the reversal of the trend and its development direction, that is, it can identify the top and bottom attenuation of the oscillating trend in the trend market. feature The red and green columns represent the trend of bullish or bearish development under the current cycle. The blue line shows the position and attenuation of the current price trend in the current cycle. The upper and lower
FREE
The "Trend Fishing Indicator" is a powerful custom indicator designed to help traders identify potential trend reversal points and capitalize on market momentum. This indicator uses multiple moving averages of varying periods to evaluate short-term and long-term market trends. By comparing the short-term moving averages against the long-term ones, it generates clear buy and sell signals that can guide traders in making informed trading decisions. Key Features: Multiple Moving Averages : Incorpor
FREE
Mitimom
Danil Poletavkin
The indicator is based on Robert Miner's methodology described in his book "High probability trading strategies" and displays signals along with momentum of 2 timeframes. A Stochastic oscillator is used as a momentum indicator. The settings speak for themselves period_1 is the current timeframe, 'current' period_2 is indicated - the senior timeframe is 4 or 5 times larger than the current one. For example, if the current one is 5 minutes, then the older one will be 20 minutes The rest of the
FREE
Daily Monitoring : The indicator automatically calculates and displays the daily drawdown on your trading chart, allowing you to see how well you're performing on a daily basis. Risk Management : By monitoring daily drawdown, traders can better manage their risk. It helps to keep daily losses within acceptable limits. Real-Time Information : Daily drawdown is updated in real-time, providing accurate and up-to-date information about your trading performance. How to Use: Activate the "Daily Drawd
FREE
MACDmaxmin free demo
Carlos Andrés Moya Erazo
5 (3)
El indicador muestra cuando hay sobreprecios y divergencias sobre un MACD normalizado Además, muestra niveles de sobreprecios dinámicos autorregulados y una configuración e interfaz simple Este indicador calcula automáticamente los rangos de sobreprecio. MACDmaxmin es un indicador basado en el oscilador MACD que identifica de manera efectiva cambios de tendencias en el precio, ya que es un indicador de momentum que captura la tendencia y muestra la relación entre dos medias móviles del precio.
FREE
Are you a  trend surfer like us? Do you use Moving Averages too? Ever wanted the are between them to be painted? Yeah, we solved this problem with the Filled MAs indicator! It is very simple, just puts two fully customizable Moving Averages on chart and fill the space between them, changing the color as they intersect. Thanks to gmbraz for the version 1.1 idea. Any questions os suggestions please contact me! Enjoy! This is a free indicator, but it took hours to develop. If you want to pay me a
FREE
Divergent Bar
Danil Poletavkin
Una barra de inclinación de Bill Williams con angulación. Se utiliza como ángulo el ángulo entre la línea verde y la parte superior/inferior de la barra, que en principio sigue las pautas actualizadas de Justin Williams. La configuración predeterminada del ángulo de 85 y 21 Bar desde el momento en que cruza la línea de Labios de Cocodrilo funciona bastante bien. Si usa este indicador en el comercio real, no recomiendo encarecidamente el comercio dentro del día, use gráficos diarios. La señal
FREE
Trend Envelopes indicator is calculated based on a % of price change. That % is then used to determine if there is a new trend or trend remains the same. This version is using Standard Deviation for the price change calculation instead and is adding prices smoothing prior to be used in calculations. The smoothing can be done using one of the 4 average types: *   Simple Moving Average *   Exponential Moving Average *   Smoothed Moving Average *   Linear Weighted Moving Average Als
FREE
Key Features: Robust Algorithm: Based on John F. Ehlers’ renowned Fisher Transform formula, our indicator excels in pinpointing major price shifts, facilitating more informed trading decisions. Versatile Application: Works seamlessly with any asset, including forex, stocks, commodities, and indices, offering wide-ranging applicability for diverse trading strategies. Customizable Settings: Tailor the indicator to your trading style with adjustable parameters, including the transformation length,
FREE
This indicator draws a vertical line repeatedly at the set time. The number of lines that can be set can be set arbitrarily. In addition, it is possible to set 4 types of lines. It is possible to change different times, colors, line types, etc. The time can be set to any time in minutes. In the next version, we plan to display the high and low prices within the setting range.                                                                                                                    
FREE
Un indicador muy simple pero efectivo. Se basa en la línea KijunSen del indicador Ichimoku, sobre la cual se construye la media móvil MA. Las señales de compra o venta se producen cuando estas dos líneas se cruzan. A menudo utilizo la línea del indicador KijunSen para mis operaciones: cuando el precio está POR ENCIMA de esta línea, me concentro únicamente en COMPRAR, mientras que cuando está POR DEBAJO, me concentro en VENDER. Además, después de promediar la línea KijunSen y crear la medi
Fractals ST Patterns Strategy
Vladimir Poltoratskiy
5 (1)
Fractals ST Patterns Strategy is a modification of Bill Williams' Fractals indicator. It allows setting any number of bars to find a fractal. This simple indicator corresponds to the parameters specified in the ST Patterns Strategy ( https://stpatterns.com/ ) . Structural Target Patterns are essentially the market itself, which is consistently divided into components. To form ST Patterns , no trend lines, geometric proportions of the model itself, trading volume or open market interest are neede
FREE
Opening Price
Flavio Javier Jarabeck
4.6 (5)
For those Price Action traders who love to trade strong Price points, like today's Opening Price (or even yesterday's Price), here is an indicator to ease the identification of those values, drawn directly on your chart! Opening Price will automatically draw a line showing you this point for you, AND, if you like any OPENing price in the past, not just today's price. A must-have in your Price Action toolbox! SETTINGS How many past days do you want to be drawn? Do you want to draw the current
FREE
The Magic EMA indicator is of great help in determining trend direction. It can be an excellent addition to your existing strategy or the basis of a new one. We humans can make better decisions when we see better visually. So we designed it to show a different color for rising and falling trends. Everyone can customize this in the way that suits them best. By setting the Trend Period, we can optimize it for longer or shorter trends for our strategy. It is great for all time frames. IF YOU NEE
FREE

MetaTrader Market permite adquirir los programas para la plataforma MetaTrader máximamente seguro. Usted puede descargar las versiones demo de robots e indicadores que le ha gustado directamente desde el terminal y probarlos en el Probador de Estrategias.

Pruebe el programa en diferentes regímenes de funcionamiento antes de comprarlo para tener la mejor idea sobre el producto, y pague por el producto que le ha gustado a través del sistema de pago MQL5.community.

El sistema de pago MQL5.community garantiza el pago a los vendedores, y la posibilidad de probar el programa en diferentes regímenes de funcionamiento permite a los compradores conocer el producto al máximo posible.