Robots comerciales e indicadores gratis para MetaTrader 5 - 28

The Market Thermometer can be used to help traders identify sleepy or turbulent periods.
It helps beginners to check when is the ideal time to enter operations, that is, when the value of the thermometer is below its average for several periods, identifying a peaceful market. When the market is heated, that is, the thermometer is above three times its average, it is time to make profits. The Thermometer measures the extent to which the end of a period, maximum or minimum price, projects outsi
FREE

This indicator looks for 3 rather strong patterns: Spinning Top pattern Hammer or Hanging Man Inverted Hammer or Shooting Star These patterns may indicate a trend continuation or its reversal, depending on the location of the patterns.
Input parameters Distance - distance between the signal and the formed signal Note: the higher the timeframe, the greater the value should be used in Distance to display the signal correctly
Indicator Features Suitable for any currency pair Operating timeframe
FREE

Connector Solutions Binance es una utilidad de consultoría para copiar operaciones en la bolsa Binance.
Será útil si usted opera en MetaTrader 5, pero desea que sus operaciones se coloquen en una bolsa de criptomonedas como Binance.
Connector Solutions Binance copia las operaciones de la cuenta demo colocadas a través de MetaTrader 5 (en esta cuenta demo deben estar las criptodivisas con las que desea trabajar).
Esta versión de Connector Solutions Binance es gratuita y, por lo tanto, sólo
FREE
Traders Club Clock for MT5 Readme
ローソク足のすぐ横にその時間足での 残り時間とスプレッドを表示します。 ※残り時間はサーバ時間から計算しています。 月足、週足、日足、4時間足、1時間足、30分足、15分足、5分足、1分足
で表示可能となっております。
※スプレッド値ポイント単位での表示になります。
※時間の更新はティック毎ではなく1秒 毎 に更新するようにしています。
一目で残り時間とスプレッドを確認できます。 機能: 使用しているフォント種類を変更できます。 使用しているフォントサイズを変更できます。 表示しているテキストの色を変更できます。 スプレッド表示を非表示にすることができます。 表示する位置を変更することが出来ます。
FREE

With this indicator user can determine not just pivot like turning points. User able to spot trading ranges boundaries and support-resistance levels. In a strong trend the reverse signals also gives us excellent entry points. Recommended user settings: In the Attis volume: look back period : 1 or (3) MA_Lenght 99. ( of course one can play with the settings and get tailored signals... as you need)
FREE

XFChart simplifies trading strategies with customizable options for informed decision-making across various styles, from scalping to position trading.
1. Risk Management: - XFChart offers automatic breakeven and trailing stop features to protect profits and reduce emotional decisions. - Auto Breakeven is disabled by default and can be enabled through the indicator properties window. - The "Auto Trailing Stop Loss" adjusts the stop loss based on market movement, facilitating profit loc
FREE

FXRog = Forex Running On Growth
Expert Advisor description ShortTerm : Yes MidTerm : Yes LongTerm : Yes TargetProfit : By Money, value can be changed in the parameter StopLoss : By Maximum Open Position, all position will closed when maxtrade is reach, value can be changed in the parameter
Parameter description StartTrade : begining time to start trading EndTrade : last time ea to open a position MoneyManagement : 1 = FixLot, 2 = VolumeLot FixLot : lot of transactions with a fixed amoun
FREE
The AllClosedMT5 utility in the form of an expert. The utility is designed for closing all open positions simultaneously based on the total profit (in the deposit currency) of all open positions. The utility can be attached to any chart with any trading instrument.
Parameters Profit - the total positive profit in the deposit currency, at which all open positions are closed (profit). Stop - the total negative profit in the deposit currency, at which all open positions are closed (loss). The val
FREE

The Indicator indicator draws 2 clouds based on Bollinger Bands indicator values. The upper cloud is formed by the upper lines values and the lower cloud by the lowers lines values. The indicator allows to change the Bollinger Bands parameters and the clouds colors the period of the base line and the deviations of each Bollinger Bands instance. The indicator holds 5 buffer index as follow: [0] - Outer values of the upper cloud [1] - Inner values of the upper cloud [2] - Base/Center line values
FREE
This is a simple indicator that shows the spread in points. It is useful for those like trade scalper, in addition to be customizable.
Functions:
Color - I don't need to explain :) Font type - I don't need to explain :) Font size - I don't need to explain :) First text - text in front of spread number Second text - aditional text after the spread number. Corner - specify the corner where the spread will be written. Horizontal distance - horizontal distance from the edge. Vertical distance -
FREE

*Display all text information you need on your charts.*
This will help you on displaying text on the chart, to note everything , for example: strategy.
* BUY SIGNAL
- rule 1 - rule 2 - rule 3 - etc * SELL SIGNAL
- rule 1 - rule 2 - rule 3 - etc
This will remind you to follow the discipline and trading strategy set by you.
The Discipline to Follow Rules is the Mark of a Top Trader
Safety first, then profit will come.
FREE

For those Price Action traders who love to trade strong Price points, like today's Opening Price (or even yesterday's Price), here is an indicator to ease the identification of those values, drawn directly on your chart! Opening Price will automatically draw a line showing you this point for you, AND, if you like any OPENing price in the past, not just today's price. A must-have in your Price Action toolbox!
SETTINGS
How many past days do you want to be drawn? Do you want to draw the current
FREE
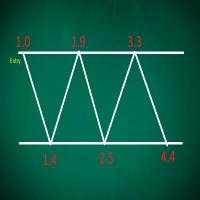
This EA performs with a Hedging strategy by which Buy and Sell signals are from the MACD indicator.... The lot sizes in the input are Custome for you to adjust as you pleased, so you are able to improve your hedging style. Inputs. Close Money- this option is basically the take profit in ($), for example if you set the close money at $20 the EA will automatically close all trades when your overall profit is $20. Nearby Hedge Pips- this basically determine the distance of pips between yo
FREE

This indicator shows the value of returns in the selected time frame
They are calculated as logarithm of returns , rather than price or raw returns. For small returns, arithmetic and logarithmic returns will be similar. The benefit of using returns, versus prices, is normalization. It is possible measures all variables in a comparable metric despite originating from price series of unequal values
Inputs You can display data both as a Histogram or a Line It's also possible to display the
FREE

EA to prevent inactivity violations on prop firms.
This EA will scout for your most recent trade and if it is older than the number of days defined, will enter a micro lot position size 0.01 on the pair defined. It is recommended to use a tight spread pair like EURUSD. This EA will not act as long as you have at least one trade in the last X days (defined on config).
This EA will not place other trades or modify existing position.
FREE

The Expert Advisor is based on the indicator "Oscillator of RSI" . It is suitable for currency pairs such as EUR/USD on the M15 timeframe. Each trade is protected by a Stop Loss and Take Profit. The EA uses a Martingale that is set to 2.0 (so be careful). By default, the lot is set to 0.05, you can change it in the EA settings. Below are the test results for the last 3 years. Initial balance = 10,000 $ Net profit = 6,983 $ Drawdown = 17% Other products: https://www.mql5.com/ru/users/yura1994
FREE

The Display N Bars utility is a simple tool designed to help identify candles.
If a trader tries to share knowledge with a colleague but it is difficult to pinpoint exactly the desired candle, just say the corresponding candle number.
The candle count is reset every day.
Seeking to offer a good customization the inputs are:
Display type -> Display only odd, only odd, or both candles?
Direction -> Horizontal or Vertical?
Display multiples of: (display frequency) -> Displa
FREE

The M Extensions are variations of the Golden Ratio (Fibonacci Sequence). It is the World's first technique developed for Candle Projections.
Advantages:
Easy to plot. Candle anchoring; High and accurate precision as support and resistance; Excellent Risk x Return ratio; Works in any timeframe; Works in any asset / market. The M Extensions are classified into:
M0: Zero point (starting candle) RC: Initial candle control region M1: Extension region 1 M2: Extension region 2 M3: Extension r
FREE

Bienvenido al futuro del trading con KMeans Price Zones Detector, un innovador indicador de MetaTrader que aprovecha el poder del aprendizaje automático para identificar zonas clave de precios. Esta herramienta utiliza el algoritmo de agrupamiento KMeans para detectar dinámicamente los centroides en los datos de precios, destacando áreas donde es más probable que los precios encuentren soporte, resistencia o consolidación. Algoritmo innovador KMeans KMeans Price Zones Detector se destaca por su
FREE

The Emerald is a Comprehensive utility integrated with a number of tools including the Currency Strength Meter, Trade/directional signal, signal strength, Current bar countdown timer, Forex market sessions time converter and many more.
Can be used in all time frames and all markets The currency strength meter helps you identify which currencies are strong and which currencies are weak. All the 10 major currencies are monitored in real-time. The Emerald can used to predict currency movements wh
FREE

This indicator displays breakouts on Point-And-Figure-like or Kagi-like custom symbol charts, generated by special expert advisers, such as PointFigureKagiCharts . This indicator is applicable only for custom instruments generated in appropriate way (with time-invariant bars which are multiples of a predefined box size). It makes no sense to apply it to other charts. The breakouts in up or down direction are marked by arrows. The breakout price is found at crossing of one of imaginary lines of
FREE

It adds the symbols listed on Binance Spot to the Metatrader5 market clock. With this free file you can list the entire list in seconds. You can easily upload it to your demo account. It is the first file uploaded for Binance Spot Tick and is available for free. Tools menu / Options / Expert Advisors / You need to select Use WebRequest for listed URL You can watch videos to add Metatrader.
FREE

The Relative strength index is an oscillator that follows price, it was introduced by Welles Wilder, who went on to recommend the 14 period RSI. This adaptive version is based on the indicator described by John Ehlers, in the book 'Rocket Science for Traders'. The indicator uses the homodyne descriminator to compute the dominant cycle. To apply the homodyne descriminator, real and imaginary parts have to be calculated from the Inphase and Quadrature components. (Inphase and Quadrature components
FREE

Bienvenido a una nueva era de trading con el indicador AI Moving Average, un avanzado indicador de MetaTrader 5 diseñado para proporcionar a los traders información predictiva sobre los movimientos del mercado. Esta herramienta combina la potencia de la IA con la fiabilidad de una media móvil exponencial sin retraso para ofrecer predicciones precisas y oportunas de las tendencias futuras de los precios. Modelo Innovador de Regresión Lineal AI Moving Average aprovecha un modelo de aprendizaje aut
FREE

Lite Hamster Scalping (Very Fast EA no Graphics)
The Lite Hamster Scalper is a Trading Robot with no use of Classic martingale. Schedule scalping Options. it uses some Indicators as a filter to maximize Correct entries.
Please to check The version 1.4 of Hamster Pro : Hamster_PRO_MT4 && Hamster_PRO_MT5 Recommendations : Lot : 0.01. Balance : 100 USD. Pair : EURUSD. TimeFrame : 5Min. Spread : 30. Broker : Trusted Brokers Inputs descriptions : Period Indicator1 - period of the fi
FREE

Level Assistant es un asistente experto para configurar manualmente los niveles de soporte y resistencia.
Los comerciantes a menudo forman sus propios niveles. Si hay muchos gráficos de diferentes períodos, el nivel se multiplicará por todos los gráficos.
Al colocar una línea horizontal en un gráfico, el Asistente sugiere convertir esta línea en un nivel. Al mismo tiempo, él mismo determinará el color y el grosor de la línea, según el período del instrumento y dónde se encuentra en relación
FREE

SparkLight EA is a fully automated expert advisor that uses advanced algorithms for the price analysis of the latest trends. Every order has StopLoss and every order is placed based on the primary or the secondary trend analysis algorithm. This EA does NOT use Martingale or Arbitrage strategy. It can trade more orders at the same time but every order has the same Lot size if using FixedLotSize. SparkLight EA is NOT a minute scalper or tick scalper that produces high number of trades per da
FREE
Easy to use EA designed to auto trade. Works in every market condition. It uses reliable levels of MACD indicator combined with unique logic to perform fully automatic trading operations. *For MT4 version please go here! *If you don't like automated system and only need an alert system to help you in trading. Please check this arrow with alert system here!
FEATURES: Dangerous methods like martingale, hedge, grid or scalping are NOT used. Each position has Stop Loss and Take Profit. Positional
FREE

This Price indicator aid you to read prices of a bar without using native MT5 instuments like crosshair.
The indicator gives you the OPEN HIGH LOW CLOSE and 50% bar prices of the current or one of the previous bar.
Parameter setting are: TimeShift: Used for bar selection (0 stand for current 1 for previous 2 for 2 bars ago) Other parameter are using for esthetics. Each Label can be moved away from its initial position.
FEEL FREE TO REPORT BUG AND REVIEW THIS INDICATOR. THANKS
FREE

Media Móvel Grátis para uso em conjunto ao Diamond Indicator Atenção. Essa é a mm para conjugar ao indicador. Esse não é o indicador. Comprem o indicador que está tendo ótimos resultados. A seguir informações sobre o indicador: Indicador Para Opções Binarias. Usa dois gales. Instalar em mt5 Esse indicador é para ser usado no tempo de vela de 5 minutos e em M5. Este também funciona em M1, porém é mais eficiente em M5. Só descompactar e copiar os arquivos na pasta de dados do seu MT5. Arquivos
FREE

The indicator calculates the inclination angle between the Highs, Lows and Closes of adjacent bars. The angle can be measured in degrees or radians. A linear graph or a histogram is drawn in a subwindow. You can set the scale for the calculation — floating or fixed. For use in Expert Advisors or indicators, you need to specify a fixed scale.
Parameters Angular measure — degrees or radians. Scale mode for calculation — scaling mode. Free scale — free transformation, the indicator will calculate
FREE

Spire - показывает трендовый, сигнальный, свечной прорыв в сторону верхней или нижней границы канала, а так же временную или долгую консолидацию в виде прямоугольного канала. Сигналы тренда не перерисовываются. В основу идеи индикатора входит Bollinger Bands.
Изменяемые параметры Signal trend -изменение цветовой гаммы сигнального символа тренда Lower limit - изменение цветовой гаммы нижней границы канала Upper limit - изменение цветовой гаммы верхней границы канала Internal field -изменение
FREE

verview: Our custom Kalman Filter indicator is a sophisticated, adaptive tool designed for MetaTrader 5 (MT5), offering traders a dynamic approach to analyzing financial markets. This indicator is based on the Kalman Filter algorithm, a powerful statistical method used for linear dynamic systems estimation. It's tailored for traders who need an advanced, responsive tool to track market trends and make informed decisions. Key Features: Dynamic Trend Analysis: The Kalman Filter continuously adjust
FREE

The new version of MirrorSoftware 2021 has been completely rewriten and optimized.
This version requires to be loaded only on a single chart because it can detect all actions on every symbol and not only the actions of symbol where it is loaded.
Even the graphics and the configuration mode have been completely redesigned. The MirrorSoftware is composed of two components (all components are required to work): MirrorController (free indicator): This component must be loaded into the MAST
FREE

When creating, modifying and moving a trend line, two anchor points will be selected: high / low, open / close, median or weighted from the candlestick prices.
For high / low, open / close, if the anchor point is above the candlestick, the upper price will be taken, below the candlestick - the lower one. If the point is inside the candlestick, then if the first point is higher than the second, then the first one goes up, the second goes down. Conversely, if the second is higher than the first
FREE

Imagine what results you could achieve in your manual trading if you had a tool that notifies you of a possible price reversal for all the symbols you are interested in at the same time (futures, stocks, forex or cryptocurrency)?
VSA screener is just the right tool. It was created for traders who value their time and make their own trading decisions on opening or closing a position. The software monitors the presence of trading patterns on the preselected tickers under several timeframes (up t
FREE

Buenas tardes. Hemos preparado un nuevo producto para comerciantes y analistas de mercado. Nuestro indicador VolumeSpreadtompson-creado para ver el impacto de los jugadores institucionales del mercado en el precio actual. El indicador muestra los niveles de variación del spread por unidad de tiempo en los valores que lo impulsan. La práctica muestra que el cambio en los volúmenes está asociado con la advertencia y la anticipación de la actividad especulativa, especialmente en momentos clave: not
FREE
Daily Drawdown Control is most easy and effective EA to protect your account from over Daily Drawndown limit of Prop Firm. - This EA is used for MT5 only. - Initial Balance is balance at the moment of Daily Drawdown limit reseted, it doen't care about floating profit/loss. - You just input Drawdown litmit percentage and resetting time. - If actual loss is over setting value, EA will close all positons and delete all orders immediately ( Reach DD : true)
FREE
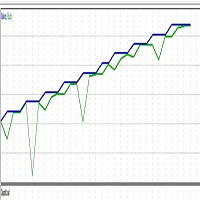
Trading is a skill where you can have your own skill and your own process. So, he advice that you try do what work for you. Trading is not a get rich quick scheme. when you stick to it long enough, it could change your live. Psychology and emotion is very important. Taking basic long and short trades automatically based on MACD and bear power. The robot is a test project by chrisdgenius aim to increasing profitablility.
FREE

The Commodity Channel Index computes the deviation of the typical price of each bar from the average price over a particular time period. Multiplying the median deviation by 0.015 facilitates normalization, which makes all deviations below the first standard deviation less than -100, and all deviations above the first standard deviation more than 100. This adaptive version is based on the indicator described by John Ehlers, in the book Rocket Science for traders. The indicator uses the homodyne
FREE

Please check the " What's new " tab regularly for a complete and up-to-date list of all improvements + parameters. FREE indicator for my trading utility Take a Break . This indicator allows you to manage multiple other EAs with just one Take a Break EA instance. Simply specify the corresponding Chart Group in the indicator(s) and Take a Break EA settings and you are good to go.
Setup example (Indicator + EA)
You want Take a Break to manage 3 other EAs: EA1 on EURUSD, EA2 on EURGBP, EA3 on G
FREE

Functional in the Forex market. Functional in the B3 market - Bolsa Brasil Balcão.
Motivation The technical Fibonacci retraction indicator for many is essential and the basis for all market movement forecasts. The name of the tool comes from the Italian mathematician Leonardo de Pisa (13th century).
This DEMO version will work in Meta Trader with Demo and Strategy Tester.
To purchase the Full version that works on a Real account, click on: https://www.mql5.com/en/market/product/38089
FREE

A professional tool for trading - the divergence indicator between the AO and the price, which allows you to receive a signal about a trend reversal in a timely manner or catch price pullback movements (depending on the settings). The indicator settings allow you to adjust the strength of the divergence due to the angle of the AO peaks and the percentage change in price, which makes it possible to fine-tune the signal strength. The indicator code is optimized and is tested very quickly as part
FREE

DoubleMACD DoubleMACD DoubleMACD DoubleMACD DoubleMACD DoubleMACD DoubleMACD DoubleMACD DoubleMACD DoubleMACD DoubleMACD DoubleMACD DoubleMACD DoubleMACD DoubleMACD DoubleMACD DoubleMACD DoubleMACD DoubleMACD DoubleMACD DoubleMACD DoubleMACD DoubleMACD DoubleMACD DoubleMACD DoubleMACD DoubleMACD DoubleMACD DoubleMACD DoubleMACD
FREE

The RSI (Relative Strength Index) scanner is a powerful technical analysis tool designed to help traders and investors identify potential trading opportunities in the forex, stocks, and cryptocurrency markets. RSI is a popular momentum oscillator that measures the speed and change of price movements and helps determine overbought or oversold conditions in an asset. The scanner takes advantage of this indicator to streamline the process of finding trading signals and opportunities. The RSI value
FREE

ProFactor is an indicator generating signals based price on the famous profit factor formula. The calculation is simply defined as gross GREEN BARS divided by gross RED BARS.
That's it in a nutshell, but sometimes the simplest things hold the most value.
So let's imagine your trading system's gross profit for the past year was $40,000 and your gross losses were $20,000. Your Profit Factor would be 2. The ProFactor calculation works on the price of the asset instead of the strategy out
FREE

Measures the average price and Maximum Stop Loss accepted, adjustable Measures too the projected average price (For Pending entrys), in case you have a open position and pending orders to scale in shows how much it will increase or decrease the average price after fullfilling that pending orders! It shows too the Stop Loss based on the projected average entry, how much it has to be stoped out to fullfill your risk management, after fullfilling that pending orders
FREE

you can close all your positions in profit or lost when you use this robot. 1.you set your max profit and max lost for all your positions. 2.the robot show you in a window beside your chart. 3.when your equity reach your target close all your positions. 4.you can use one of them or both (profit or lost)togather. 5.this robot close all your positions. ((if you have any idea or want somthing i can help you)) i hope you win in all your times of life. best regard
FREE

The Squeeze Index aims to measure the action of price being squeezed, and is expressed as a percentage, with higher values suggesting prices are subject to a higher degree of compression.
Settings
Convergence Factor: Convergence factor of exponential envelopes.
Length: Period of the indicator.
Usage
Prices being squeezed refer to the action of price being compressed within a tightening area. Prices in a tight area logically indicate a period of stationarity, price breaking out of
FREE

The tool is intended to help traders who cannot look at the chart all the time, or who use several charts, the trader can mark regions of interest as supports and resistances and as soon as the price approaches these regions an audible warning and on the screen will be presented for the trader to take some action, in addition the tool can automatically mark the highs and lows of the day and time.
FREE
The VR Orders History script is designed to upload a trade report to a csv file. This format is intended for additional analysis of trading history in programs such as EXCEL, Openoffice, and Libreoffice. Thanks to the script, it is now much easier for a trader to analyze their trading history. The program facilitates the analysis of the trading history for the MetaTrader 5 terminal. The trader sees structured trading. The entire report is based on the following principle: Position > Order on the
FREE

A unique professional tool is a divergence/convergence indicator between AC and price, which allows you to receive a signal about a trend reversal in a timely manner or catch price pullback movements (depending on the settings). It is indispensable for those who trade divergences manually or with an Expert Advisor. The indicator settings allow you to adjust the strength of the divergence /convergence due to the angle of the AC peaks and the percentage change in price, which makes it possible to
FREE

SSACD - Singular Spectrum Average Convergence/Divergence This is an analogue of the MACD indicator based on the Caterpillar-SSA ( Singular Spectrum Analysis ) method. Limited version of the SSACD Forecast indicator. Limitations include the set of parameters and their range.
Specificity of the method The Caterpillar-SSA is an effective method to handle non-stationary time series with unknown internal structure. The method allows to find the previously unknown periodicities of the series and mak
FREE
1. Торговая стратегия Что делает советник: Советник следит за некотоными индикаторами и при определенном условии (или условиях) помещать торговый запрос (на продажу или покупку) в зависимости от условий. Стратегия:
Используем индикатор Moving Average (скользящие средние) с периодом 8 (вы можете выбрать любой период, но в данной стратегии мы будем использовать период 8). Советник покупает, если 8-периодная скользящая средняя (далее для удобства будем называть ее MA-8) возрастает и текущая цена з
FREE

El volumen es un indicador muy utilizado en el análisis técnico, sin embargo, existe una variación que es incluso más útil que el volumen en sí: la media móvil del volumen.
No es más que un promedio móvil aplicado al popular indicador de volumen.
Como su nombre lo indica, Volume + MA sirve para mostrar el volumen de transacciones (compras y ventas ejecutadas) de un determinado activo financiero en un momento dado junto con la media móvil de ese mismo volumen a lo largo del tiempo.
¿Para q
FREE

¡Deje una calificación de 5 estrellas si le gusta esta herramienta gratuita! Muchas gracias :) La colección de asesores expertos "Asistente de gestión de riesgos" es un conjunto completo de herramientas diseñadas para mejorar las estrategias comerciales mediante la gestión eficaz del riesgo en diversas condiciones del mercado. Esta colección consta de tres componentes clave: asesores expertos en promedios, cambios y cobertura, cada uno de los cuales ofrece distintas ventajas adaptadas a diferen
FREE

SYMPHONY 8a , es un sistema avanzado de especulación desarrollado por 8aSistemas que utiliza algoritmos inteligentes de entrada/salida y gestión con métodos de filtrado sofisticados. Aquí no hay nada especial, no hay pruebas de los Santos Griales, solo un enfoque de negociación estricto basado en reglas, que permite maximizar el rendimiento mientras se tienen los riesgos bajo control.
Pares de divisas RECOMENDADOS: EURCAD PUEDE DESARROLLARSE EN CUALQUIER PAR DE DIVISAS SIEMPRE Y CUANDO SE OP
FREE
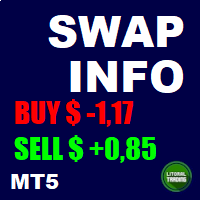
This is a script based tool that informs the swap from all the currency pairs (gold and silver too). It is possible to highlight pairs with a specific currency and whether the swap is positive or negative. In addition it is possible to complement the name of the symbols depending on the broker. The informations are showed in the Experts tab of the Toolbox (Ctrl+T). If you have any doubt or suggestion, please, contact us. Enjoy!
FREE

RSI Scanner, Multiple Symbols and Timeframes, Graphical User Interface An indicator that scans multiple symbols added from the market watch and timeframes and displays result in a graphical panel. Features: Multi symbol Multi timeframe Alerts and Notifications Live Monitoring Sorting modes One click to change symbol and timeframe Inputs for RSI and scanner settings
FREE

This indicator shows the strength of each currency compared to the US dollar by calculating the rate of change in price over a specified time period. When you open the indicator, you'll see a list of different currencies on the price chart. Each currency will have a numerical value indicating its strength level compared to the US dollar, where: If the value is higher than the US dollar, it will be displayed in green, meaning that currency is stronger than the dollar. If the value is lower than t
FREE

A simple indicator/tool to display the current timeframe in the center of the chart. The object is automatically moved to the center of the chart whenever the chart size is changed by the user.
Input Parameters :
Font (default is Arial Black) Font Size (default is 50) Font Color (default is Silver, for light theme graphics, change to black or another dark color) Font Transparency (default is 90%)
FREE

Convenient information line on the chart.
Displays the cost of the point depending on the selected volume (selection in the settings) Displays a swap of short and long trades depending on the selected volume. Shows a triple swap and indicates the day of the week on which it is charged Displays the current spread for the current instrument Displays the remaining time until the next bar on the current timeframe. In the settings you can choose the color, font size, placement and volume.
FREE

This indicator is a basic RSI but comes up with a useful feature.
You can set zones within the RSI and these zones can be displayed with different background colours. (You can see on the pictures below) You need to set the zone ranges and their colours at the input parameters. Six different zones can be set.
Should you have any questions or comments, feel free to contact me.
FREE

Posh Sessions is indicator which displays sessions in broker time or your local time. You can set up to 5 sessions, assign name, start time, end time and color of each session. There is session's range to help you make a chart analysis.
Settings for a session: Show: To show or not the session on chart Title: The title/name of the session Timezone: Select between broker or local time to implement the session's period Start time: The session start time End time: The session end time C
FREE

Es una utilidad para trabajar datos de ticks de Binance Futures en tiempo real y datos de ticks de Binance Spot en tiempo real. Está diseñado para extraer datos más rápido y mantenerse dentro de los límites de Binance Future.
Lógica de trabajo: Global Variables registra la información de tiempo que recibe de Binance Check Server Time.
En otros programas, hacen su trabajo de manera más rápida y eficiente utilizando esta información de tiempo.
Debe permitir WebRequest desde el menú Herr
FREE

The Average Cross System indicator is a versatile tool designed for traders using the MetaTrader 4 (MT4) platform. This indicator provides a straightforward yet effective way to identify potential buy and sell signals based on moving average crossovers, a widely used technical analysis strategy. Key Features: Moving Average Crossovers: The heart of the Average Cross System is the detection of moving average crossovers. It automatically identifies when a shorter-term moving average crosses above
FREE

This is a demo version of the Candle Absorption Full indicator. It has limitations on operation. This indicator detects the Engulfing candlestick pattern and draws the corresponding market entry signal.
Features It works only with EURUSD on timeframes M1 and M5. The indicator analyzes a combination of 2 or 3 candlesticks depending on settings. The number of pre-calculated bars (signals) is configurable. The indicator can send an alert to notify of a found signal. Signal can be filtered by sett
FREE

La clave del éxito siempre es una buena optimización. El sistema cuenta con una serie de variables y en este caso su simplicidad es la clave de su éxito. El sistema busca los distintos "Gaps" como fallos de entrada en el mercado y después los depura a través de una serie de medias Moviles para decidir si debe entrar o no lo hace. Es un sistema simple pero potente. Las variables son las siguientes: Lot: Define el tamaño del lote. TakeProfit: Define el take profit en Pips Stop Loss: Define el sto
FREE
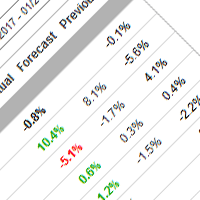
This script downloads economic news data, required for Economic news calendar with history indicator. It downloads data from fxstreet.com to Common folder of MT5 in CSV format. How to use it (watch video below on how to test demo version): Add http://calendar.fxstreet.com/eventdate / to Allowed URLs section in MT5 settings Download and Install script and indicator from mql5.com Open chart with required currency pair Find script in Navigator panel and drag&drop it to the chart. Find correspond
FREE

Utility for order reversal. Closes orders on the chart on which it is launched and opens orders with the opposite direction instead of them. Has a simple and intuitive graphical interface. It is also possible to automatically reverse newly opened orders. MT4 version of the utility- https://www.mql5.com/en/market/product/74771 If you like this utility, take a look at my other products - https://www.mql5.com/en/users/nina_yermolenko/seller
FREE
MetaTrader Market - robots comerciales e indicadores técnicos para los trádres, disponibles directamente en el terminal.
El sistema de pago MQL5.community ha sido desarrollado para los Servicios de la plataforma MetaTrader y está disponible automáticamente para todos los usuarios registrados en el sitio web MQL5.com. Puede depositar y retirar el dinero a través de WebMoney, PayPal y tarjetas bancarias.
Está perdiendo oportunidades comerciales:
- Aplicaciones de trading gratuitas
- 8 000+ señales para copiar
- Noticias económicas para analizar los mercados financieros
Registro
Entrada
Si no tiene cuenta de usuario, regístrese
Para iniciar sesión y usar el sitio web MQL5.com es necesario permitir el uso de Сookies.
Por favor, active este ajuste en su navegador, de lo contrario, no podrá iniciar sesión.