Robots comerciales e indicadores gratis para MetaTrader 5 - 26

El saldo inicial (IB) es un rango en el que el precio pasó sus dos primeros periodos OPT tras la apertura. En otras palabras, el saldo inicial es un rango de la primera hora tras la apertura del mercado. El saldo inicial surgió de la negociación en sala, ya que los operadores de sala observaban los distintos rangos tras la apertura del mercado.
Este indicador le permite introducir las horas y minutos iniciales y finales de un rango horario específico tiempo para que el trader pueda configurar
FREE

This EA created for GBPUSD on H1. The strategy is a martingale. It has been back tested since 2015-01-01 till now on ICMarkets raw account. The minimum deposit is $1,000 and maximum should not be over $10,000 because its a Martingale. Recommended account is ECN or Raw. its a scalp EA so for sure the spread would be matter. Lot Size built up with percentage (%) that means it calculated according Stop Los and percent of deposit.
FREE
SaTo EA simple for free. 1. Double MA indicator for Entry signal 2. RSI for trend filter (Uptrend: RSI value greater than RSI level, Downtrend: RSI value less than RSI level ) 3. MACD for trend filter (Uptrend: MACD greater than signal , Downtrend: MACD less signal ) Buy signal : Fast MA greater than Slow MA, RSI value greater than RSI level, MACD greater than signal Sell signal : Fast MA less than Slow MA, RSI value less than RSI level, MACD less signal
FREE

这是一个组合指标分析趋势、支撑阻力、买卖点。运用了均线MA、布林带、KDJ、CCI、RSI。 主图上下线是布林带上下线,采用的是20周期和2.3标准差可以用来支撑阻力。 中间的是分析趋势的均线,趋势分析是用均线多周期: 为涨趋势,反之为下跌趋势。在同一种颜色,基本说明趋势没有发生变化。 子图是由 KDJ、CCI、RSI三个指标组成,大于70超买,小于30超卖, 智能提示是运用了算法,主要计算布林带, KDJ、CCI、RSI指标
有三个或四个指标超出市场常态就会发出提示行情可能反转。 子图指标运用了很多数据,刚刚开始加载会有点慢,耐心等待就可以 这个指标是主图指标,还要再下我发布的RCD分析,这样就刚刚好组成一套分析 电脑分辨率的文本大小请设置100%,不然字体会不一样
FREE

NOW FREE!! It's crucial to note that, like any trading tool, ForexClimber EA doesn't guarantee profits. Forex trading carries risks, and market volatility means success is never certain. The pricing of ForexClimber EA is dynamic, and as it gains popularity, the cost for renting or buying may increase. Invest now to secure your place in Forex trading advancement. Seize the opportunity, navigate the markets, and let ForexClimber EA support your Forex trading aspirations.
FREE

Transaction Data Analysis Assistant: This is a statistical analysis tool for transaction data, and there are many data charts for analysis and reference. language: Support language selection switch (currently supports Chinese and English active recognition without manual selection) The main window shows: Balance display Total profit and loss display Now the position profit and loss amount is displayed Now the position profit and loss ratio is displayed The total order volume, total lot size, and
FREE

PANEL OF TOPOS AND HISTORICAL BACKGROUNDS This is a panel that does not open orders only manages all Symbols and calculates the tops and bottoms and presents the calculation in relation to the top and bottom in 5 Years, 2 Months and 1 Week.
It is ideal for filtering the pairs that are in the good regions to operate. You can filter the range and choose whether to consider the body or shadow of the candle in the monthly. Good luck...
FREE

The DJ_M5_810504785_L_OD_CF_1522_SQX is an algorithmic trading strategy for MetaTrader, tested on DJ using the M5 timeframe from December 7, 2017, to June 2, 2023. There is no need to set up parameters, all settings are already optimized and fine-tuned.
Recommended broker RoboForex because of EET timezone.
You can find the strategy source code for StrategyQuant at the link: http://quantmonitor.net/listing/dow-jones-bollinger-master/
Key details are:
MagicNumber: 810504785 Main Chart
FREE

ACCOUNT FLIPPER EA A trading bot for GBPUSD Lot size is calculated by multiplying the lot factor by each 1000 USD on account. Advisable to use account sizes of USD 1000 and above. Account types: Hedge accounts, Standard accounts are preferred i.e. no commissions, Use well regulated brokers eg ICMarkets. all this provides room for the strategy to work smoothly for stabilized results and removing the possibility of the model crashing. ADJUST The Time settings to your own time zone because the
FREE

Что такое OsMA DA? Индикатор OsMA DA – это осциллятор, который построен на показаниях другого осциллятора – MACD. OsMA DA показывает расхождение между сигнальной линией MACD и его гистограммой. Момент пересечения гистограммы и линии – это нулевая отметка OsMA. Если гистограмма MACD поднимается выше линии, то гистограмма самого OsMA DA поднимается выше нулевой отметки. В обратной ситуации OsMA DA демонстрирует отрицательные значения. OsMA DA более узконаправленный индикатор, чем MACD. OsMA
FREE

Simple Trading Panel is a manual tool for safe trading. Monitored by the mentor and indicators. This panel has many useful settings to take your trading to the next level.
Simple Trading Panel offers features:
Adjustable stop loss, take profit, volume, trailing stop with profit in percent, risk ratio, news filter and much more. Test results Simple Trading Panel does not work in the strategy tester!
Recommend Account type: Hedging, Zero, Micro, Standard, Premium or ECN Brocker with low spr
FREE

Bill's Williams Awesome Oscillator signal from his book "Trading chaos 2nd edition" on bars. Normally this signal is being used for 2nd entry after 1st entry by Divergent bar ----------------------------------------------------------------------------------------------------------- Please make shure that you understand Bill's Williams system before trade with real money using this indicator. Ideal entry setup is: 1) Divergence with zero line AO crossing 2) Divergent bar on top of the final 5th
FREE

Pivot Points are used by Forex traders to find support and resistance levels based on the previous day's price action. There are various ways to calculate pivot points, including averaging the open, high, low, and close of the previous day's chart price.
Forex Traders use a combination of pivot points with moving averages to find trading opportunities in the currency markets.
Pivot points are very useful tools that use the previous bars' highs, lows and closings to project support and re
FREE

To download MT4 version please click here . - This is vortex indicator. - It is used to detect trend strength and direction. - It consists of two line(buffers). ==> VIM and VIP - There are three types of signals related to this indicator: 1. crossing VIM and VIP 2. threshold on distance between VIP and VIM 3. VIP above VIM vice versa. - This is a non-repaint indicator with light processing.
FREE
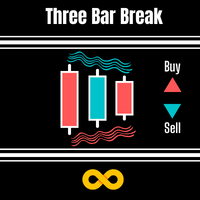
DESCRIPTION 3 Bar Break is based on one of Linda Bradford Raschke's trading methods that I have noticed is good at spotting potential future price volatility. It looks for when the previous bar's High is less than the 3rd bar's High as well as the previous bar's Low to be higher than the 3rd bar's Low. It then predicts the market might breakout to new levels within 2-3 of the next coming bars. Must also be traded during the active hours of the market you want to trade. EG EURUSD 7am - 5pm This
FREE

Este script está diseñado para traders que necesitan ejecutar operaciones rápidas en múltiples pares de divisas durante anuncios económicos clave, donde cada segundo cuenta. Con esta herramienta, puedes preseleccionar los pares de divisas que deseas y asignar un volumen independiente para cada uno. Cuando se publica una noticia importante, como los datos de Nóminas No Agrícolas (NFP) o PMI, el script te permite ejecutar todas tus operaciones de manera instantánea, sin tener que abrir cada par ma
FREE

Normal Parabolic SAR with label of long or short state. Tells also "Parabolic long" and "short". Can be used in multitimeframe layouts together with Swiss HolyGrail indicator or in different timeframes. So, if all the indicators show "long" or "short" you can be sure that the risk of a wrong direction is small. The standard values for Parabolic SAR are 0.02 for step and 0.2 for maximum. You may experiment with changing the maximum to get smother curves. Note that changes in parabolic SAR are la
FREE

This is a trading EA on M1 Chart for currency pair GBPUSD. I don't recommend you to use in other charts or currency pairs. Backtests are performed at mt5 and my Broker is FxPro. "Works On M1 Chart"; // GBPUSD Strategy Properties Parameters are, LessOrderMoreProfitFactor_Flag = false; // Less Order More Profit Factor (trade is very rare but profit factor is high Entry_Amount = 0.01; // __Amount for a new position [lot] Take_Profit = 800; // __Take Profit [point] Stop_Loss = 650; // __Stop L
FREE

El asesor se desarrolló de acuerdo con la estrategia 2TF para EURUSD y GBPUSD.
Indicadores utilizados: EMA (5), EMA (10), ADX (28), MACD (5; 10; 4).
Reglas para órdenes de compra
EMA (Rápido) cruzó EMA (Lento) de abajo hacia arriba.
ADX + DI (azul) arriba –DI (rojo).
MACD está por encima de cero.
Reglas para órdenes de venta
EMA (Rápido) cruzó EMA (Lento) de arriba a abajo.
ADX + DI (azul) debajo de –DI (rojo).
MACD está por debajo de cero.
En los parámetros del ases
FREE

Технический индикатор Trend Moving Average позволяет определить глобальное направление рынка. Данный технический индикатор создан для того, чтобы определить «линию наименьшего сопротивления» рынка и понять в какую сторону направлен тренд. Помимо классического использования МА, индикатор позволяет понять направленность рынка на основе динамики его значений. Так, если значение индикатора демонстрируют переход с нисходящего значения в восходящее (и наоборот) - это является дополнительным торговым с
FREE

El indicador técnico conocido como Líneas de Tendencia Perfecta . Este indicador es una herramienta valiosa en el análisis técnico y se utiliza para mejorar la toma de decisiones en el trading. Aquí tienes una descripción paso a paso de cómo funciona y cómo puede ser utilizado por los traders: Identificación de Tendencias : Las líneas de tendencia perfecta se dibujan conectando dos o más puntos de precio en un gráfico, revelando así la dirección general del mercado. Una línea ascendente indica
FREE

The "YK-LOT-SIZE" is a custom indicator for MetaTrader 5 (MT5) that displays the total lot sizes and profits for both buy and sell positions on the current chart. Key features of the indicator: It calculates the total lot sizes for all open buy and sell positions of the current symbol. It calculates the total profits (including commissions and swaps) for all open buy and sell positions. The indicator displays the information on the chart using two lines of text: "BUY Lots: [total buy lots] | BUY
FREE

El indicador se puede utilizar para el comercio de correlación dxy.
calcula el índice del dólar (USDX o DXY) utilizando los pares de divisas XAU/USD, EUR/USD, USD/JPY, GBP/USD, USD/CAD, USD/CHF y USD/SEK.
Para operar con ellos, debe encontrar un patrón de análisis técnico confirmado en el gráfico DXY y buscar un par de divisas correlacionado que tenga la misma imagen en su gráfico de precios.
FREE

This indicator get all events/countries/values from metatrader terminal calendar and print veritical lines at chart, you can configure anything with inputs (string to filter names/url/code/countries/currencies), select period to filter, nws interval before and after current time (every information about time is seconds based), you can filter importance, type, sector, unit, multiplier, impact, timemode, frequency, forecast/previous % increase/decrease interval, actual/previous % increase/decrease
FREE

Combining the best of Price Action , Directional Movement , and Divergence / Convergence analysis, the Candle Color Trend is the easy and reliable way to identify the direction of the trend. The indicator automatically paints the candles according to the premise that the upward trend is defined by prices that form a series of ascending tops and bottoms. On the other hand, the downward trend is defined by prices that form a series of descending tops and bottoms.
Color Trend is certainly one
FREE

This indicator provides common shapes as drawing object options. The shapes are rotatable, resizable, draggable, and will keep their proportions (according to their handle trendline) across different chart scales. Multiple drawings are supported.
Shapes: Square Rhombus
Triangle (quadrilateral & isosceles) Circle (grid, overlapped grid, flexi grid, rotatable grid, concentric circles) Features: rays (all object edges will be rays) show/hide each individual drawing type, or all delete last drawn
FREE

Visualize seu histórico de negociações de forma estruturada e detalhada, com taxas de acertos e lucro separados por dia, semana, mês e total, além de detalhes sobre o ativo, horário do servidor e posições/ordens em andamento. Este painel foi criado visando o uso em contas do tipo HEDGE, porém pode ser utilizado em contas do tipo NETTING sem nenhum problema. Na versão PREMIUM deste Painel você tem opção de utilizar uma micro boleta com botões para facilitar o tratamento e execução de ordens em an
FREE
Tick Chart Monitor with countdown tick volume and easy to change tick size without going back to main chart. This work with Tick Chart Generator , which are available for download from the MQL5 Market: Tick chart generator: https://www.mql5.com/en/market/product/79763 NOTE: Custom symbols on MT5 are not directly tradable. This is by Metatrader5 design. If you want to place trades directly on the custom symbol generated by this product, you will either need a trade panel that offers this functi
FREE

This indicator displays the spread with extra options Simple and easy to use and fully customisable: View as Pips or Pipettes Chart symbol can be hidden Text display can be changed Change colour and text styles Add or hide a decimal point Spacing options between inputs Default screen positions Screen position inputs
Pro version includes: Drag and drop box on the screen Add an alert when the spread is too high Alert colours for text and text box changeable
How to use 1. Simply use the defaul
FREE

SterlingSniperBot: Precision in GBP/USD Trading SterlingSniperBot es un algoritmo avanzado diseñado meticulosamente para el par de divisas GBP/USD, específicamente adaptado para operar en barras de 4 horas y sincronizarse sin inconvenientes con corredores en la zona horaria UTC+2. Este sofisticado bot destaca como un instrumento de precisión en el mundo del trading de divisas. Características Clave: Optimización de Marco Temporal: Operando exclusivamente en barras de 4 horas, SterlingSniperBot s
FREE

A flexible BB indicator You're no longer limited to the built in default of using BB off a SMA method, now you can choose from: SMA - SMMA - EMA - LWMA - ADAPTIVE - FRACTAL ADAPTIVE - DEMA - TEMA - VARIABLE INDEX DYNAMIC
You now also have 2 standard deviation levels. A more featured version is available with 5 deviation levels, color gradients to lines and filling as well as candles, with full alerts too: Bollinger Bands Max MT5
Options: - MTF - 9 choices of MA to base the BB off
- 2 adjust
FREE

This is a utility panel to assist closing of open Deals. The panel has input filters to assist one select the right trades. The tool displays the number of trades to be closed as well as profits to be realized. One click close, Filter trades to be closed by: symbol, (Filter by a particular symbol in the trade terminal). magic number (If your orders are from particular EA with unique magic numbers). whether in profit, loss or All. (P/L=all trades, profiting = trades in profit, loosing = trades
FREE

Live Monitoring: https://www.mql5.com/en/signals/2252642 Quant ML US30 is a bot designed for Dow Jones index-related instruments, operating on the H1 timeframe. It supports: .US30Cash CFD YMMxx, YMUxx futures Any instrument with an underlying Dow Jones Industrial Average index (exact names may vary by broker). This bot is generated and validated by machine learning algorithms, focusing on strategy stability. It: Uses only market entries with fixed ATR-based SL and TP levels. Does not use tr
FREE

TickAll - Automated Trading Robot
Introduction: TickAll is an automated trading robot designed to assist both novice traders and professional traders in the Forex market. Utilizing advanced algorithms and up-to-date market analysis, TickAll helps you make the best trading decisions. Market Analysis: TickAll continuously monitors the market, analyzing various indicators, price movements, and patterns to identify potential trading opportunities. Trend Identification: Using so
FREE

Indicator that show candlestick bars with an different sampling method than time fixed. Real time data is sourced to the indicator and it may be used as substitute of the default graph. Each bar is formed when a predefined volume of assets was dealt, showing in the graph the OHLC of this clustering. The amount of bars is proportional to the amount of negotiations instead of a sample in a fixed amount of time. If the broker doesn't show the real volume of the trades, this indicator won't work. Th
FREE

This script allows performing a walk-forward analysis of trading experts based on the data collected by the WalkForwardLight MT5 library. The script builds a cluster walk forward report and rolling walk forward reports that refine it, in the form of a single HTML page. This script is optional, as the library automatically generates the report immediate after the optimization in the tester is complete. However, the script is convenient because it allows using the same collected data to rebuild th
FREE

Análisis de deslizamiento diseñado para operaciones de alta precisión y para todo el mercado Funciona tanto en cuentas reales como demo y le permite analizar todas sus posiciones con take profit y stop loss, para que pueda analizar el deslizamiento de su corredor.
¿Qué es el deslizamiento en el comercio? El deslizamiento o deslizamiento es la diferencia de precio que puede ocurrir entre el momento en que se coloca una orden comercial y su ejecución real en el mercado.
Esto se debe a que des
FREE

Donchian通道(唐奇安通道指标)是用于交易突破的最古老、最简单的技术指标之一。 一般来说,唐奇安通道的宽度越宽,市场波动就越大,而唐奇安通道越窄,市场波动性也就越小 。此外,价格走势可以穿过布林带,但你看不到唐奇安通道的这种特征,因为其波段正在测量特定时期的最高价和最低价。 交易实用必备工具指标 波浪自动计算指标,通道趋势交易 完美的趋势-波浪自动计算通道计算 , MT4版本 完美的趋势-波浪自动计算通道计算 , MT5版本 本地跟单复制交易 Easy And Fast Copy , MT4版本 Easy And Fast Copy , MT5版本 本地跟单复制交易 模拟试用 Easy And Fast Copy , MT4 模拟账号运行 Easy And Fast Copy , MT5 模拟账号运行 唐奇安通道指标计算: 唐奇安上阻力线 - 由过去N天的当日最高价的最大值形成。 唐奇安下支撑线 - 由过去N天的当日最低价的最小值形成。 中心线 - (上线 + 下线)/ 2 唐奇安通道信号 唐奇安通道常用作突破指标。它提供了两种主要类型的突破信号,一个是上阻力线或下支
FREE
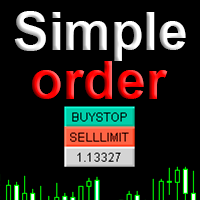
Simple order is designed to make placing pending orders as easy and fast as possible. Setting a pending order takes just two steps. 1. Double-click on the price of placing an order, after that a panel with buttons for order names appears. 2. Click on the button of the required order That's it, the pending order is set. If necessary, we adjust the order by dragging, as well as change the sizes of stop loss and take profit. Don't forget to pre-set the size of the stop loss and take profit in the S
FREE

For those who feel that regular RSI is too fast and too noisy to be used on regular trades or in EAs and want to have an alternative to meter the Momentum of the Price, here is a solution presented on the great article of the Technical Analysis of Stocks & Commodities magazine (April, 2015), by Vitali Apirine, called: Slow Relative Strenght Index . Its reading is almost the same as the regular RSI, but its levels of Overbought and Oversold are 80 and 20 instead. SRSI is very powerful to show div
FREE
Reverse TradeCopier for Followers can copy trades from an account that is running Reverse TradeCopier for Source . Features: Copies trades from one source (master) account to multiple following (slave) accounts. Allow investor (read only) password for source (master) account. There are no complicated settings and input parameters, everything is easy. Works with different brokers. Works with different quotes symbols (EURUSD_FX, eurusd_m, etc.). Can copy orders from 4-digit quotes platform to 5-
FREE

You probably heard about Candlesticks behaviors, which in most of the times could denote and trace Volume behaviors even if you are not watching Volume itself... Well, this indicator will do this. Naked traders love to rely solely on candlesticks patterns and with Candle Zones you can trap special patterns and DRAW THEM on your chart. As simple as that. There are several filters you can tweak in order to achieve the analysis you want. Just give it a try. After several months of testing, we think
FREE

The Expert Advisor tool has been developed for Nasdaq, based on Vortex and pending orders. The stop loss is based on fixed pips. It has been backtested on more than 10-year long M1 data with high quality of modeling. The enclosed screenshots demonstrate the complexity and coverage of the test by Monte Carlo analysis with 200 simulations. T he Expert Advisor passed via Cluster Analysis, Optimization profile, System parameter Permutation. There is no need to set up parameters - all settings are al
FREE

Investment Castle Volatility Index has the following features: 1. This indicator shows the volumes of the current symbol and the market volatility. 2. This indicator is built-in in the Investment Castle EA which works as volatility index for the EA dynamic distance and opposite start. 3. Parameters available for optimization for each pairs. 4. Works with any chart.
FREE

Description The Profit and Loss Indicator by Creative Tech Solutions is a robust and comprehensive tool designed to help traders monitor their trading performance in real-time. This indicator provides detailed metrics on profits and drawdowns, ensuring traders are always informed about their trading activities and performance. With customisable alerts and display settings, this indicator is an essential tool for any serious trader. Features Real-Time Metrics : Monitor profit and drawdown percent
FREE

Free version. Only works on EURUSD Do you want to always know in a quick glance where price is going? Are you tired of looking back and forth between different timeframes to understand that? This indicator might just be what you were looking for. Trend Signal Multitimeframe shows you if the current price is higher or lower than N. candles ago, on the various timeframes. It also displays how many pips higher or lower current price is compared to N. candles ago. Number N. is customizable The data
FREE

Помощник для торговой системы SystZ . Чертит трендовые линии по соседним экстремумам зигзага. Условие для линии сопротивления - правый должен быть ниже левого. Для линии поддержки - правый выше левого. Не допускается, чтобы между экстремумами, по которым проводится трендовая линии были другие. Экстремумы, удовлетворяющие этим условиям, отмечены символом фрактала. Закрытие свечи за линией - сигнал для открытия позиции.
FREE

The DD_PL Running MT5 indicator is a trading tool developed by the Dagangduit Core Team . This indicator is designed to display real-time running profit and loss (P/L), providing essential information about your trading account's performance. Key Features: Real-Time P/L Monitoring : Calculates and displays profit and loss in real-time. Visual Indicator : Uses labels and colors to provide a visual representation of profit and loss status. Customizable Display : Allows adjustment of text color, b
FREE

ПОСМОТРИТЕ НАШ НОВЫЙ СОВЕТНИК : : https://www.mql5.com/ru/market/product/95095?source=Unknown#description
Индикатор отображает свечи заданного старшего таймфрейма, на меньших таймфреймах TF_Bar - выбор старшего таймфрейма, на основе которого будут отображаться свечи на текущем; Number_of_Bars - предельное число баров, до которого будет производиться расчет индикатора; Color_Up - цветовое отображение бычьих свечей; Color_Down - цветовое отображение медвежьих свечей; Widht_lines - то
FREE

A script for closing positions If you need to quickly close several positions, this script will make all the routine for you! The script does not have any input parameters. Allow AutoTrading before running the script. Usage:
Run the script on a chart. If you need to specify the maximal deviation and the number of attempts to close positions, use the script with input parameters https://www.mql5.com/en/market/product/625 You can download MetaTrader 4 version here: https://www.mql5.com/en/market
FREE
Traders Club Clock for MT5 Readme
ローソク足のすぐ横にその時間足での 残り時間とスプレッドを表示します。 ※残り時間はサーバ時間から計算しています。 月足、週足、日足、4時間足、1時間足、30分足、15分足、5分足、1分足
で表示可能となっております。
※スプレッド値ポイント単位での表示になります。
※時間の更新はティック毎ではなく1秒 毎 に更新するようにしています。
一目で残り時間とスプレッドを確認できます。 機能: 使用しているフォント種類を変更できます。 使用しているフォントサイズを変更できます。 表示しているテキストの色を変更できます。 スプレッド表示を非表示にすることができます。 表示する位置を変更することが出来ます。
FREE

Tokyo Session Box Indicator : Draw a box of Tokyo session. Inputs tutorial: 1. Automatic: true/false. To calculate box automatic base GMT. 2. Broker time zone: if Automatic is False, you have to define broker time zone (ex: 2 ) 3. Button ON/OFF properties: x, y, corner, color, background fill, width, height, font name, font size. This button will toggle showing or hiding Tokyo session box.
FREE

Volume Cross Over is an indicator that measure positive and negative volume flow in a financial instrument, such as a stock, commodity, or index. It is base on the idea of On-Balance Volume developed by Joseph Granville. However instead of trending lines, this indicator shows volume cross over. When the closing price of an asset is higher than the previous closing price, then the Bull volume is greater than zero and Bear volume is negative. It suggests that buying volume is dominating, and
FREE

'Circle Rising Point' is an indicator based on the cycle theory. No matter whether your trading cycle is short or long, you can use this indicator to find the rise and fall points of different cycles and different bands. Therefore, the signals displayed to you on charts of different cycles are different, and applicable to left side transactions. This indicator is recommended to be used together with the multi cycle window for analysis. Indicator introduction Applicable products This indicator is
FREE

The Moving Averages On-Off let you control the indicator using the keyboard or a button . You can choose if you want the indicator always shown or always hided while switching among different time frames or financial instruments . ---> This indicator is part of Combo Indicator OnOff
It's possible to setup three Moving Averages : Short , Medium , Long
Input You can customize the price type used for calculation : close, open, high, low, median price, typical price, weighted It
FREE

Indicador para marcar el máximo y el mínimo del día , con actualización momentánea, cierre del día anterior y comienzo del día . Es posible definir qué marcas se realizarán y también los colores para cada marca. Los valores de cada marca se muestran en la esquina superior izquierda de la pantalla, debajo del panel de negociación dentro del gráfico. Máximo y mínimo del día y cierre del día anterior están marcados con una línea horizontal, mientras que el comienzo del día con una lí
FREE

The indicator draws a normal chart by coloring it in colors based on prices calculated by the Heiken Ashi indicator algorithm.
That is, the shape of the candles does not change.
In fact, this is the same Heiken Ashi that does not distort the price chart.
Then there will be a drawing of a cat, because there is nothing more to write about the indicator. .
FREE

Controla tus exámenes de fondeo con Raba Challenge Manager EA (FTMO, Rocket21, etc...). Funciones: Cierra operaciones al llegar al beneficio deseado. Cierra operaciones antes de llegar al drawdown máximo diario. Cierra operaciones antes de llegar al drawdown máximo. Notas: Activar/desactivar automáticamente el trading algorítmico está desactivado porque las políticas de MQL Market no lo permiten.
Cualquier duda me la puedes dejar en comentarios y te la responderé con la mayor brevedad posible.
FREE

(traducción de Google) Este indicador implementa el " Promedio Verdadero Rango (ATR) " desarrollado por John Welles Wilder Jr. , como se describe en su libro: Nuevos conceptos en sistemas técnicos de comercio [1978] . Utiliza el promedio móvil de Wilder , también conocido como promedio móvil suavizado (SMMA) , en lugar de un promedio móvil simple (SMA) como se usa en el indicador ATR incorporado de MetaTrader . El período predeterminado aplicado es 7, en lugar de 14, según la descripción en su l
FREE

Live Monitoring: https://www.mql5.com/en/signals/2252642 Quant ML US100 is a bot designed for NASDAQ index-related instruments, operating on the H1 timeframe. It supports: .USTECHCash CFD NQMxx futures Any instrument with an underlying NASDAQ index (exact names may vary by broker). This bot is generated and validated by machine learning algorithms, focusing on strategy stability. It: Uses only market entries with fixed ATR-based SL and TP levels. Does not use trailing stops, breakevens, mar
FREE

The 4xtradingllc Panel allows you to enter sells and buys in a quick manner as well as close all trades at once. The panel also has a account protector that will close all trades once the protector has been hit.
You can attached this utility to most indicators and combine the two to have your indicator fully functioning as well as the panel to buy sell and close trades quickly and protect the account from losing X percentage.
MAKE SURE TO JOIN OUR DISCORD SERVER FOR FULL TRAININGS. DISCORD
FREE

There are thousands, if not millions, of strategies on the internet, but only less than 10% work and of those even less have stood the test of time. Very few strategies have successfully weathered the 2008-2009 financial crisis, 2020 covid effects on the markets and all other unforeseen events that have affected the market in the last 2 decades. That being said, the strategy I feature in this episode does just that, the epitome of stability as I’ll show in a 20 year back-test.
The source of
FREE
The Tick Flow Meter, also known as Tick Density Meter or Tick Counter, is an innovative indicator designed to provide deep insights into market dynamics down to the second.
It is a cutting-edge indicator crafted to measure the intensity and frequency of ticks within specific time intervals. By focusing on tick flow, this indicator offers traders a unique perspective on market liquidity, momentum, and volatility, empowering them to make informed trading decisions.
Key Features: Granular Tim
FREE

A countdown timer for the Volume bar chart generator and Tick chart generator products, which are available for download from the MQL5 Market: Tick chart generator: https://www.mql5.com/en/market/product/29215 Volume bar chart generator: https://www.mql5.com/en/market/product/47197
The counter conveniently displays the number of ticks or transactions (depending on the chart) that need to pass for a new bar to start printing.
The user can set the following indicator inputs.
Volume type
FREE

El indicador DuettoFXTompson está diseñado para trabajar con dos instrumentos que tienen un alto nivel de correlación, el indicador se puede utilizar para el comercio de pares de divisas, acciones, etc. instrumentos financieros. El indicador muestra el momento de la divergencia de los instrumentos y la suma de los dos instrumentos ( línea amarilla), además se calcula el parámetro del valor promedio de MA Marco de tiempo recomendado para el trabajo M5. Contactos para la comunicación 777basil@mail
FREE

Multi-timeframe trend indicator based on the ADX / ADXWilder indicator with Fibonacci levels
The indicator shows trend areas using ADX or ADXWilder indicator data from multiple timeframes. The impulse mode of the indicator allows you to catch the beginning of a trend, and several "Screens" with different timeframes allow you to filter out market noise. Fibonacci levels are added to the price chart, which have flexible settings.
How the indicator works: if PDI is greater than NDI, then it`
FREE

Expert using Moving Average (Configurable), RSI entry points and Bollinger Bands (not configurable [yet]).
You can decide if you want to use the Moving Average with or without Bollinger Bands and you can turn on/off the RSI also for entry/exit points.
You can also turn on/off the Double Hand Feature where every entry/exit the trade will be in double, which means, selling and buying at the same time.
FREE

Una barra de inclinación de Bill Williams con angulación. Se utiliza como ángulo el ángulo entre la línea verde y la parte superior/inferior de la barra, que en principio sigue las pautas actualizadas de Justin Williams. La configuración predeterminada del ángulo de 85 y 21 Bar desde el momento en que cruza la línea de Labios de Cocodrilo funciona bastante bien. Si usa este indicador en el comercio real, no recomiendo encarecidamente el comercio dentro del día, use gráficos diarios.
La señal
FREE

This indicator draws a price area in which the volume percentage was traded the day before. The chart shows the days with vertical lines and two horizontal lines to indicate the upper price and the lower price of the percentage of volume was traded the day before. The upper/lower lines start and end with the day calculated. But they are referred with the values of the day before. NOT the day in which are. With this indicator you can see where the volume moved in the day before. It uses percenti
FREE

When prices breakout resistance levels are combined with momentum oscillator breaks out its historical resistance levels then probability emerges to record farther higher prices. It's strongly encouraged to confirm price breakout with oscillator breakout since they have comparable effects to price breaking support and resistance levels; certainly short trades will have the same perception. Concept is based on find swing levels which based on number of bars by each side to confirm peak or trough
FREE
MetaTrader Market ofrece a todos los desarrollador de programas de trading una sencilla y cómoda plataforma para ponerlos a la venta.
Le ayudaremos con la presentación y explicaremos cómo preparar la descripción de su producto para el Market. Todos los programas que se venden a través del Market están protegidos por una codificación adicional y pueden ser iniciados sólo en el ordenador del comprador. La copia ilegal es imposible.
Está perdiendo oportunidades comerciales:
- Aplicaciones de trading gratuitas
- 8 000+ señales para copiar
- Noticias económicas para analizar los mercados financieros
Registro
Entrada
Si no tiene cuenta de usuario, regístrese
Para iniciar sesión y usar el sitio web MQL5.com es necesario permitir el uso de Сookies.
Por favor, active este ajuste en su navegador, de lo contrario, no podrá iniciar sesión.