Robots comerciales e indicadores de pago para MetaTrader 4 - 166
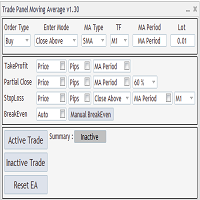
Expert Advisor to Automatically Trade Moving Averages price breakouts & retests . Complete trading solution with automated Entry , Take Profit , partial profit , Stoploss and also auto breakeven where SL is moved to Entry once tp1 / first target is reached ,
Moving averages are used to identify trends and confirm reversals , They are effective in all time frames . from 1 min scalping to 4hr or Daily charts swings , With MA Trade Panel EA we can automatically buy / sell when price breaks

The Robot Ea with Indicators ALLIGATOR.
ONLY 2 COPIES OUT OF 5 LEFT AT $ 99! After that, the price will be raised to $ 199.
LIVE SIGNAL and EA STRATEGY ⤵⤵⤵ https://www.mql5.com/en/users/supomo/seller#products
PARAMETER SETTING EA ⤵⤵⤵ https://www.mql5.com/en/blogs/post/744860
PARAMETERS SETTING EA ALLIGATOR VERSION:
(::), AlliggatorMODE = 2; // 0=SMA,1=EMA,2=SSMA,3=LWMA --> jaw_period=13; --> jaw_shift=8; --> teeth_period=8; --> teeth_shift=5; --> lips_perio

FXC iDeM-DivergencE MT4 Indicator
This is an advanced DeMarker indicator that finds trend-turn divergences on the current symbol. The indicator detects divergence between the DeMarker and the price movements as a strong trend-turn pattern.
Main features: Advanced divergence settings
Price based on Close, Open or High/Low prices Give Buy/Sell open signals PUSH notifications
E-mail sending Pop-up alert Customizeable Information panel Input parameters: DeM Period: The Period size of the DeMarker in
Telegram BreakOut Ichimoku Telegram BrealOut Ichimoku PRO The Expert Advisor will help you forward all alert from MetaTrader 4 to Telegram channel
Parameters Channel Name - Name of your channel Token - create bot on Telegram and get token. AlertonTelegram - true to activate AlertonMobile - true to activate AlertonEmail - true to activate Customize moku Setting (Pro Version) Customize Comment (Pro Version) Add Customizable Signal Name(Pro Version)
FOR TRY YOU CAN DOWNLOAD LITE VERSION

Anticorona is a trading Expert Advisor that works on the H1 timeframe. The advisor's settings are based on a safe trading strategy, the essence of which is to close a deal, upon reaching a positive dynamism of profitability of several points, which allows the user to reduce the costs of opening unprofitable deals. The Expert Advisor contains special software functions and macros that help to achieve positive dynamics of transactions. Anticorona does not use the martingale strategy and other ins

For the EA to work correctly, do not forget to upload the files to the terminal directory (... AppData \ Roaming \ MetaQuotes \ Terminal \ Common \ Files)
NeuralLink is a new model of a fully automated trading neuro-system using an active neuro-scalping strategy. This system, in the basis of which a specialized neural network is integrated, is capable of continuous learning, transforming the chaotic realities of the market into a specific system, which allows improving the quality of opened tr

Una utilidad para establecer automáticamente los niveles de equilibrio, transfiere las operaciones al equilibrio al pasar una distancia determinada. Le permite minimizar los riesgos. Creado por un comerciante profesional para comerciantes. La utilidad trabaja con cualquier orden de mercado abierta por un comerciante manualmente o mediante asesores. Puede filtrar operaciones por número mágico. La utilidad puede trabajar con cualquier número de pedidos al mismo tiempo.
Versión MT5 https://www.mq

Milch Cow Scalping-5M EA "is a tool designed to put in your hands the technical analysis tools for most indicators and 5 strategies for 28 pairs of currencies in one chart for scalp trading at 5 minute frame
It is also designed to enable you to trade manually and automatically The chart shows the following :-
All the immediate changes of 28 pairs of currencies for all time periods (M1, M5, M15, M30, H1, H4, D1, W1 ) , Number of points and colors , The green color for up and red color for
CheatcodeFX Trade Manager
Your profit management companion. Especially perfect when you have a VPS or a dedicated machine setup. Apply it on the pairs that you care about and walk away. I personally applied it to the 28 main pairs that I often watch on a dedicated mini pc and do the trade execution on another device. With this supporting you in the background, trade with confidence know this will help move you to breakeven and take the best out of your trade. CheatcodeFX Trade Managers works on

This gives you many opportunities and gives you beautiful goals in a short time that you can see for yourself and this indicator depends on the foundations and rules of special knowledge It also gives you entry and exit areas with very good and profitable goals This is an indicator that I have been training on for a long time The results were more than impressive

Nothing not even the market can escape a black hole and its event horizon.
This system detects the event horizon of the market and bets that the black hole will prevent the price from crossing it.
The system is not interested in what is inside or outside the black hole, only in its event horizon, where price cannot escape the dictatorship of the gravity of its black hole. Being a very aggressive scalping system, it should only be used in pairs with a low spread and low commissions.
This syst

Trade24 for MT4 Trade24 is arguably the most powerful expert advisor in manual trading. With our tool, open your orders in record time (50 times faster). This is why our users call it the "scalper tool". Key features of the panel
It works perfectly on all trading asset Trade24 calculate the exact lot size for your trade according to the stop loss size and your available account equity Trade24 has the ability to schedule your future trades with the "Scedulled" function Set Stop Loss

https://www.mql5.com/ru/signals/879917 El asesor experto le permite ir a las cuentas TOP PAMM.
Sistema de comercio del autor basado en 5 indicadores.
Además, se utiliza una cuadrícula para aumentar la rentabilidad.
La EA oficios dependiendo del lote y takeprofit la configuración de los conservadores (10-20% por mes) a modo agresivo (+200% por mes).
muestra de 40 a 60% de crecimiento por semana. 200-240% por Mes!
Operaciones en 10 pares de divisas. Probado desde 2000 en 30 pares, vea el to

HyperLook is a completely automated trading advisor that works primarily on a 30 minute timeframe. The Expert Advisor has a special scalping algorithm based on the synthesis of fast and slow stochastic oscillators, wave chart structuring using MACD and a special neurosystem macro that allows the Expert Advisor to learn precedently. The advisor's settings are based on a safe trading strategy, the essence of which is to close a deal, upon reaching a positive dynamism of profitability of several po

Technical confluence zones is a very popular tool for traders. This EA detects such zones by studying chart patterns, naked price levels, fib levels, SMA/EMA over multiple timeframes and more. The source data is loaded from Mytradingpet.com. To find out what are factored in when determining such zones, visit https://mytradingpet.com - a free service for all traders. The zones are color coded. Purple indicates the highest level of confluence.

Ea with indicators M A C D (Moving Averages Convergence/Divergence).
ONLY 1 COPIES OUT OF 5 LEFT AT $ 99! After that, the price will be raised to $ 199.
LIVE SIGNAL and EA STRATEGY ⤵⤵⤵ https://www.mql5.com/en/users/supomo/seller#products
PARAMETER SETTING EA ⤵⤵⤵ https://www.mql5.com/en/blogs/post/744860
The advantages of Ea MACD VERSION are:
=>. With Ea MACD VERSION, even if you float hundreds of PIPs, you can still profit if Target_lock_Profit is reached and will close all orders

Description
SuperCCI is an indicator based on the standard CCI indicator. It identifies and displays convergences/divergences in the market and forms the corresponding entry points. Also, using the trading channel index, it determines the direction of the trend and displays the levels of support and resistance .
Features Not repaint. Shows entry points. Shows the direction of the current trend and support/resistance levels. Has notifications. Recommendations
Use convergence/divergence to ide
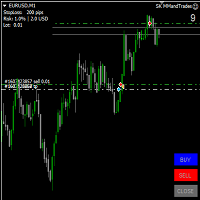
El asesor fue creado para revendedores, y los comerciantes que son importantes para abrir y cerrar rápidamente las transacciones con el lote calculado.
Además, el asesor puede entrenar habilidades en la historia en el probador de estrategias.
Los botones y los informadores ocupan poco espacio en el gráfico, y no interfieren, incluso si hay 8 gráficos abiertos.
El asesor calcula Lot, del StopLoss especificado en % del depósito, y abre las órdenes correspondientes con los botones "COMPRAR"y "

FXC iCCI-DivergencE MT4 Indicator
This is an advanced CCI indicator that finds trend-turn divergences on the current symbol. The indicator detects divergence between the CCI and the price movements as a strong trend-turn pattern.
Main features: Advanced divergence settings
Price based on Close, Open or High/Low prices Give Buy/Sell open signals PUSH notifications
E-mail sending Pop-up alert Customizeable Information panel Input parameters: CCI Period: The Period size of the CCI indicator.
CCI Ap

DEMKO EA Demko is a professional expert works based on an analysis that always follow the trend and waits for the breakout and price correction . This EA is switching in positions, if a trade hit a stop loss it will open an opposit trade with a predetermined lot series in a very strong area. Features: Every trade is protected with stop-loss Fully customized martingale Tested with 99.90% data with different spread Live Signal : IMPORTANT! Do NOT use martingale if you dont know the ri
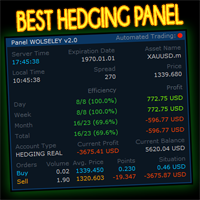
WOLSELEY's Trading Panel - BASIC - - Feel free to contact me at instagram @walter_robos or whatsapp/telegram +5592981173937 View your history in a structured and detailed manner, with efficiency rate and profit rate separated by day, week, month and total, as well as asset details, server time and positions&orders in progress. This panel was created looking on HEDGE-type accounts, but it can be used on NETTING-type accounts without any problems. In the PREMIUM version of this Panel you have

LAUNCH PROMO Next price: $249 The price will be rise to limit the number of users for this strategy The "Trend BtD" Expert Advisor is a representative of robots trading breakout levels. Levels built automatically. The uniqueness of the advisor is that it work WITHOUT averaging and using the martingale principle. ALL orders have StopLoss and TakeProfit. VERY IMPORTANT: Always load SET Files for each pair! Adjust Lot size to yours deposit! HOW TO TEST: 1. Choose H1 TimeFrame 2. Load my

Space X it is a Secure Automated Software for trade Forex market and indices.
The architecture is a Fully Automatic Autonomous Robot Expert capable of
independently analyzing the market and making trading decisions
Space X It is an advanced and professional trading system. This is a FULL configurable system.
Space X is a professional system, Ready to personalized your profile. You can download the demo and test it yourself.

Fully Automated Robot
Based on the MACD and Stochastic Indicator combined.
You also have the option to hide the TP and SL. ==> You have 4 Options to trade ==> 1. Set TP and SL ==> 2.Trailing the trade when in profit ==> 3.Close at opposite signal ==> 4.Martingale option works on all Time Frames. On the lower Frames there are too many small trades but its up to yourself. I would recommend to test it on a Cent Account if you are not sure. You can click on the link below for a Cent Broker which
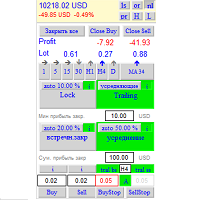
The main task of the expert Advisor is to reduce the drawdown and close all orders that are opened by other expert advisors or manually. But it also added the functions of regular trading, so now the expert Advisor can be used as the main tool for earning money.
The principle behind its strategy: All the actions performed by the Expert Advisor are controlled by built-in trend indicators, but, as practice has shown, many users disable these indicators to accelerate a process of “settlement” (i.

The Your Chance indicator studies price action as a collection of price and time vectors, and uses the average vector to determine the direction and strength of the market. It also estimates the market trend based on rough measurements of price movement. This indicator is confirming and can be especially useful for traders looking for price movements. This indicator highlights the direction and strength of the market and can be used to trade price fluctuations.

Unexpected Decision is a trend indicator that uses an original calculation algorithm. This is a new product that allows you to identify the current market phase (uptrend, downtrend or flat). The indicator is applicable for any data and periods. The middle of the trend wave, as well as the edges, are places of special heat and market behavior; when writing the indicator, an attempt was made to implement precisely finding the middle. This indicator paints arrows in different colors depending on th

This EA has been developed, tested and traded live for DAX (DE30) M30 TF. Everything is ready for immediate use on real account. Very SIMPLE STRATEGY with only FEW PARAMETERS. Strategy is based on KELTNER CHANNEL breakout. It enters if volatility raise after some time of consolidation . It uses STOP pending orders with ATR STOP LOSS and FIXED TAKE PROFIT. To catch more profits there is also a TRAILING PROFIT function in the strategy. EA has been backtested on more than 5-year lon

The EA opens trades using the indicator's graphical arrows. If the indicator needle does not have a binding buffers, it is possible to test this indicator with the help of dagnogo adviser. Specify the arrow codes in the parameters and the EA will trade on them. You can find out the arrow codes by opening the arrow properties.
following values are set by default: 225; //Up arrow code 226; //Down arrow code

Pattern Trader No Repaint Indicator
MT5 Version of the indicator: https://www.mql5.com/en/market/product/57462 Advanced Chart Patterns Tracker MT4: https://www.mql5.com/en/market/product/68550
I ndicator searches for 123 Pattern, 1234 Pattern, Double Top, Double Bottom Patterns , Head and Shoulders, Inverse Head and Shoulders and ZigZag 1.618 Pattern.
Pattern Trader indicator uses Zig Zag Indicator and Improved Fractals to determine the patterns. Targets and Stop Loss Levels are defined by
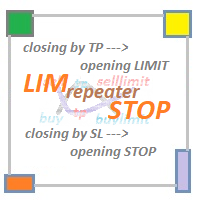
LIM_STOP_REPEATER Программа не открывает сделки сама. Она повторяет сделки открытые вручную. Программа повторяет закрытые по TP или SL ордера: Выставляет Limit ордер при закрытии по TP. Выставляет Stop ордер при закрытии по SL. Программа не имеет ограничений по количеству повторов сделок. В программе отсутствуют внешние параметры. Если сделку закрыть вручную, отменить отложенный ордер - программа не будет повторять эту сделку.
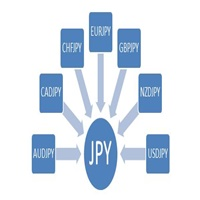
The JPYIndex is the YEN index, which is integrated for the seven currencies of AUDJPY, CADJPY, CHFJPY, EURJPY, GBPJPY, NZDJPY and USDJPY. The JPY Index works better with other indexes in combination. For example, the combination of JPYIndex and AUDIndex can directly reflect the trend of currency AUDJPY. It is easy to understand that the currency AUDJPY is split into two indices, one is the JPYIndex and the other is the AUDIndex. Through the analysis, it can be intuitively found that, in a
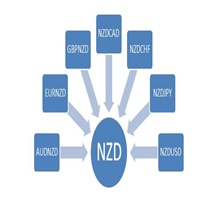
The NZDIndex is the Pound index, which is integrated for the seven currencies of AUDNZD, EURNZD, GBPNZD, NZDCAD, NZDCHF, NZDJPY and NZDUSD. Through this index, the direction of USD overall trend can be intuitively understood. The NZDIndex works better with other indexes in combination. For example, the combination of NZDIndex and GBPIndex can directly reflect the trend of currency GBPNZD. It is easy to understand that the currency GBPNZD is split into two indices, one is the NZDIndex and the
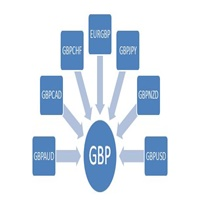
The GBPIndex is the Pound index, which is integrated for the seven currencies of GBPAUD, GBPCAD, GBPCHF, GBPJPY, GBPNZD, GBPUSD and EURGBP. Through this index, the direction of USD overall trend can be intuitively understood. The GBPIndex works better with other indexes in combination. For example, the combination of GBPIndex and NZDIndex can directly reflect the trend of currency GBPNZD. It is easy to understand that the currency GBPNZD is split into two indices, one is the GBPIndex and the
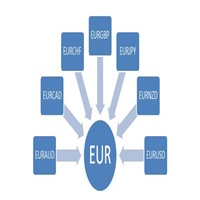
The EURIndex is the Europe dollar index, which is integrated for the seven currencies of EURAUD, EURCAD, EURCHF, EURGBP, EURJPY, EURNZD and EURUSD. Through this index, the direction of EUR overall trend can be intuitively understood. The EURIndex works better with other indexes in combination. For example, the combination of EURIndex and CHFIndex can directly reflect the trend of currency EURCHF. It is easy to understand that the currency EURCHF is split into two indices, one is the EURIndex
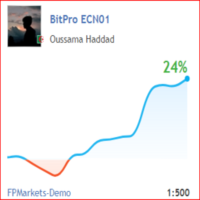
https://www.mql5.com/en/signals/867567 the EA not work in icmarket
BitPro expert Advisor developed to work on pending orders It has a system of protection against slippage and high spread and so on time control Works on a specific spectrum of currencies Max spread suported is 1.1 pips "EURUSD;AUDUSD;GBPUSD;GBPJPY;USDJPY;CADCHF;GBPCHF"
Recommendations:
Timeframe - All Minimum balance: from $ 50 Instruments: EURUSD;AUDUSD;GBPUSD;GBPJPY;USDJPY;CADCHF;GBPCHF The lower the spread, the more pr

The FixatorEF expert system works with ticks, on any type of account, both netting and hedging. For the internal algorithm, the elementary unit of analysis is a tick, not a bar. Works with 5-digit quotes. Requotes are critical; you need a broker with minimal execution delays.
Settings Magic - Sets the magic number. Lot - Sets the lot size for entering the market (priority is higher than that of the Risk field). Risk - Calculates a lot depending on the deposit. Spread - Limits the spread (at wh

Sin parámetros Índice de riesgo Índice de rendimiento Este producto es un sistema similar al de Martin con un factor aleatorio, con un beneficio del 1% del presupuesto de programación diario, si no se logra, se acumulará al día siguiente; El día que viene, el número de manos se agrandará, y usé $1.000 en la prueba para empezar a correr, duplicando el efecto en dos meses. B) el riesgo y el beneficio son, en general, los mismos; Sin embargo, es por ello que las
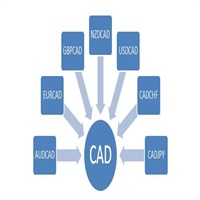
The CADIndex is the Canadian dollar index, which is integrated for the seven currencies of AUDCAD, EURCAD, GBPCAD, NZDCAD, USDCAD, CADCHF and CADJPY. Through this index, the direction of CAD overall trend can be intuitively understood. The CADIndex works better with other indexes in combination. For example, the combination of CADIndex and EURIndex can directly reflect the trend of currency EURCAD. It is easy to understand that the currency EURCAD is split into two indices, one is the CADInde
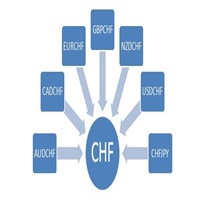
The CHFIndex is the Swiss franc index, which is integrated for the seven currencies of AUDCHF, CADCHF, EURCHF, GBPCHF, NZDCHF, USDCHF and CHFJPY. Through this index, the direction of CHF overall trend can be intuitively understood. The CHFIndex works better with other indexes in combination. For example, the combination of CHFIndex and JPYIndex can directly reflect the trend of currency CHFJPY. It is easy to understand that the currency CHFJPY is split into two indices, one is the CHFIndex an
La EA por dos índices de Ma y ATR para capturar la tendencia.EA puede ajustar el número de ciclos en la mano, los parámetros de referencia para optimizar, múltiplos de EA.Optimización de los parámetros de rentabilidad después de traer mejores.Es una herramienta fácil de capturar la tendencia de los inversores.Se recomienda el uso de múltiples necesidades de los múltiplos de tratar de hacer menos paradas para el excedente de EA, el viento puede tener mejor control de sus fondos.A continuación se
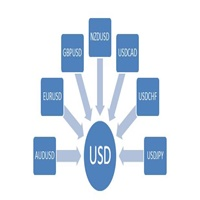
The USDIndex is the USD dollar index, which is integrated for the seven currencies of AUDUSD, EURUSD, GBPUSD, NZDUSD, USDCAD, USDCHF and USDJPY. Through this index, the direction of USD overall trend can be intuitively understood. The USDIndex works better with other indexes in combination. For example, the combination of USDIndex and AUDIndex can directly reflect the trend of currency AUDUSD. It is easy to understand that the currency AUDUSD is split into two indices, one is the USDIndex and

optimum automatic and manual system transactions
You only need to set Auto Lot and Auto Stop Loss.
lot = AccountEquity()/Riskmoney
Average value through simple setting, removal, trend filtering, and partial closure of lost locations.
The automatic calculation system prepares settings with just a few clicks. Unlike the grid strategy of processing only orders for the entire group, some losses can be reduced while reducing the burden of deposits.
Benefits:
1. Ideal for handling non-prof

With this Expert Advisor you will never miss an indicator event, you will receive notifications on your mobile phone when the chart matches the conditions you have set.
Indicators in the Expert Advisor
Moving Average(MA) Bollinger Bands(Bands)
Stochastic Oscillator(Stochastic)
MACD
Relative Strength Index(RSI)
Before use the Expert Advisor
Install "MetaTrader 4" on your mobile phone. Enable Push Notifications in "MetaTrader 4" on your PC, go to menu bar Tools -> Options -> Notifica

Felicity Bot is GBPUSD Specialist trading Robot that designed to work on the GBPUSD only. The basic strategy is based on pullbacks in the direction of trend from both the daily and chart entry timeframe. It is highly accurate with up to over 90% win-rates. The l10% times when it is wrong, the Expert Advisor (EA) will use an imbalanced hedging strategy to hedge its way out of loses. This EA is one of the few gems in the market that survived 11years of in-and-out of sample of backtest. It is b

Clever cube The system makes use of Fibonacci resistance line's fast callback strategy.EA does not use Grid, Martin strategies.So usually the bill is not much, it is always waiting for the right time to bill. Recommended timeframe is M1. Minimum account balance: $50. Default parameters are for EURUSD M1 and GBPUSD M1 . It is recommended to use low spread broker and low latency virtual machine. Features: Every trade is protected by stop-loss. Fast entry and exit, no position overnight, with des
Hello Traders! Version 3.0 of the script has been released!
What's new? Thanks to your suggestions I have inserted these changes to the tool: 1 - Data input are now date picker, it will be easier and faster to set the data export period; 2 - A message box will check that there is not a file with the same name in your folder; 3 - Error message to check that data insert are correct. If you like this product, take a look to the FULL INTERFACE! MT4 To Excel Interface
This script is a very usefu

Systematic is an automated trading system that uses a price action to open and close trades. Could be used for everyday trading. Doesn't use grid, martingale or other dangerous money management methods. Perfect fit for Cryptocurrencies as well. Best fit on 30M timeframe. Recommended Minimum deposit of 100 usd for each 0.01 lot Settings EA Order_Comment - Order comment Lots- Fixed lot StopLoss TakeProfit TrailingStop Channel Parameter -------------- PM ME AFTER BUYING THE EA TO SEND YOU THE OPT

The reason why many traders new to using the Fibonacci retracement tool find it hard to effectively use it is because they are having trouble identifying swing points that are significant enough to be considered.
Main Features Show Fibonacci number with LL to HH in multitimeframe
Show 23.6,38.2,50,61.8,78.6,88.6,100,112.8,127.2,141.4,161.8,200,224,261.8,314,361.8 and 423 of Fibonacci number
Easy to use with simple interface. Real time information for the Fibonacci number .
Settings Global Sett

This is a simple trend indicator. It draws the arrows live and shows when the potential trend starts or ends. It is separated by my indicator for positions on the trend direction Cross MAs Trend Entry , so that you can use it practice with it and get more familiar with my strategies. Note : the indicator does not redraw arrows, it works absolutely live and for every period and simbol ( it is most optimized for M5 )
It has simple input parameters, the default values are optimized for M5 for most
Hedge Edit sfrutta la tecnica dell’hedging gestendo simultaneamente posizioni Buy e Sell, grazie alla elaborazione del lotto impostato nell’input Lots multiplier applica una strategia di recupero alle successive posizioni che verranno aperte in base al valore impostato nell’input Step Grid Points e mantiene il take profit impostato nell’input Take Profit Points di entrambi sempre raggiungibili dal prezzo prezzo attuale di mercato. La ricezione del segnale di entrata è elaborata dalla chiusura d

Trend PRO Expert Advisor is developed base on the PipFinite Trend PRO Indicator, the best indicators on the market so far. PipFinite Trend Pro's smart algorithm detects the trend, filters out market noise and gives entry signals with exit levels. This EA open order when the indicator has buy/sell signals and set SL/TP follow the indicator rules. You can read more information about PipFinite Trend PRO indicator here .
Important Information
This EA will only work if you purchased PipFinte

Luma EA 4D
Con este EA las posibilidades de configuraciones son muchas. Genial para cuentas pequeñas o para aquellos que quieran tener más control sobre los pedidos, ya que este EA solo abre 1 operación a la vez, es decir, solo abre otra operación una vez finalizada la actual. Tiene 5 parámetros personalizables, sin muchas complicaciones. Este EA es ideal para quienes buscan más simplicidad para encontrar la configuración ideal para lograr buenos rendimientos sabiendo exactamente qué es y qué

Fibonacci theft is an ultrascalping system that uses Fibonacci levels to launch a scalping system that allows theft a few pips from the market. This system allows the use of fibonacci levels, predetermined levels or a level chosen by the user. It also presents the option of using or not volume and impulse filters. Being a very aggressive scalping system, it should only be used in pairs with a low spread and low commissions.
This system is suitable for small accounts and can be used wit

Luma EA 5D
Con este EA las posibilidades de configuraciones son muchas. Genial para cuentas pequeñas o para aquellos que quieran tener más control sobre los pedidos, ya que este EA solo abre 1 operación a la vez, es decir, solo abre otra operación una vez finalizada la actual. Tiene 5 parámetros personalizables, sin muchas complicaciones. Este EA es ideal para quienes buscan más simplicidad para encontrar la configuración ideal para lograr buenos rendimientos sabiendo exactamente qué es y qué h

Expert Advisor will manage all transactions you make using Expert Advisor, or manually from all platforms (Web Trade, MT4 Windows, MT4 Mac, MT4 Mobile phone) Multi Currency In one chart, the Tool will manage transactions of all currencies or according to the available list.
Currency Selection All Transactions of All Pairs Based on the Pairs List
Auto Manage, with setup parameters on one chart Auto Close Profit Average Auto Close Profit only Auto SL / TP Auto Trailing
Button Function to : Clos
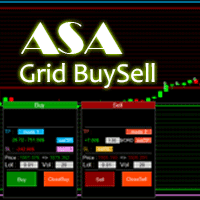
Asa Manual Grid Buy Sell with UI is made for Grid trading when orders are placed above and below a set price, creating a grid of orders at incrementally increasing and decreasing prices.
Main Features Ability to set buy grid with 200 maximum orders. Ability to set sell grid with 200 maximum orders.
Easy to use with simple interface. Have 2 mode of Take Profit and 1 for Stop Loss.
Real time information for the current open positions and calculate average sum of order price. How to use
STEP 1

Ea with RSI and CCI Indicators. ONLY 2 COPIES OUT OF 5 LEFT AT $ 99! After that, the price will be raised to $ 199.
If your download EA Please reviews or comment for improvement,Thank's.
LIVE SIGNAL and EA STRATEGY ⤵⤵⤵ https://www.mql5.com/en/users/supomo/seller#products
PARAMETER SETTING EA ⤵⤵⤵ https://www.mql5.com/en/blogs/post/744860
The advantages of Ea RSI and CCI VERSION are:
:+:. You can use the Martingale strategy (set 1 = Off).
:+:. With Ea RSI and CCI, even if you float
SuperLine : This EA is using Force Index Indicator to identify price breakouts and potential trend changes. EA is a fully working trading robot for any account type. No dangerous trading techniques - orders open with stop loss and take profit. Features Minimal deposit: USD 50 Default Settings for EURUSD - H4 Works On Any currency Pair & all timeframes Every trade is protected by stop-loss Doesn't use martingale Suitable For New Traders And Expert Traders Input parameters : PP = << Para

Tornado Profit EA
Please use the testing set on 1H EURUSD
If you have bought ANY of my Products then you are ELIGIBLE TO JOIN the Private group !!!
TELEGRAM group: send me message to add you to our community PRIVATE GROUP(unfortunately there are a lot of scammers to public ones...)
BENEFITS:
1. Discounts and Hot DEALS Tornado Profit EA is full automated expert advisor that uses a revolutionary grid system with an advanced risk reduction logic. The essence of Tornado Profit EA i

NewFx EA
Con este EA las posibilidades de configuraciones son muchas. Ideal para cuentas pequeñas o para aquellos que desean tener más control sobre los pedidos. Tiene 12 parámetros personalizables, sin muchas complicaciones. Probé en varias monedas y en todas ellas puede obtener ganancias. Siéntase libre de usar el analizador de estrategias y encuentre la mejor configuración para la moneda que desea usar según su estrategia y su inversión inicial. Parámetros: StartHour: a qué hora del día busc
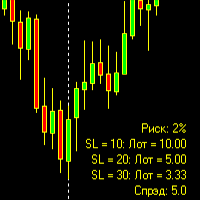
El panel de información del indicador muestra el número especificado de parámetros. Dependiendo de la ubicación instalada, la información se mostrará en una de las esquinas. El indicador solo muestra información sin negociar por sí solo. Esto significa que, si necesita abrir un trato, debe mirar el panel de información, encontrar la línea con el valor de SL y ver qué lote desea colocar.
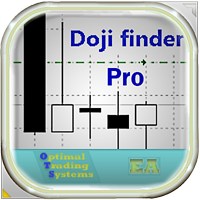
El EA opera al encontrar velas Doji en el gráfico. Muestra las velas en las que está operando y también muestra cómo está configurada la vela de señal. Esta versión del EA también puede intercambiarse con las velas Engulf. La configuración exacta de las velas de señalización se puede cambiar y optimizar. Además, esta versión permite analizar los volúmenes de negociación, de modo que, por ejemplo, se ignoren las señales cuando había poco volumen. Además, el asesor tiene configuraciones para indi

Every trader is watching over his account over and over.... trying to anlayse every system he or she has. With this tool you are able to export your complete history of every account
export withdrawls / deposits / rebates to a separate file
export account status with balance / equity / current drawdown
recalculate micro to standard lots / profits ...
export decimal by "." or ","
combine a series of Magic Numbers to one unique Magic Number
filter to ignore OrderComments.

Fully Automated Robot
Watch here how to set the bot https://www.youtube.com/watch?v=2wCzTFIGNp4&feature=youtu.be
This Long term Robot for MT4 is based on 9 Indicators.
==> You have 4 Options to trade ==> 1. Set TP and SL ==> 2.Trailing the trade when in profit ==> 3.Close at opposite signal ==> 4.Martingale option works on all Time Frames. On the lower Frames there are too many small trades but its up to yourself. I would recommend to test it on a Cent Account if you are not sure. You c

Fully automated EA on CCI strategy. For more info join to http://discord.io/reitakfx where you can get info how to set, how to trade with this indi
If you want this and all my other products for FREE , create account here http://bit.ly/reitakfxroboforex and then write me and I will send you all my actual and future product for FREE + VIP on my DISCORD
New setfiles --- not ready for current market, need new optimalization
Recommend balance 1k
- you can easy optimalize own pair or use

The PatternMMB trading indicator finds the most common candlestick analysis patterns and provides trading recommendations based on them. The PatternMMB trading indicator is designed to search for candlestick patterns on the price chart and issue trading recommendations depending on the nature of the found candlestick pattern. It is also possible to send sound notifications when all or any of the selected patterns appear, with an explanation of the pattern and its interpretation. In addition, th

The IndicatorPivot indicator is suitable for using forex trading strategies designed for intraday trading. "IndicatorPivot" displays on the price chart of a currency pair the Pivot level (average price for the current day) and the three closest support and resistance levels, calculated based on Fibonacci levels. The "Indicator Pivot" indicator uses Fibonacci levels to solve the problem of building support and resistance levels in Forex trading. This indicator is very easy to understand and to ap
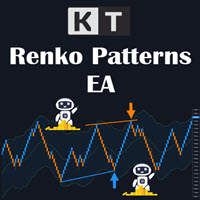
En el trading manual, muchas configuraciones y oportunidades proporcionadas por el indicador KT Renko Patterns se pierden debido a los movimientos repentinos de precios en los gráficos Renko.
KT Renko Patterns EA resuelve este problema mediante una estrategia de trading 100% automatizada basada en el "KT Renko Patterns Indicator". Después de obtener las formaciones y señales del indicador, realiza verificaciones y evaluaciones previas para ejecutar eficientemente las operaciones.
Todos los co

A non-indicator trading EA that works after the end of the American trading session, 22 (CET). Ideal for working on accounts with low spreads with or without commission https://www.mql5.com/en/signals/779500 Differences from EA Inquisitor Lite : - commission accounting, the algorithm is adapted to work on ECN, Raw-spread accounts with a spread close to zero; - prohibition of entries in the direction of trend departure in Murrey reversal zones; - the option to work with virtual Stop-Loss prote
MetaTrader Market - robots comerciales e indicadores técnicos para los trádres, disponibles directamente en el terminal.
El sistema de pago MQL5.community ha sido desarrollado para los Servicios de la plataforma MetaTrader y está disponible automáticamente para todos los usuarios registrados en el sitio web MQL5.com. Puede depositar y retirar el dinero a través de WebMoney, PayPal y tarjetas bancarias.
Está perdiendo oportunidades comerciales:
- Aplicaciones de trading gratuitas
- 8 000+ señales para copiar
- Noticias económicas para analizar los mercados financieros
Registro
Entrada
Si no tiene cuenta de usuario, regístrese
Para iniciar sesión y usar el sitio web MQL5.com es necesario permitir el uso de Сookies.
Por favor, active este ajuste en su navegador, de lo contrario, no podrá iniciar sesión.