Robots comerciales e indicadores para MetaTrader 4 - 91

Description Pivot Lines is a universal color multicurrency/multisymbol indicator of the Pivot Points levels systems. You can select one of its three versions: Standard Old , Standard New and Fibo . It plots pivot levels for financial instruments in both windows simultaneously. The system will automatically calculate the Pivot Point on the basis of market data for the previous day ( PERIOD_D1 ) or week ( PERIOD_W1 ) and the system of support and resistance levels, three in each. It can also displ

The script allows to close all opened positions for a given currency pair (EURUSD by default, but it can be change to any existing currency pair). Input parameters sSymbol = "EURUSD"; PendingOrders = false; which will appear in the Inputs tab where you can change a working symbol and set PendingOrders to true to delete all pending orders for a given currency pair. This script will close and delete all positions for a given currency pair only. Keep in mind that you have to "Allow automated tradin

The Linker charts master utility links all open chart windows and switches them to one instrument. All the operations in the window on which the indicator is running are copied to all the linked ones. It is a great aid for those trading based on support and resistance levels. For instance, a level drawn for D1 will be drawn in other windows. The utility responds to the change of the style, color of objects and selection of the timeframes to display the objects. The utility copies the settings fr

The Zig-Zag indicator is extremely useful for determining price trends, support and resistance areas, and classic chart patterns like head and shoulders, double bottoms and double tops. This indicator is a Multi Time Frame indicator. The indicator is automatically calculate the 3 next available TF and sows ZigZag from those TimeFrames. You cannot use this indicator for the TF greater than D1 (daily).

Simply drop the indicator to the chart and Fibonacci levels will be shown automatically! The indicator is developed for automatic drawing of Fibonacci levels on the chart. It provides the abilities to: Select the standard Fibo levels to be shown Add custom levels Draw the indicator on the timeframes other than the current one. For example, the indicator is calculated on the weekly period (W1) and is displayed on the monthly period (MN1) Select the timeframes the indicator will be available on Ca

The MACD offers the best of both worlds: trend following and momentum. Traders can look for signal line crossovers, center-line crossovers and divergences to generate signals. Because the MACD is unbounded, it is not particularly useful for identifying overbought and oversold levels. It is not easy to use any indicator on smaller timeframes because traders cannot not look away from the screen. This classical indicator includes "Alert" function (see screenshots). Keep in mind that this indicator

This script is designed and used to move StopLoss for all EURUSD positions (or any other available currency pairs) at once. The Stop Loss will be moved to a level: Bid - StopLevel (for Long position) Ask + StopLevel (for Short position). STOPLEVEL applies to distance between entry price and SL. Of course, this script will move the StopLoss only if: Bid > OrderOpenPrice() + StopLevel (for Long) and Ask < OrderOpenPrice() - StopLevel (for Short). When you put the script on the chart the Input Box

This multi-timeframe indicator is based on the idea of classical indicator CCI (Commodity Channel Index). As you know, CCI was developed to determine overbought and oversold levels. The CCI does this by measuring the relation between price and a moving average (MA), or, more specifically, normal deviations from that average. This particular indicator shows the modified CCI data from higher timeframe ordered by an input parameter "TF". Green rhombus on the chart represent an UP trend and Red rhom

The Doji candlestick pattern is characterized by one that has its open and close prices nearly (if not exactly) equal and resembles the shape of a cross. It is often regarded as a sign of indecision and is especially significant if seen in a down trend or up trend, which potentially signals that sellers or buyers are losing conviction. The TIL Doji Price Action finds and marks all Doji candlestick patterns and intelligent approximations thereof. In addition, it predicts the direction of price wi

Many indicators are based on the classical indicator Moving Average . The indicator All_TF_MA shows crossing of 2 MA from each TimeFrames . You will be able to change main input parameters for each MA for every TF. Example for M1 TF: Period1_Fast = 5 Method1_Fast = MODE_EMA Price1_Fast = PRICE_CLOSE Period1_Slow = 21 Method1_Slow = MODE_SMA Price1_Slow = PRICE_TYPICAL

The script allows you to close all opened positions for a given currency pair ( EURUSD by default, but it can be changed to any existing currency pair) when Sum of Profit from all opened positions (by chosen currency pair) is equal or greater than value of the input parameter: SumProfit .
Input Parameters sSymbol = EURUSD SumProfit = 100 Slippage = 2 You can change SumProfit to any positive value ( in dollars , not in points!). This script closes all positions for a given currency pair only.

Overview This is a very simple indicator that displays the relative strength values of the currencies on te current chart and timeframe. The strength is only calculated for the currencies: AUD - Australian Dollar CAD - Canadian Dollar CHF - Swiss Franc EUR - European Union Euro GBP - Great Britain Pound JPY - Japanese Yen NZD - New Zealand Dollar USD - United States Dollar
These are considered the major currencies in the world. There are 28 distinct combinations of major currency pairs. Other c

Prototype 2 is a no-martingale automated system, well testable in a 15-year history period and showing good results in real trading. The default settings are suitable for EURUSD M15, however the EA is well adaptable for any currency pairs and timeframes through its input parameters. The Expert Advisor is suitable both for beginners, because you need only to attach it to a chart, and experienced traders, because in addition to the automatic mode, the EA has options for manual settings of the lot,

This indicator is based on the classical indicator CCI (Commodity Channel Index) and will be helpful for those who love and know how to use not a visual but digital representation of the indicator. All TimeFrames CCI MT4 indicator shows values from each timeframe. You will be able to change the main input parameters for each CCI for every TF. Example for M1: sTF1_____ = "M1"; Period1 = 13; Price1 = PRICE_CLOSE.

BuyStop_SellStop_Grid script opens BuyStop and SellStop pending orders. You just need to drop this script on the chart with a desired currency pair. Before placing all pending orders, the input window is opened allowing you to modify all input parameters: LongPos - if TRUE, BuyStop orderi is opened. ShortPos - if TRUE, SellStop order is opened. InitLot - initial lot. LotCoeff - if 1, all pending orders will have the same lot size. InitStep - difference between two consecutive orders in points.

BuyLimit_SellLimit_Grid script opens BuyLimit and SellLimit pending orders. You just need to drop this script on the chart with a desired currency pair. Before placing all pending orders, the input window is opened allowing you to modify all input parameters: LongPos - if TRUE, BuyLimit order is opened. ShortPos - if TRUE, SellLimit order is opened. InitLot - initial lot. LotCoeff - if 1, all pending orders will have the same lot size. InitStep - difference between two consecutive orders in poi

This indicator is based on the classical indicator STOCHASTIC and will be helpful for those who love and know how to use not a visual, but digital representation of the indicator. All TimeFrames Stochastic MT4 indicator shows values from each timeframe (M1, M5, M15, M30, H1, H4, D1, W1 and MN1). You will be able to change the main input parameters for each Stochastic from every TF. Example for M1: sTF1_____ = "M1"; K_Period1 = 5; D_Period1 = 3; S_Period1 = 3; Method1 = MODE_EMA.

ForexTrendMT4 Indicator: A Reliable Tool for Market Tracking The ForexTrendMT4 indicator offers reliable market trend tracking, filtering out sudden fluctuations and market noise. This tool helps identify trends and signals favorable entry points into the market using arrows. It is suitable for both scalping on shorter timeframes and long-term trading strategies. Based on the principles of technical analysis, ForexTrendMT4 takes into account the cyclical nature of the market. Key Features and A
Complete Pending Orders Grid System opens any combinations of Buy Stop, Sell Stop, Buy Limit and Sell Limit pending orders and closes all existing pending orders. You just need to drop this script on the chart of a desired currency pair. Before placing all pending orders, the input window is opened allowing you to modify all input parameters: DeleteAllPendings – if true , then all pending orders (for current currency) will be deleted. BuyStop – if true , BuyStop order is opened. SellStop – if tr

Este robot de trading aplica siete indicadores! El trading se realiza en los roll-back. El producto también cuenta con sistema de gestión de dinero incorporado. Cada orden se apoya en la doble red segura con martingala muy suave. No intente establecer el valor del lote inicial demasiado alto para reducir los riesgos. El robot automáticamente analiza el estado del mercado y toma una decisión de entrada de mercado basada en la señal común de todos los siete indicadores. Los indicadores utilizados

Description Trend Trading is an innovative analyzer designed for trend following trading. The analyzer consists of a trend line, colored bars, arrow pointers and reference information. After completion of the current bar, the trend line, the color of the bar and the arrow pointers are not redrawn. Change of market sentiment can be calculated based on one of the fourteen basic indicators included in the standard package of MT4, it affects the color of the trend line. Optionally colored bars, arro

This indicator is based on the classical indicator Parabolic SAR and will be helpful for those who love and know how to use not a visual, but digital representation of the indicator. All TimeFrames PSAR MT5 indicator shows values from each timeframe (M1, M5, M15, M30, H1, H4, D1, W1 and MN1). You will be able to change the main input parameters for each Stochastic from every TF. Example for M1: sTF1 = M1 pStep1 = 0.02 pMax1 = 0.2

Zig Zag Swing Detector is a talking indicator tool, that let you track new highs and lows using Zig Zag patterns and allows you to react to new highs and lows. For example for uptrend each time there is higher hi spotted, the strength of the trend is increased. Trend is ended with lower low than the previous one. Be notified by Alerts, Speech and Notifications and be alerted about new highs/lows! You can also setup conditions to open trades automatically on new heights. Speech synthesis allows y

The indicator of a Professional Trader is an arrow indicator for predicting the direction of price movement. I have been working on this indicator since 2014.
You can use this indicator as your main indicator, use its entry signals, and use it as your only indicator to find entry points.
About the product: Recommended TF [H4-D1-W1] . The indicator predicts the direction of the next candle. Fits a variety of tools; Flexibility in settings for different instruments and intervals through the MO

Description Stoploss Master Expert Advisor helps you to manage the virtual Stop Loss. It replaces the real Stop Loss levels by virtual ones with further trailing according to its own strategy of preserving a reached profit level. This EA is used when following the trend. In multicurrency/multisymbol mode, the EA is attached to the chart of each financial instrument separately and tracks positions only of a certain financial instrument. Management is performed only by market orders. The EA starts

The analyzer panel allows traders to add the pending order grid (Buy Limit, Sell Limit, Buy Stop, Sell Stop) quickly and efficiently. Parameters stop mode - select stop setting mode every order - stop levels are set for each order separately position as - common stop levels for all orders order type - select pending order type Buy Limit Sell Limit Buy Stop Sell Stop magic - set a magic number for open orders if necessary. If position as mode is enabled, stop levels are corrected for all orders

The TIL Timeframe Overlay indicator is the perfect tool for multiple timeframe analysis . It does the simple yet powerful task of overlaying a candlestick chart of a different timeframe over another allowing you to see the BIGGER picture and see the underlying TREND amid the noise and volatile price action. Please see the screenshots below for examples. Features: It works in ALL timeframe. It works in ANY instrument/symbol. Displays ENTIRE candlesticks (body and wick) of other timeframes includi

The indicator shows you buy/sell signals and does not repaint. It works well with almost all pairs, while the best ones are GBPUSD, XAUUSD and EURUSD. The product works better on H1 and H4. You can change the parameters in the inputs tab to get the best signals and the best trade results on each pair. You can enable/disable alerts when signal appears. The indicator is easy to use.
Parameters barstrip & Sensitive: amount of bars to process the highest and lowest prices (relates to the internal l

Spread Histogram displays spread changes at each price movement. The product is very useful for scalpers as it allows them to spot good market entry points. Small spreads can be used to open a new order or close the current one. This indicator is equipped with: maximum spread minimum spread up / down spread histogram average spread Inputs: AveragePeriod (determine the average of the "X" Histogram) Shift Report

The script allows to close part of opened position if this position has some profit. You just need to drop this script on the chart with a desired currency pair. Let's say you have 1 lot for a Long position with positive profit. With this script you can close any part of the 1 lot (input parameter LotCoeff from 0.1 to 0.9) and remain (for example, 0.4 lot) will have a BreakEven StopLoss. Before placing an opposite orders, the input window is opened allowing you to modify all input parameters:

Crossing of market price and moving average with all kinds of alerts and features to improve visualization on the chart.
Features Crossing of market price and Moving Average (MA) at current bar or at closing of last bar; It can avoid same signals in a row, so it can allow only a buy signal followed by a sell signal and vice versa; MA can be set for any of the following averaging methods: Simple Moving Average (SMA), Exponential Moving Average (EMA), Smoothed Moving Average (SMMA), Linear-weigh
The indicator shows you time remaining till completion of the current candlestick of any timeframe you chose, showing struct (see details). Minute: second. The indicator has 3 parameters: TF - this parameter will help you choose timeframe you want, for example, if you want to show remaining time for M30, set TF=30. If you want to show remaining time of the current period you are seeing on chart, set TF=0 (like in default). Local - this parameter will help you choose location on the chart where t
Automatic stops monitors your account and automatically sets the values you enter in the EA for stop loss, take profit and also trailing stop. As long as the EA is attached on a chart it will set stops and offer automatic trailing to any new trades for that currency pair so you wont have to manually enter them every time you open a trade. Features include: Ability to select which trades should be monitored via magic number. You can leave the value to 0 to only monitor manual trades or to any one

A library for creating a brief trading report in a separate window. Three report generation modes are supported: For all trades. For trades of the current instrument. For trades on all instruments except the current one. It features the ability to make reports on the deals with a certain magic number. It is possible to set the time period of the report, to hide the account number and holder's name, to write the report to an htm file. The library is useful for fast assessment of the trading effec

Description Shows Heikin-Ashi candles (often misspelled Heiken-Ashi) on the chart and can alert when candles change color. The alert is useful for both entry and exit. The number of candles of the new color before an alert is raised can be set. The alert can be controlled interactively, directly from the chart. Also includes bonus indicators of current spread and ask/bid prices in large text, color coded as price changes. Usage Heikin-Ashi candles give a much better insight to the underlying tre

Pivots is an indicator to show pivots for relevant time frames. Besides the pivots the indicator can also show daly open line, the resistance and support levels, the ADR Fibonacci levels and the order of the pivots. Pivots includes an intelligent algorithm to eliminate Sunday candles, but only if your broker provides those. Pivots are significant price levels that may serve as support, resistance or breakout levels Settings textFont - font to use for the labels. textSize - font size. textColor -
Description The product draws lines on the chart to show daily support, resistance and pivot plus weekly and monthly pivot. An alert can be set when the price reaches one of the lines or the price closes above/below it. This can be useful for both entry and exit. The alerts can be controlled interactively directly from the chart.
The product also includes bonus indicators of Average Daily Range (or Average True Range - configurable), current spread and ask/bid prices in large text, color coded a

The most important thing in my system of forces, is the variation and changing of these forces. It is the key to the whole system, and from this point, my second indicator called FORCES-VARIATION appeares important. The indicator is represented in a separate window in the form of the green histogram and the red curve . The parameter NPIuPeriod represents the number of bars on which we calculate the variation of buyers forces. The parameter NPIdPeriod represents the number of bars on which we cal
This panel will be very useful for a research of a trading strategy system. The MA-ControlPanel is based on the very popular Moving Averages indicator. You will be able to change the indicator parameters: Period , Shift , Method and Apply Price by clicking on the Up ( /\ ) and Down ( \/ ) buttons. You may choose your favorite colors using parameters BackGround, maColor1 and maColor2. Sometimes, when you will open a rarely used currency pair or timeframe the indicator will not show its value. In

[ EA] ENTERPRISE LT is a MetaTrader (MT4) Expert Advisor designed for use with most currency pairs and Gold. It implements complete, fully functional trading strategy. It is NOT based on any indicators or Price Action. It is very easy to set up and supervise. The strategy is timeframe-independent. [EA] ENTERPRISE LT has a set of unique features: It can be individually adjusted, according to your strategy. It has complete money management and risk management. Advanced functions to respond to diff

This Expert Advisor can work in three different modes, which can be configured by changing the input parameters. The Expert Advisor performs trading operations based on the signals of the built-in indicator "Digital Filter A". The algorithm of this indicator is based on a highly efficient digital filter. The indicator resembles a moving average, but has one significant difference — the digital filtering algorithm. This algorithm is based on a mathematical model of a digital filter with adaptive
This is a Control Panel for major indicators: ATR, CCI, RSI, RVI, Stochastic and MACD. You have the ability to change any input parameters for each indicator. For example: ATR atrPeriod = 13; atrColor = Yellow; CCI cciPeriod = 13; cciPrice = PRICE_CLOSE; cciColor = Aqua; This indicator will be helpful for those who like to use many indicators before any decision making.
This is a Control Panel for major chart indicators: Moving Averages, Bollinger Bands, Envelopes, PSAR and Fractals. You have the ability to change any input parameters for each indicator. For example:
MA maPeriod = 13; ma_method = MODE_SMA; app_price = PRICE_CLOSE; maColor = Yellow; Bands bbPeriod = 20; bb_dev = 2; bb_Price = PRICE_CLOSE; bbColor = Aqua; This indicator will be helpful for those who like to use many indicators before any decision making.

The [GRAFF] III manual trading system is based on multiple MetaTrader (MT4) indicators. Together, the entire PACK of GRAFF III indicators makes an advanced trading tool. The system consists of over 20 different custom-built indicators which have been carefully selected and tested in the long term to produce strong and efficient trading signals. The particular indicators are based on different mathematical formulas, so the entire system is calibrated to remove false signals from its own indicator

Bears CD HTB Global (Bears Convergence/Divergence High Top Bottom Global) is an analytical bears convergence/divergence indicator (C, D or CD) between a financial instrument and 22 MT4 indicators working on all periods simultaneously. The indicator measures the power of CD for indicators and periods and is the second one out of the two possible versions (HBT and HTB).
Features The analyzer is not a lagging one. It works by ticks and is able to show CD in the main window even in case the MT4 in
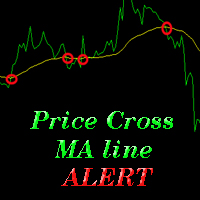
The indicator alerts you when the market price crosses MA line. You can choose any MA line to use via the parameter input tab (see the screenshot below). Parameters (the same as the four parameters you have to choose when you add MA line on a chart): ma_period ma_shift ma_method (0=Simple; 1=Exponential...) ma_apply (0=Close; 1=Open; 2=High; 3=Low...) When the price crosses MA line, it will alert you with a message looking as follows: "Price crossing DOWN MA line, pair: EURUSD Period: 60" or "
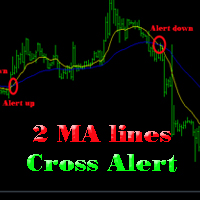
The indicator help you to do alert when two MA lines cross action You can choose all parameters for two these MA lines to use via parameter input tab (see screenshot below).
Parameters Same as 4 parameters you have to choose when you add MA line on chart. Fast MA: ma1_period ma1_shift ma1_method (0=Simple; 1=Exponential...) ma1_apply (0=Close; 1=Open; 2=High; 3=Low...) Slow MA: ma2_period ma2_shift ma2_method (0=Simple; 1=Exponential...) ma2_apply (0=Close; 1=Open; 2=High; 3=Low...) When f
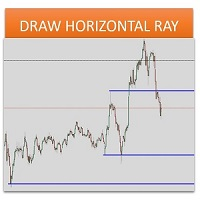
Sometimes we want to draw a horizontal ray from any given price based on a candlestick, and this tool solves that with just 1 key! In order to draw an horizontal ray you just need to drag and drop the indicator over any chart you want and then: 1) Click over ANY candle and then 2) Hit any of the following keys: O - It will draw an horizontal ray right at the OPEN price of the clicked candle H - It will draw an horizontal ray right at the HIGH price of the clicked candle L - It will draw an horiz
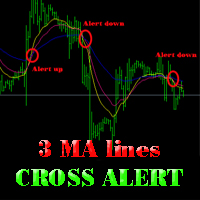
The indicator alerts you when 3 MA lines cross UP/DOWN (see the screenshot below). You can choose all parameters for these 3 MA lines to use via parameter input tab.
Parameters Same as 4 parameters you have to choose when you add MA line on the chart. Fast MA: ma1_period ma1_shift ma1_method (0=Simple; 1=Exponential...) ma1_apply (0=Close; 1=Open; 2=High; 3=Low...) Medium MA: ma2_period ma2_shift ma2_method (0=Simple; 1=Exponential...) ma2_apply (0=Close; 1=Open; 2=High; 3=Low...) Slow MA:

This indicator will be very useful for a research of a trading strategy system. The RSI-ControlPanel is based on the very popular Relative Strength Index indicator. You will be able to change the indicator parameters Period , Apply Price, HighLevel and LowLevel by clicking on the Up ( /\ ) and Down ( \/ ) buttons. Sometimes, when you will open a rarely used currency pair or timeframe the indicator will not show its value. In this case you should use button " 0 ".

"Make it Horizontal puede convertir cualquier linea con ángulo a horizontal. Solo necesitas seleccionar primero la linea que quieras hacer horizontal y después presionar la tecla "H" y listo! tus lineas estarán perfectamente horizontales en un instante! Esta herramienta debe ser arrastrada e incluida en tus gráficos como un indicador, no tiene parámetros de entrada así que sólo arrástrala y listo! Cree esta herramienta porque el MT4 no tiene ninguna funcionalidad incluida que haga esto. Cuantas

Bulls CD LBT Global (Bulls Convergence/Divergence Low Bottom Top Global) is an analytical bulls convergence/divergence indicator (C, D or CD) between a financial instrument and 22 MT4 indicators working on all periods simultaneously. The indicator measures the power of CD for indicators and periods and is the first one out of the two possible versions (LBT and LTB).
Features The analyzer is not a lagging one. It works by ticks and is able to show CD in the main window even in case the MT4 i

This indicator will be very useful for a research of a trading strategy system. The MACD Control Panel is based on the very popular Relative Strength Index indicator. You will be able to change the indicator parameters FastPeriod , SlowPeriod , SignalPeriod and Apply Price by clicking on the Up ( /\ ) and Down ( \/ ) buttons. Sometimes, when you will open a rarely used currency pair or timeframe the indicator will not show its value. In this case you should use button " 0 ".
Get all the moving averages in one indicator. Simple moving average, Exponential moving average, Smoothed moving average, Linear weighted moving average, Double Exponential Moving Average, Triple Exponential Moving Average, T3 Moving Average and MORE. Find in the comments a Free Expert Advisor that uses the XPMA . It will show you how easy to make an EA based on the XPMA (XP MOVING AVERAGE). Settings: Moving Average Type: The Moving Average Type. It can be one of these types: SMA (Simple Moving

The EA created based on this strategy: This EMA crossover trading strategy is made with MACD. For MACD, you can avoid false signals from this EMA crossover. With this strategy, you can get more accurate signals. So this is more profitable .
Strategy required FAST EMA SLOW EMA MACD with default setting How Signals come Buy Signal: When FAST EMA cross SLOW EMA from lower to upper, then you have to wait for MACD confirmation. After crossover, when you see MACD above 0.0 level, then you can take buy

Knowledge of the strength and weakness of each currency is vital for every forex trader. Our Currency Strength Meter indicator measures the strength of eight major currencies (USD, EUR, GBP, CHF, JPY, CAD, AUD, NZD) by using the Relative Strength Index indicator, also known as RSI. The Currency Strength Meter indicator shows you, simply and quickly, when a currency is oversold, overbought, or in "normal area". This way, you can identify which currency is the strongest and the weakest.
Our

The FFx Watcher PRO is a dashboard displaying on a single chart the current direction of up to 15 standard indicators and up to 9 timeframes. It has 2 different modes: 1. Watcher mode: Multi Indicators User is able to select up to 15 indicators to be displayed User is able to select up to 9 timeframes to be displayed
2. Watcher mode: Multi Pairs User is able to select any number of pairs/symbols User is able to select up to 9 timeframes to be displayed This mode uses one of the standard indicat

This EA will help you to automatically put stop loss and take profit for all your orders. Stop loss point and take profit points can be selected in the tab of the input parameters. You can specify three symbols with SL and TP values (you can see symbol1 , symbol2 ... in the input tab below). The EA performs checks. If a new order with symbol1 appears, it puts SL and TP with stoploss1 and takeprofit1 values (in points). If a new order with symbol2 appears, it puts SL and TP with stoploss2 and tak

This indicator is based on the classical indicator RSI (Relative Strangth Index) and will be helpful for those who love and know how to use not a visual but digital representation of the indicator. All TimeFrames RSI MT4 indicator shows values from each timeframe. You will be able to change the main input parameters for each RSI for every TF. Example for M1: sTF1_____ = "M1"; Period1 = 14; Price1 = PRICE_CLOSE.
The utility copies trades from the signal provider accounts (master accounts, one or multiple providers) to unlimited number of receiver accounts (slave accounts). The provider is defined by the 'provider' parameter (any combination of numbers and letters). For example, there are two providers. Run the utility in master mode on them, and set different values to the provider parameter. On the account designated for copying these signals, run two utilities in slave mode in different windows, setti
This indicator shows the lateral movement of the price when the indicator line corresponds to zero and Up/Down trend when indicator line is higher / lower than and parallel to zero-line. Of course, the moment when the indicator line is crossing the zero-line is the best moment to enter the market. This indicator has no input parameters... So, the results will be always the same for every time frame and currency pairs.

The ATR indicator is a helpful tool for measuring the range of bars. It quickly and easily helps evaluate the ATR's current spread (range), which is especially useful for VSA traders. The indicator for classifying the range of bars (candles) uses the moving average and its multiples. Accordingly, the area where the volume is located (relative to the moving average) is labeled as ultra-low, low, average, high, very high, or ultra-high. Our ATR indicator is rendered as a histogram. This indicator
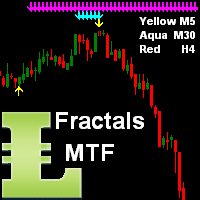
This indicator shows arrows as Support and Resistance from current time frame (Yellow arrows) and 2 higher TF by your choice (TF2 = Aqua arrows, TF3 = Magenta arrows and TF4 = Blue arrows). When all 3 color arrows are appearing in the same place then this is a good time to enter a new position.
Inputs NumOfBars - number of Bars where the indicator will show all arrows; DistanceArrow - you can increase the distance (vertically) between arrows especially on higher TF.

THE [VIZUALIZER] is a MetaTrader (MT4) Script designed to visualize an account history. It will read the account statement and then will visualize the positions on chart in form of rectangles, showing the OpenTime, OpenPrice, CloseTime and ClosePrice. Generally, it has been developed to analyze the trading history, to observe how risky the particular positions were, allowing you to analyze the trading strategy from the account statement. It is working with standard MS Excel CSV files It is visua

[EA] MECHANIC is a MetaTrader (MT4) Expert Advisor designed for use with three basic currency pairs EURUSD, GBPUSD and AUDUSD. With individual settings, it can work very well on any currency pair as well. The EA implements complete, fully functional and exact mechanical trading strategy, with no place for emotions. It is based on standard MT4 indicators "Bollinger Bands" and "Parabolic SAR". The strategy is working on Timeframe M5 only. It is very easy to set up and supervise.
Features It can b

El comercio profesional minimiza las pérdidas en la mayor medida posible. Teniendo esto en cuenta, la EA PROFESSIONAL ADVISOR se ha diseñado con funciones adicionales para minimizar las pérdidas comerciales y obtener así beneficios para usted.
La configuración de EA es adecuada para las transacciones financieras con USDCHN M5, GBPNZD M15, USDHKD M15 , AUDCAD M30, AUDPLN M30, CADCHF M30, NZDUSD M30, EURCHF H1, NZDUSD H1, AUDPLN H1, USDJPY H4, EURCAD H4 , EURUSD H4, GBPUSD H4 moneda de form

MarkerElliottWave is a panel for rapid and user-friendly manual markup of Elliott waves. One can select a color and a font of marks. There are also functions for removing the last markup and the entire markup made by the indicator. Markup is made in one click. Click five times - have five waves! MarkerElliottWave will be a great instrument both for beginners and professional analysts of Elliott waves.
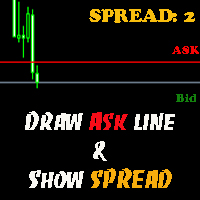
The indicator helps you to draw Ask line on the current chart and show the current spread. So, it helps you to do scalping trade easier. See the video below. It shows you how it works. Parameters line_color – Ask line color
text_size – text size of spread value text_color – color of spread value Thank you! If you have any question, please contact me via Skype: cuongph149, or email: hungcuongkhmt51@gmail.com

Copies transactions between MT4 terminals. Possibilities: quick copy start minimum processor load direct and reverse (reverse) copying. copying Take Profit and Stop Loss levels copying deferred and their changes copy transactions one to many copy trades many to one local copy only Attention: The product is designed for copying trades only within a single computer or VPS with access to the desktop. The product will not work on the built-in Virtual Hosting of the terminal. We will help you set up

Any chart has patterns of consolidation which are also called accumulation patterns. These are sections where the market has been on the same price level during significant amount of time, and thus it was accumulating positions. After such accumulation, positions are distributing, and the market passes from flat into trend. The Consolidation Levels indicator is a professional tool which identifies these sections and builds levels according to the price of the market at the moment of consolidatio
El Mercado MetaTrader es la única tienda donde se puede descargar la versión demo de un robot comercial y ponerla a prueba, e incluso optimizarla según los datos históricos.
Lea la descripción y los comentarios de los compradores sobre el producto que le interese, descárguelo directamente al terminal y compruebe cómo testar el robot comercial antes de la compra. Sólo con nosotros podrá hacerse una idea sobre el programa, sin pagar por ello.
Está perdiendo oportunidades comerciales:
- Aplicaciones de trading gratuitas
- 8 000+ señales para copiar
- Noticias económicas para analizar los mercados financieros
Registro
Entrada
Si no tiene cuenta de usuario, regístrese
Para iniciar sesión y usar el sitio web MQL5.com es necesario permitir el uso de Сookies.
Por favor, active este ajuste en su navegador, de lo contrario, no podrá iniciar sesión.