Robots comerciales e indicadores para MetaTrader 4 - 53

Cross MA Optimiser – Fine-Tune Your Moving Average Strategies in MT4! In the fast-moving world of trading, moving average crossovers are a proven method for identifying trends and trade entry points. However, using the wrong settings can lead to missed opportunities and inefficient strategies. Cross MA Optimiser takes the guesswork out of moving average optimization by automating and fine-tuning your crossover parameters for maximum trading accuracy. Whether you trade with Simple Moving Aver
FREE

The Red Dragons Support and Resistance Levels indicator automatically determines support and resistance levels using the proprietary algorithm based on historical and current data, so the levels are dynamic, which allows you to adjust trading targets based on the current price movement. For this reason, we use this indicator in our advisors, for example, Red Dragons, which you can purchase here:
https://www.mql5.com/en/market/product/128713?source=Site +Market+MT4+New+Rating006
The panel also
FREE

just buy can only buy and do martingale which is calculated safely and can be controlled via the vps server you have, use safe settings What are your reasons for using EA? Has EA been backtested for the past 10 years? You know the Singgihgale system is the worst way of trading ever. A trader must trade like a sniper not a machine gunner. The EA robot with the minggihgale system will be destroyed when the price moves in one direction, for example an uptrend or downtrend when fundamental news rel
FREE

The Mono Waves indicator is designed to display the wave behavior of the market on a chart. Its appearance is presented on slide 1. This indicator uses the PPPC (Point-Percent Price Channel) indicator, which can be downloaded for free from the Market . When the market moves up, the upper border of the price channel is built on High candlestick prices (for more details, see the description of the PPPC indicator at the link given above). The higher the High prices rise, t
FREE

This is a multi time frame demand and supply indicator for MT4 platform. You can use multi time frame demand and supply levels on smaller time frames. Additionally you can choose to kill every level has has been tested. you have narrow bands that is you can select the whole demand and supply level or just a narrow section Finally, you also get price range for the zones. Awesome
FREE

DJ Velocity Rider M15 — Ride the Pulse of Dow Jones DJ Velocity Rider is a next-generation trading strategy developed specifically for the Dow Jones (US30) on the 15-minute timeframe.
It intelligently detects shifts in market momentum and executes high-probability trades with precision.
With adaptive trailing mechanisms, smart Friday closure management, and optimized risk controls, DJ Velocity Rider maximizes opportunities while minimizing exposure. Built for traders who demand speed, control, a
FREE

This is a free version of the EA TrendSurfer OsMa https://www.mql5.com/en/market/product/104264 TrendSurfer OsMa receives signals from a technical analysis of in-built MetaTrader 4 indicator Oscillator of a Moving Average (OsMA) and then implements The Quantum Forex Trading System to generate positive results. Discover: The Quantum Forex Trading System _Mastering the Market with Advanced Algorithms & Multifaceted Strategies_ --- Redefining Forex Trading: In the vast realm of forex, wh
FREE

Coloured Bollinger Bands The Coloured Bollinger Bands indicator is an enhanced version of the standard Bollinger Bands, offering customizable features to suit your trading needs. It uses the classic Simple Moving Average (SMA) as the middle band, and allows you to easily change the appearance of the bands, including the option to select colors and line types, ensuring better visual clarity and adaptability on your charts
FREE

Telegram Forwarder can forward all activities related to trades and position taking as a signal to Telegram messenger. It can also forward indicators' alert to Telegram if you modify indicator code (I can do it for you too) to hand over alerts to Telegram Forwarder. This EA is intended for business and professional usage. You can introduce your own Telegram bot and customize water mark in screenshots.
Telegram forwarder is able to forward signals for "new order", "modification of order", "Pendin

iCUSTOM INDICATOR TESTER es una herramienta para CODIFICADORES, pero no solo. Es un programa diseñado para probar y verificar indicadores personalizados, incluso si, o especialmente, si no tiene un código fuente como archivo .mq4, sino solo un archivo .ex4 compilado.
Los TRADERS pueden probar un indicador y ver si su idea se conecta con los datos del indicador, si la idea está realmente calculada y si es posible crear un EA basado en este indicador en particular. Puede ahorrar tiempo tanto a
FREE

Alerts to Telegram The utility sends Alerts of all your indicators or advisers to a telegram channel (group or personal message). Benefits:
1. There is no need to be at the terminal waiting for an alert from your indicator or advisor; 2. Simple setup.
Currently works with terminal languages:
1.Russian; 2.English. If it is necessary to add your language please let me know. The utility works together with the AlertToFile indicator (put the indicator in the Indicators folder) Indicator: Alert

Long Term trend analyzer according to proprierty Algorithm and multiple EMA. Works best on H1-H4 Time Frame. We are using this indicator in our Main Fund. Ready to use.
- Setup in any Pair, Equity - H1-H4 Timeframe - Best during main Trading times like Asian-European-American Time - NON REPAINTING
Analyze long term trend. Comes with Alarm, Notifications, Push Signals. Get a signal and enter the Markets.
FREE

Session Killzone Indicator
Indicator that helps you to identify the killzone times of both London and NewYork sessions which usually is the most times for high volatility and taking liquidity from the market. Killzone times are configurable through indicator parameters. The indicator adjusts the range of the killzones based on the daily trading range.
FREE

The three white soldiers and the three black crows candlestick patterns are reversal patterns that predict a change in the direction of a trend. The pattern consists of three consecutive long-bodied candlesticks that open within the previous candle's real body and a close that exceeds the previous candle's. It's important to note that both formations are only valid when they appear after a strong uptrend or a downtrend, while their efficiency decreases in choppy markets.
Inputs AlertOn - en
FREE

This is a simple and free Expert Advisor that trades candlesticks. It compares several nearest bars and their volumes, and opens a trade based on that data. Unlike the professional version , it analyzes only 1 timeframe. The recommended timeframes for this EA are H1, H4, D1, it works with any currency pairs. The parameters always need to be optimized before trading, as well as after some period of trading.
Input Parameters Lots - lot size (if Lots=0, then the lot will be calculated based on the
FREE

Quick Close Pro by one click: * Close Buy positions * Close Sell positions * Close Win positions * Close All positions * Close All pending orders To close all positions by one click from your Telegram, please refer Master Close . Thank you! Join my channel here for more useful EAs: - Tele Notify, Price Alert, Equity Alert, Remote Algo OnOff - Auto SLTP, Close Timer
FREE

TIL Multi RSI indicator applies RSI to 28 currency pairs all at once and displays the most current signal of each one in a two-column list. The currency pairs involved are the combinations of the eight major currencies (USD, EUR, GBP, CHF, JPY, CAD, AUD, and NZD). All the currency pairs are sorted automatically from the one with the highest signal down to the one with the lowest signal in a two-column list starting from the top left to the bottom right. Just a quick recap on what the Relative St

Just INDY is a simple, and easy to use trend and reversal indicator. It will continuously monitor the movement of the price actions searching for new trends establishing or strong reversals at extreme overbought, and oversold levels.
Parameters Signal Perios
Sent Notification Please Test it with Strategy Tester and see how it work.
Happy Trading...
FREE

The Tick Data Record is a multi-symbol multi-timeframe Expert Advisor that records tick data for later graphical representation and analysis. General Description
The Tick Data Record offers a(n) alternative/complement to the online/offline price charts displayed through the MT4/MT5 platform. The Expert Advisor permits to write and save the current/history values of Time, Bid, Ask, Spread, Last and Volume to a text file (“.txt”). The idea is to copy/open the obtained register to/in a spr
FREE

A forward-looking EA that combines a Bollinger band and a parabolic indicator. Simple trading based on day trading. The maximum drawdown is a single digit, and the balance forms a clean upward trend. The stop loss value is larger than the take profit, but the winning percentage is profitable.
The maximum number of lots is 0.1. The maximum number of positions is 1. The usage time is 30M.
FREE

Lucky EA Random Outputs Test the EA first in a Demo Account. This EA RUN on a Random Strategie and open Trades per coincidence Strategie. Recommend Broker "IC Market, FTMO”. 1000$/€ 1-5 Lot in first Week, Timeframe M1. DE40 with this Settings only for other Indizes or Pairs please change the Settings appropriately to the actual Spread. You musst for DE40 nothing Change Set the EA to your MT4 Desktop and START. Worktime is from 09:01-18:00 Servertime. Unlimited Default Settings you can Change the
FREE

This simple but useful script calculates the lot in % of the deposit. It is indispensable for risk management. There is only one customizable parameter: MaxRisk - risk in % for lot calculation. The product works as a standard script. Launch it once on an appropriate chart and start trading using the calculated lot value. Genious is simplicity! Happy trading!
FREE

This EA trades using the RSI Indicator. It offers many trading scenarios and flexible position management settings, plus many useful features like customizable trading sessions, a martingale and inverse martingale mode. [ Installation Guide | Update Guide | Troubleshooting | FAQ | All Products ] Easy to use and supervise It implements three different entry strategies Customizable break-even, SL, TP and trailing-stop Works for ECN/Non-ECN brokers Works for 2-3-4-5 digit symbols Trading can be NF

El indicador técnico, en tiempo real, busca velas que su Tamaño excede el especificado en la configuración y da señales. Como regla general, tales velas anormalmente grandes aparecen al comienzo de impulsos fuertes o al final del movimiento direccional del precio. Al comienzo del impulso, la señal puede servir como base para encontrar el punto de entrada, al final del movimiento, es un signo de clímax y puede hablar sobre el final cercano de la tendencia. El Tamaño de referencia para filtrar vel
FREE
ADX
Welcome to the ADX Crossover Trader ================================= The Robot is based on ADX Crossovers. You decide which time frame. The Ea has the following settings Recommended Time Frame EUro / CHF Day On the lower Frames there are too many small trades but its up to yourself. I would recommend to test it on a Cent Account if you are not sure. The Ea has been created by myself and i use it as well for my private trading. The EA has more settings It can be used as Fixed TP and SL T

Indicator Rua Alert Line. This indicator will notify when the High-price of candle breaks any TrendLine or HorizontalLine on the chart. Notifications will be sent to the phone and on MT4. And it have ArrowBuy/ArrowSell on chart. It is very useful for those of you who use the TrendLine or HorizontalLine but do not have time to observe the chart. Timeframe M1 to W1 Symbol: All
FREE

Si te gusta este proyecto, deja una revisión de 5 estrellas. A medida que las instituciones comercializan grandes volúmenes, no es raro que
traten de intentar
defender su posición en niveles porcentuales específicos. Estos niveles servirán como soporte natural y resistencia que usted puede
utilizar
para entrar en un comercio o estar consciente de posibles peligros contra su
posición. Un ejemplo de porcentajes usados comunes son 0.25% y 0.50% en EURUSD para el
semana, puedes ver este ejemplo e
FREE
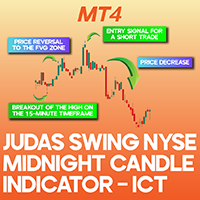
Judas Swing Indicator ICT MT4
The Judas Swing Indicator for MetaTrader 4 is a technical analysis tool designed to detect price reversals. It assists traders in pinpointing ideal trade entries and exits by identifying misleading price movements that often precede significant market shifts. «Indicator Installation & User Guide»
MT4 Indicator Installation | Judas Swing NYSE Midnight Candle Indicator ICT MT5 | ALL Products By TradingFinderLab | Best MT4 Indicator: Refined Order Block Indi
FREE

Indicator description. The “ Alligator Analysis ” ( AA ) indicator allows you to build various (by averaging types and by scales) “ Alligators ” and their combinations, i.e. allows you to analyze the state of the market based on the correlation of this state with a whole range of different " Alligators ". The classic " Alligator " by Bill Williams is based on moving averages and Fibonacci numbers, which makes it one of the best indicators now. The classic " Alligator " is based on
FREE

Esta herramienta no es solo un Asesor Experto, se utiliza para optimizar sus indicadores, para diseñar su propio Asesor Experto, para analizar los buffers de sus indicadores sin tener acceso al código fuente. Busqué durante bastante tiempo cómo podía optimizar mis indicadores sin tener que programar o modificar un experto cada vez. Con esta herramienta, cualquiera puede iniciarse en el diseño de estrategias o incluso tener su propio Expert Advisor personalizado. Puede optimizar tus indicadores
FREE

Comercio de estrategia con bandas de Bollinger y oscilador estocástico
Las bandas de Bollinger se utilizan principalmente para seguir las tendencias.
Uso de la línea principal estocástica y la línea de señal para la compra o venta de órdenes pendientes abiertas
El asesor Auto3M Lite MT4 puede trabajar en un VPS.
Pro version MT4
Pro version MT5
Característica
Sin martingala Stop loss duro y take profit para cada posición Parada final Eliminar orden pendiente automáticamente por intervalo
FREE

This indicator calculates and draws lines over the chart. There are two types of trends: Trend A: the line is drawn using local lows for uptrends and local highs for downtrends Trend B: the line is drawn using local highs for uptrends and local lows for downtrends There are a few conditions, which have to be fulfilled and can be changed by the parameters (see also picture 4): MinBarAge : the count of bars to the last base point of a line is called BarAge and has to be greater than the parameter
FREE

Discover our brand-new Expert Advisor (EA) designed for the MetaTrader 4 (MT4) market: IT Parabolic EA .
This innovative EA harnesses the powerful Parabolic SAR strategy to provide you with an efficient way to maximize your operations in the financial market.
Key features :
Parabolic SAR Strategy : Our EA utilizes the Parabolic SAR strategy, a recognized approach in technical analysis. By relying on the reversal points generated by Parabolic SAR, it identifies trading opportunities to enab
FREE

DSS is similar to Stochastic except for this Indicator we use what is called double exponentially smoothing. This will give the trader a more speedy response to price changes which tends to smooth out the erratic movements of a regular Stochastic. Because its always best to know what the larger timeframes are doing. I have adopted the tactic of overlaying the larger chart of DSS over the smaller chart to gauge whats going on overall and to pint point best entry or exit points. I have left it adj
FREE

The EU_H1_110155136_S_Bi_CF_SQ3 is an algorithmic trading strategy for MetaTrader, tested on EURUSD using the H1 timeframe from April 1, 2004, to April 24, 2024. There is no need to set up parameters, all settings are already optimized and fine-tuned.
Recommended broker RoboForex because of EET timezone.
You can find the strategy source code for StrategyQuant at the link: https://quantmonitor.net/eurusd-biggest-range-pulse/
Key details are:
Main Chart: Current symbol and timeframe Tradi
FREE

This indicator monitors the vital constants of your trading account to keep it healthy and away from excessive risks. It monitors all trades, absolute exposure, account floating point and leverage currently in use, using different color codes for your interpretation. [ Installation Guide | Update Guide | Troubleshooting | FAQ | All Products ] Amazingly easy to understand The indicator is clean and simple It calculates exposure by pairs and currencies Keep your used leverage controlled at all ti

Para la comodidad de los comerciantes, se agregaron muchas funciones que hacen que el comercio sea más cómodo y seguro.
El asesor tiene incorporado un indicador de protección de autor contra la rejilla unidireccional.
Herramientas recomendadas : USDCHF;
GBPUSD;
EURUSD;
USDJPY;
USDCAD;
AUDUSD;
EURJPY;
Mm y ajustes mínimos recomendados: USDCHF , Deposit = 1000$ , Lot = 0.01 , beneficio anual Esperado por instrumento = 15-25% ;
GBPUSD , Deposit = 1000$ , Lot = 0.01 , beneficio
FREE

Live Pivots Indicator Time Frame: Suitable for any time frame. but recommended time frame 30M and above. Purpose of this indicator: Trend Prediction. Buy: When the candle crossed above the golden pivot line its buy call, TP1-R1, TP2-R2, TP3-R3. SELL: When the candle crossed Below the golden pivot line its sell call, TP1-S1, TP2-S2, TP3-S3. Happy trade....
FREE

The indicator helps to determine the potential for price movement within the day and on a trend. For calculations, the average price movement on the instrument is used. If you have a problem setting TP, the indicator allows you not to overestimate your expectations. For volatile instruments, the SL position can also be taken into account. If the entry was in the right place, the risk / reward ratio will prompt a profitable level for profit taking. There is a reset button at the bottom of the sc
FREE

This reliable, professional trade copier system is without a doubt one of the best on the market, it is able to copy trades at very fast speeds from one master account (sender) to one or multiple slave accounts (receivers). The system works very fast and mimics the master account a full 100%. So changing stop losses, take profits, pending orders on the master account is executed on the slave accounts too, like each other action. It is a 100% full copy (unlike many other copiers who only copy ma
FREE

it is hard to do full margin strategy in MT4, because you cannot close all orders easily. Unlock the power of full margin trading with confidence using FullMargin RiskGuard , a cutting-edge Expert Advisor (EA) designed specifically for beginner traders on the MetaTrader 5 platform. Inspired by the renowned trading style of Papip Celebes, this EA empowers users to execute full trade strategies while safeguarding their capital with advanced risk management features. Key Features: MaxFloatingLos
FREE

This indicator uses Moving Average to detect markets trend. It's a very useful tool for manual trading. If line is Midnight Blue, indicator detect up trend. If line is Dark Violet, indicator detect down trend. The readings are very simple to use and understand. Indicator works best on H1 timeframe. You can use this indicator with FollowLine to have more accurate signals.
You can to get source code from here .
Parameters BarsCount —How many bars used to show the line. MAperiods —Period of Movin
FREE

The indicator generates early signals basing on ADX reading data combined with elements of price patterns. Works on all symbols and timeframes. The indicator does not redraw its signals. You see the same things on history and in real time. For better visual perception signals are displayed as arrows (in order not to overload the chart).
Features Easy to use. Filter configuration only requires selection of sensitivity in the " Sensitivity of the indicator " input.
Signals can be filtered using

Use this EA on your Prop Firm challenge to pass with a copy trader Introducing Prop Trader Scalper EA that helps Traders Pass Trading challenges , Recover losses , Trade Live swap free funded acccounts or live personal swap free accounts with it's realistic results and low DD. Prop Trader Scalper EA utilizes a unique High Win Rate strategy where it continuously takes sniper entries few times each week, t his unique strategy allows the EA to optimize its risk management and demonstrates a hi
DMI Show High Low: Visualiza los Niveles Clave del Mercado en Tiempo Real ¡100 % gratis, funcional y sin limitaciones! El DMI Show High Low es una herramienta esencial para los traders, diseñada para mostrar los niveles High, Low y Close de un marco de tiempo seleccionado directamente en tu gráfico. Ideal para identificar zonas clave del mercado, este indicador ayuda a mejorar tu toma de decisiones y la precisión en tu trading. Parámetros : Marco de Tiempo : Selecciona el marco de tiempo para mo
FREE

BB Plus Driverは BB Plus !インジケータ をフルに活用していただくためのEAです。
すべての通貨ペア、タイムフレームで利用できます。BB Plus !インディケーターが無い場合は、ボリンジャーバンドにタッチしてからのリバウンドでエントリーするEAとして稼働します。 10年間のバックテストでは、BB Plus ! インジケータを使用しAUDCAD_M15およびGBPNZD_M5に適用した場合に最も良い結果が得られました。スクリーンショットをご覧ください EAとしての基本的な機能を装備しながら、わかりにくい設定を排除し、初心者の方でも簡単にご利用いただけます
BB Plus ! インジケータ は1分足から使える高精度のスキャルピング用逆張りサインツールです。
・すべての通貨ペア、時間足で利用でき、絶好のタイミングでのエントリー・チャンスをお知らせします ・ ボリンジャーバンドにタッチしてからの反転を 基本戦略とし、 独自のアルゴリズムを加えることで、精度の高い反転ポイントでサインを発信します ・勝敗判定機能により 直近の相場環境に対するこのインディケータの
FREE

The EJ_15_201514104_S_SM_CF_SQ4 is an algorithmic trading strategy for MetaTrader, tested on EURJPY using the M15 timeframe from April 1, 2004, to April 24, 2024. There is no need to set up parameters, all settings are already optimized and fine-tuned.
Recommended broker RoboForex because of EET timezone.
You can find the strategy source code for StrategyQuant at the link: https://quantmonitor.net/eurjpy-awesome-oscillator-master/
Key details are:
MagicNumber: 201514104
Main Chart: Curre
FREE

THIS EA IS A SEMI-AUTO EA, IT NEEDS USER INPUT. Manual & Test Version Please DON'T BUY this product before testing or watching my video about it. Contact me for user support & advices! MT5 Version With this Expert Advisor, you can: Implement your own Zone Recovery strategy to capitalize on trending markets. Create Grid trading strategies, to profit from ranging markets. Place orders easily and clearly. Display your trades/strategies on the chart. Display your Take Profits/Stop Losses as

Realiza la exportación del historial de transacciones de la cuenta comercial actual. El archivo se guarda en la carpeta del terminal MQL4/Files ( que se puede abrir a través del menú principal del terminal: Archivo -> Abrir directorio de datos (Ctrl+Shift+D) e ir a la carpeta MQL5/Archivos) o en la carpeta Common/Files del terminal. El nombre del archivo se genera automáticamente o se configura manualmente a través de los parámetros del script. El archivo de his
FREE

Esta herramienta ofrece dos grandes beneficios: mejora la facilidad de uso de los indicadores económicos de MT5 y permite el intercambio fluido de datos con MT4. Por ejemplo, permite utilizar eficazmente datos de indicadores económicos de hace más de 10 años para entrenamientos y backtesting. Además, es compatible con el PracticeSimulator de MT4, convirtiéndola en una herramienta valiosa para todo, desde practicar operaciones con datos históricos hasta operar en tiempo real en MT4. Aviso importa
FREE

Asesor de indicadores universal para MetaTrader 4 con una amplia gama de funciones, trabajando en indicadores estándar. Creador de estrategias en 1 Asesor Experto. Muchos indicadores comerciales del conjunto estándar de MetaTrader. Posibilidad de elegir 1 de 20 señales y 5 de 20 filtros. Más de cien parámetros para la personalización individual a la medida de sus necesidades. Para cada señal, puede personalizar los parámetros del indicador, seleccionar un período de tiempo y especificar una barr

The indicator is based on identifying engulfing candlestick patterns within the current timeframe. When such patterns are found, it generates buy and sell signals represented by up and down arrows, respectively. However, the user is responsible for determining the prevailing trend. Once the trend is identified, they should trade in line with the corresponding signal that aligns with the trend direction.
FREE

This is my First Project to create EA. Simple MA Cross Fast and Slow with additional High Time Frame Filter. You can set manually to get optimum Result. It's suit for swing Trader that Trade on High Time Frame. ex. H1 / H4 with D1 Filter. Or you can modify It that follow your strategy.
Give me good feedback to improve for better version. Cheers!!
Hurry up FREE download for Limited Time!!
Please test It on Demo account or strategy tester before applied on Live Account
FREE
Forex and Gold OBI is an innovative indicator based on a study of price and market dynamics, utilizing the RSI indicator. This indicator helps you find the best moment to enter the forex market by signaling when the market is in overbought or oversold conditions. Moreover, The indicator calculates two possible targets and the stop loss for each trade, allowing you to optimize your risk/reward ratio. Price This indicator is easy to use and set up, working with any currency pair and timeframe. If
FREE

Expert Advisor uses 2 ATR indicators and Bands for Enter trades. the trades will be closed after interaction with second Band indicator. tested and optimized from 2010 on IFCMarkets. default settings for GBPCAD 15m chart. best performance on ranging markets. can be optimize for trading more symbols and timeframes. EA uses grid and method.
trading deposit: 1000 and higher. This EA operates only once per bar opening. Fast methods of strategy testing and optimization are valid.
FREE

This EA will open Buy and Sell simultaneously after attached to chart. It has customized grouping grid step and lot multiplier group. Please contact me if you have any question. Please Like, Share & Subscribe to my Youtube Channel. I will give this FULL VERSION EA for FREE for everyone if there is 2k Subscriber on my Youtube channel , please ask your friend, because subscribe is FREE :).
Need at least 10k balance (10k cent or 10k$), or you can adjust with various setting inside the EA to get th
FREE

Multi Timeframe Indicator includes a lot of functions and can be considered as a universal helper for a trader. It's main objective is to display up to 10 indicators at a time using just one small brick per each of them. These indicators involve Awesome Oscillator, CCI, DeMarker, MACD, RSI, RVI, Stochastic, Larry Williams' Percent Range, Bulls Power and Bears Power. An important function of the indicator is an ability to monitor signals from different timeframes. You can choose different combina
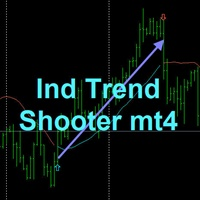
TREND SHOOTER sin alertas
Es un indicador de tendencia basado promedios moviles que calcula de forma muy enficiente los cambios de la direccion del mercado.
este tiene la capacidad de anticipar los cambios de direccion de forma muy adelantada.
CARACTERISTICAS
Este indicador particularmente dibuja dos medias moviles que son utilizadas unicamente para mostrar los cambios de color pueden usar estas medias moviles como deseen ya que no afectan el comportamiento del cambio de color color azul
FREE

Ilanis is and Expert Advisor for stock trading, it can be used for trading on Forex and other markets, including commodities, metals and index markets. To determine the market entry, the EA uses the modern and ultra-light adaptive indicator FourAverage. Principle of position maintaining is similar to that of the popular Forex robot Ilan, using averaging. But unlike Ilan, Ilanis uses an accurate entry into the market. The robot pays a lot of attention to position control, if the price goes in the

This tools is design to easily forecast the projection of the current trend through the inputs of Zigzag and get out of the market when the trend do not the ability to maintain it's volatility to go further... the indicator gets the initial and final price from the value of zigzag automatically by adjusting the intdepth of zigzag. You can also switch from Projection to Extension from the inputs tab of indicator.
FREE

本指标是根据黄金分割理论,分别获取过去22(默认)根K线高低价,并通过黄金分割系数计算得出支撑、压力曲线。 当价格第一次向上靠近压力线,或者多次靠近压力线时,会出现向下的箭头符合,提示有压力,适宜做空sell; 当价格第一次向下靠近支撑线,或者多次靠近支撑线时,会出现向上的箭头符合,提示有支撑,适宜做多buy; 在数据窗口,会提示各条支撑、压力线的价格数值,出现的箭头符合数值为up、down。
这个指标,适合在所挂的图表里做短线,也即进场开仓后,持仓几根K线柱,然后可以平仓。做多的话,止损可以在支撑线下方,止盈在压力线附近。做空的话,止损可以在压力线上方,止盈在支撑线附近。
本指标涉及的黄金分割系数分别为0.382、0.618、1.618、2.168、4.236,计算得到对应的支撑压力线。 由于MT4的指标数量有限,本指标分成了2个EX4文件,第一个的黄金分割系数为0.382、0.618、1.618,第二个为2.168、4.236,第二个文件名为“Golden Ratio Support Pressure Indicator extend”,可免费下载和使用。
FREE

This indicator demonstrates that the price change of financial instruments is NOT a random walk process, as advocated by the "Random Walk Hypothesis", and as popularised by the bestselling book "A Random Walk Down Wall Street". I wish that were the case! It is shown here that the real situation with price change is actually much worse than a random walk process! Deceptive market psychology, and the bulls-bears tug of war, stack up the odds against traders in all instruments, and all time frame
FREE
This indicator displays the historical spread values on the chart. This is an extremely useful tool for watching the spread rise and fall, allowing you to enter the market at just the right time. This indicator will help you stay out of the market when the spread begins to rise and help you get into the market as the spread begins to fall again.
ON SALE FOR FREE, GET IT FREE FOR A LIMITED TIME ONLY
FREE

Creo que todo el mundo conoce una regla de administración de dinero como"Caja fuerte". Para aquellos que no saben, la Caja fuerte implica el cierre de la mitad de la posición después de que el beneficio de la transacción se haya nivelado con el Tamaño de la parada. Por lo tanto, incluso si el precio se invierte y se aferra al Stop, Ya no perderá dinero, ya que se obtuvo exactamente el mismo Tamaño de beneficio al cerrar una parte de la posición anteriormente.
Safety Advisor tiene solo una conf
FREE

This indicator allow you to measure Profit/Loss of current, closed or future trade in account currency and estimate margin level at the trade close point. Profit/Loss indicator is based on MT4 native Crosshair instrument and has following inputs: Trade Direction = Buy/Sell Lot size = 0.1 Font size = 8 Font color = DeepSkyBlue Offset horizontal Offset vertical
FREE

This indicator will show yesterday and today high low, very useful to understand the market sentiment. To trade within the range/ break out. Previous day low- can act as support- can used for pull back or break out Previous day high- can act as resistance- can used for pull back or break out The previous day high low breakout strategy refers to the day trading technique that provides traders with multiple opportunities to go either long or short . The main idea is to identify the trend in its m
FREE

1. Compound Drawings (1) Line segment with arrow (2) Continuous line segment (broken line) (3) Parallelogram (4) Polygon (5) Profit and loss ratio measurement tools
2. Backtracking By the Z key in the process of drawing the line Line types that support Z-key backtracking: continuous line segments (broken line) ,channels,parallelograms,polygons, and fibo extensions.
3.Automatic Adsorption (1) Click the "Lock-Button" to switch the automatic adsorption switch before drawing the line (2) The

This indicator is designed for calculating the value of points for the specified lot sizes. The MT5 version is here https://www.mql5.com/en/market/product/29230 Description by lines Line 1 - deposit currency. Line 2 - lot size (10 input parameters) . All further values are calculated into columns below each lot size. Line 3 - calculation of value for one point. Line 4 - calculation of value for spread. All subsequent lines - calculation of value for points (20 input parameters) . All you need t
FREE

The indicator can be used with any time frame and forex pair. One easy to use parameter in the indicator will allow you to adapt the signals to any forex pair and time frame you want to trade.
The Arrows DO NOT REPAINT !
Information Panel: We've equipped this indicator with a user-friendly Panel. one side of the panel, the time frame is displayed, while on the other side, the currency pair is shown. Below that, the direction of the trend is identified, showing whether it is an uptrend or a d

The Sextet is an MT4 indicator that displays 6 levels of Moving Averages, where the second is the moving average of the first, the third of the second, and so on. It gives a signal when all the moving average levels align in order. Get a Free Sextet EA, and read discussions about using The Sextet Indicator on Forex Factory:
The Sextet EA @ Forex Factory Check out the The Sextet Scalper Pro for a more elaborate scalping strategy also with Free EA . Key Features: Is a Moving Average of a Movin
FREE
El Mercado MetaTrader es la única tienda donde se puede descargar la versión demo de un robot comercial y ponerla a prueba, e incluso optimizarla según los datos históricos.
Lea la descripción y los comentarios de los compradores sobre el producto que le interese, descárguelo directamente al terminal y compruebe cómo testar el robot comercial antes de la compra. Sólo con nosotros podrá hacerse una idea sobre el programa, sin pagar por ello.
Está perdiendo oportunidades comerciales:
- Aplicaciones de trading gratuitas
- 8 000+ señales para copiar
- Noticias económicas para analizar los mercados financieros
Registro
Entrada
Si no tiene cuenta de usuario, regístrese
Para iniciar sesión y usar el sitio web MQL5.com es necesario permitir el uso de Сookies.
Por favor, active este ajuste en su navegador, de lo contrario, no podrá iniciar sesión.