Robots comerciales e indicadores para MetaTrader 4 - 281
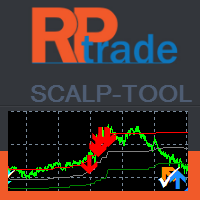
Scalp Tool es un indicador de contra tendencia muy eficiente.
Está diseñado para ser utilizado por cualquier persona, incluso el novato completo en el comercio puede usarlo. Scalp Tool no vuelve a pintar. Las indicaciones se dan de cerca a cerca o de cerca a un nivel visible. La herramienta Scalp se puede usar sola, no se requieren otros indicadores.
La herramienta para cuero cabelludo indica Dónde abrir sus operaciones. Cuándo cerrarlos. Dónde colocar órdenes stop. Con una precisión supe

The indicator displays Renko bars on the chart, plots two moving averages by them and generates buy/sell signals based on the conditions displayed in the screenshots and described below: the buy signal is formed if the fast moving average is above the slow moving average, from 4 to 10 consecutive bullish Renko bars are displayed, followed by no more than 2 bearish and one bullish Renko bars; the sell signal is formed if the fast moving average is below the slow moving average, from 4 to 10 conse
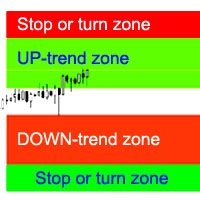
El indicador calcula las áreas de parada / inversión de tendencia más probables, áreas de movimiento de tendencia confiables.
El cálculo considera:
la tasa de cambio de precio; el ángulo de desviación relativa del gráfico; la amplitud media de los movimientos de precios; el precio sale de su "zona de confort"; los valores del indicador ATR. El indicador puede generar una Alerta cuando el precio ingresa a un área de parada / reversión. Ajustes ¿Dibujar toda la longitud? - dibujar las áreas h
This multi-currency EA uses an adaptive grid strategy. It is designed for maximum effective real trading in today's market conditions. This trading robot analyzes the price action, price speed and direction. It does not require special conditions, does not depend on the trading account type, the broker, or the financial instrument. The function - total trailing stop of open position by equity in the deposit currency, points or as a percentage of profit allows to favorably close the order basket.

Multi-currency EA that works based on the economic calendar using an adaptive grid strategy. It is based on the price movement with no roll-backs. When the price moves a defined distance without changing a direction, the first trade is opened in the direction of the price movement. During the news release the EA closed untriggered pending orders and resumes its operation after the specified time runs out. The EA does not require special conditions, does not depend on the trading account type, th

The library is dedicated to help manage your trades, calculate lot, trailing, partial close and other functions
Orders CloseallSell CloseallBuy CloseallOpen DeletePending DeleteAll: Close All Market Orders and delete all pending orders. CheckOpenBuyOrders: return the count of buy orders. CheckOpenSellOrders: return the count of sell orders. CheckOpenOrders: return the count of market orders. ModifyOrder DeleteOrder CloseOrder OpenOrder
Lot Calculation Mode 0: Fixed Lot. Mode 1: Martingale Lo

Este indicador está basado en la metodología del Market Profile, que contiene el Z-Zone , a diferencia de este último, permite la visualización de múltiples marcos de tiempo en un mismo gráfico. Esta metodología ha mostrado ser muy efectiva para: Disminuir el número de ventanas para analizar o hacer seguimiento a un activo. Visualizar zonas importantes de resistencia (RoZ), soporte (SoZ) y distribución media (PoC) en diferentes periodos de tiempo. Definir zonas para tomar utilidades y ubicar s

The Illusion EA uses the probability theory - after a series of consecutive virtual losses - i.e. right during a flat the EA already starts trading in the trend. In addition, the EA considers the ratio of bullish/bearish candles on the higher timeframes to determine the greatest probability of the price movement direction. Only 1 order can be opened at a time. In case of a loss the following order will be placed with an increased lot (the multiplication coefficient is set in the parameters). The
Tipu Parabolic SAR Dashboard is based on the Tipu Parabolic SAR indicator. Please contact me here at MQL5 if you would like to use this panel for your custom signals. Tipu Parabolic SAR Dashboard is a multi-currency, multi-timeframe panel created to help traders in analyzing the markets quickly using the Parabolic SAR indicator signal. The dashboard panel is designed to help traders quickly change symbols and periods. If you are constantly missing trade opportunities while browsing through the

The EA detects strong movements using the Parabolic indicator and opens a trade. The Commodity Channel Index (CCI) is used as an auxiliary indicator. The CCI levels may depend on the ADX indicator values, which allows for better trading with different volatility. Also, the trades are opened depending on the RSI indicator values on a certain timeframe. Recommended timeframes: M5, M15, M30. Make sure to optimize the parameters of the EA for your account before trading.
Input Parameters Lots - lo

A simplistic indicator informing a user on RSI divergence by sending messages to mobile device and email. The indicator draws 2 vertical lines, marking two RSI extrema that formed the divergence. You get the alert, open the charts and make a decision. The indicator does not show past divergences, thus when you attach it to a chart for the first time you see nothing. Graphics and alerts will appear as soon as divergences do. Drop it in Tester to see how it works. Parameters: RSIPeriod - number of

Taranus is a multifunctional EA, a universal assistant to a trader, designed to work under the control of a trader. The EA has a large set of tools and can work: by indicators, by trading levels, by trend lines, by martingale strategy, trade on news. It has: several filters to determine the trend, a multi-level risk management system, money management, virtual stop loss, universal trailing stop, can work with any type of orders. Set files and a guide to the Taranus EA can be found in the "Commen
Automatic lot calculation per stop level: calculates the lot considering the risk. It is possible to enter a percentage of the deposit and set the line to the planned stop level. As a result, the lot for entry will be calculated. Also, the TakeProfit level will be calculated taking into account the profit/loss ratio, and their profit/loss in the deposit currency. Thus, the final result of the trade can be seen, which is an integral part of successful trading.
Features The indicator displays th
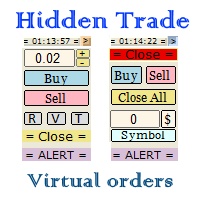
Small trading panel for managing orders and positions in 1 click for MetaTrader 4 Version for MetaTrader 5 here Set hidden TakeProfit, StopLoss and pending orders at lines placed on the chart Work on time on the news Backtesting manual strategies in the tester Placing virtual orders Playing a sound signal when the price reaches a level Automatic closing of all positions on the account or symbol by the total take profit in the deposit currency
Description Can be dragged to any part of the chart
El indicador de correlación y divergencia de pares de divisas: todos los pares en el mismo gráfico de precios. Muestra todos los pares que están abiertos en el terminal.
Versión MT5
Ventajas Los operadores que utilizan estrategias de negociación de múltiples divisas pueden observar visualmente el movimiento de precios de los pares seleccionados en el mismo gráfico de precios para comparar los parámetros de su movimiento. Esta es una versión avanzada y extendida del indicador OverLay Cha
Reanimator Robot de comercio semiautomático. Para abrir / cerrar posiciones, use los botones. El seguimiento adicional de la posición se realiza automáticamente de acuerdo con el nivel de beneficio virtual. También se utiliza un sistema de promediar posiciones no rentables con un lote reducido / aumentado. El control de botón del asesor en el probador de estrategias no funciona; el asesor se puede probar completamente solo en una cuenta de demostración o real. En el probador de estrategias, el

The CCI FIBO trend indicator displays the real sentiment of the market. Does not redraw. The CCI FIBO indicator is based on the processed values of the standard CCI indicator. The indicator is able to display the slowing\reversal of the price during the trend movement (for exiting the position, and with some experience to display the opening in the opposite direction, for example, to use in scalping). It shows spikes in a flat. The idea of the indicator was that there are indicators that are goo

The indicator displays a matrix of indicators across multiple timeframes with a sum total and optional alert. Custom indicators can also be added to the matrix, in a highly configurable way. The alert threshold can be set to say what percentage of indicators need to be in agreement for an alert to happen. The alerts can turned on/off via on chart tick boxes and can be set to notify to mobile or sent to email, in addition to pop-up. The product offers a great way to create an alert when multiple
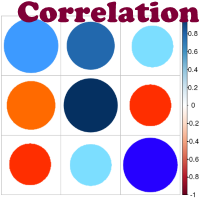
Advantage The analyzer provides an opportunity to examine correlation in history, for example, for the previous month excluding the current one, thus allowing you to evaluate symbol movement in history. It can be conveniently used in conjunction with LineSyncMirrorChart analyzer. Charts are synchronized by a market type: Forex, CFD, Futures, and Indices. The analyzer calculates the distance covered by the price on a specified period in points. The tool fits pairs and portfolio traders.
Descrip
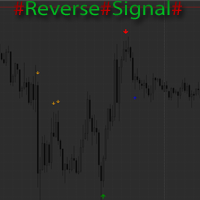
The indicator marks the estimated market reversals in the form of arrows. The indicator is able to detect 3 types of reversals. The primary reversal signal. It is a stronger and more important reversal. Denoted by the largest arrow. Alternative signal - additional signal without additional filters in contrast to the primary. Suitable for scalping on small timeframes. A mixture of the primary and alternate reversals, but with the addition of the trend filter. Also shows good results on small time

CIS is designed for trading a basket of correlating currencies, as well as single instruments: indicators
VSA indicator which draws arrows (does not redraw). Its signals indicate the price reversal on a calm market or decrease of the rise or fall rate during strong movements. Works fine in the flats. As the indicator uses volumes in its calculations, be careful during evenings and night times, when there are very small volumes. It is recommended to be used only on multiple currencies or at l

As the proper trading using CCI indicators requires the trader to monitor multiple timeframes and CCI indicators with different periods. For example - monitor the trend using CCI with the period of 100 or 200 ( slow CCI period ) on the H4 timeframe, and make entries based on the CCI with the period of 13 ( fast CCI period ) on the H1 timeframe. To facilitate this task, the Delta CCi MTF7 indicator was created, which implements monitoring the changes of the price movement trends as well as marks

El Z-Zone hace parte de una suit de 4 indicadores llamada las Z-Tools Black que puedes comprar por separado en el Market MetaTrader. El Z-Zone esta basado en el Perfil del Mercado (Market Profile) y está compuesto por 3 líneas dinámicas: En la parte superior se encuentra la Zona de Resistencia, que identificaremos como el RoZ . En el centro encontraremos la distribución media de la zona que identificaremos como el PoC . En la parte inferior se encuentra la zona de soporte que identificaremos co

The Five Minutes indicator is a ready TRADING SYSTEM for binary options. The system is designed specifically for the EURUSD M5 currency market with at least 80% payout and for trades who operate on the web-terminals and the MetaTrader 4 platform. This is a counter-trend system, i.e. it expects the price of traded asset to reverse. Signals of the system are not redrawn, they appear once the formation of the previous bar is completed, and are equipped with a sound notification. For decision-making

This panel is a part of the SupDem-Pro trading system and is used to search for the best opportunities for any available instruments. Which can be selected manually in the Market Watch (open it with CTRL + M). Using this trading panel in combination with ShvedSupDem-Pro_Zone allows to analyze multiple currency pairs with a single click. The panel allows to load any instruments from the Market Watch, from 6 major currency pairs up to all instruments (480).
The indicator parameters Button Width

El Z-Compass hace parte de una suit de 4 indicadores llamada las Z-Tools Black que puedes comprar por separado en el Market MetaTrader. El Z – Compass es uno de los indicadores más importantes, ya que sirve de brújula en el mercado y está compuesto por los siguientes elementos: Un histograma y una línea cero. El histograma se grafica con cada vela y varía según el marco de tiempo seleccionado. Cuando el histograma se encuentra por arriba de la línea cero, decimos que la tendencia ó el momentum e

El Z-Beat Zone hace parte de una suit de 4 indicadores llamada las Z-Tools Black que puedes comprar por separado en el Market MetaTrader. El Z-Beat Zone se muestra como dos líneas. La línea principal se llama SlowK. La segunda línea, llamada SlowD. La línea SlowK se muestra como una línea sólida gruesa y la línea SlowD se muestra como una línea solida delgada. Hay varias maneras de interpretar el Z-Beat Zone. Los tres métodos populares son: Comprar cuando el Z-Beat Zone (La línea SlowK) cae por
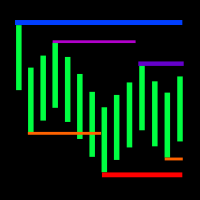
The indicator displays the fractal levels of one,two or three different higher timeframes starting with the current one. When a new fractal appears, a new level is plotted. The indicator can be used for visual analysis of the current chart and applied in an EA. If more levels are needed, start a new instance of the indicator.
Features Timeframes to choose from. For example: M1, M2, M3, M20, H2, H3, H12. If a timeframe smaller than the current one is selected in the settings, the level of the c

It is good to know the presence of a trend on multiple timeframes at once. And even better - on multiple currency pairs at once. This indicator allows to quickly determine the presence of a trend or a flat on 8 timeframes and from 1 to 15 currency pairs at once. Multi Alligator Signals analyzes the signals of the Alligator indicator by Bill Williams on every timeframe (from M1 to W1) and multiple currency pairs (up to 15) simultaneously. If there is a buy signal, a green upward arrow is drawn, i

Two Dragon is an advanced indicator for identifying trends, which uses complex mathematical algorithms. It works in any timeframe and symbol. Indicator is designed with the possibility to customize all the parameters according to your requirements. Any feature can be enabled or disabled. When a Buy / Sell trend changes the indicator will notify using notification: Alert, Sound signal, Email, Push. МetaТrader 5 version: https://www.mql5.com/en/market/product/14906 Parameters Max_Bars_History —
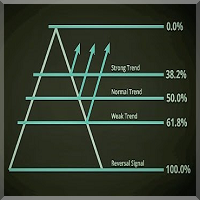
Introducción El indicador Fibonacci Level Professional es una gran herramienta para el comercio diario como complemento a otros indicadores para una mejor confirmación de las configuraciones comerciales y hacia dónde tiende a moverse el mercado. Este indicador es fácil de configurar y funciona en todos los pares de divisas y marcos de tiempo, se recomienda M15-W1.
El propósito de este indicador es mostrar los niveles de Fibonacci en el gráfico, las líneas diaria, superior e inferior. Como fun

Advanced and affordable momentum indicator that fade the fake move of market. It is smoothed because of special sophisticated exponential averaging calculation. It is also similar to special type of CCI with more tolerance to overbought or oversold conditions with built-in momentum indication. This indicator is able to empower your trading as a trend detector, CCI and market momentum scale measurement.
Features Smoothed to filter uncomfortable noises. Non-Lagging Exponential averaging. Line or

Some experienced trades can tell where the price will go even without indicators, as the direction of the price can be found using the ordinary candlesticks. The EA compares several nearest bars and their volumes, and opens a trade based on that data. Also, it is able to analyze the candles on two timeframes at the same time to make the entry more accurate and less risky. In addition, the EA can automatically determine the take profit and stop loss size depending on the size of the previous cand

Este simple script borra todos los objetos en el gráfico mientras que mantiene un registro de los mismos para poderlos redibujarlos usando nuestro script gratuito Objects Show . Para aplicarlo, solo arrastre y suelte el script sobre una gráfica donde desee ocultar (borrar) todos sus objetos Usando la combinación de scripts Objects Hide y Objects Show, usted puede ocultar (borrar) y posteriormente mostrar todos los objetos de un gráfico. Este script no tiene soporte completo para objetos relacio

This innovative technical indicator was created to detect quiet market period before the beginning of the high volatile market. Like many good technical indicators, this Market Activity Index is very stable and it is widely applicable to many financial and non financial instruments without too much restriction. The Market Activity Index can be used best to visualize the alternating form of low and high volatile market. It is very useful tool to pick up the quiet market but ironically this is the
Smart Advisor Calculation is designed for a very interesting method that is able finally to give the martingale a new positive way! At startup the Expert Advisor sets virtual orders and trades like the real deal. As soon as the drawdown of virtual orders reaches the set number, the robot immediately enters the market for real orders! Thus the price is going without setbacks such as 30-70 pips, with great probability will kick back at the entrance to the market! This is used by a robot! If the pr
It is based on Surfing strategy. DOES NOT USE MARTINGALE. The EA catches the moments when the previous candle crosses the moving average indicator and eliminates the false breakouts using the RSI+MA indicator, and at the same time analyzes the trend direction. The EA trades pending orders, which also allows to avoid false movements. If the pending order was not triggered and the chart reversed, then the EA deletes the pending order. Also, according to the strategy, the EA uses the Trailing Stop,
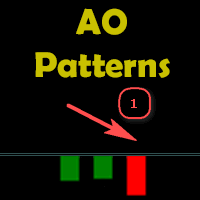
The indicator displays a formed pattern of the AO (Awesome Oscillator) indicator at the signal bar according to the "Profitunity" strategy by Bill Williams. The patterns differ in colors, location and number. The indicator can notify the user about the appearance of a new pattern. It is important to remember that you must not use the signals of the "АО" indicator until the appearance of the first buy/sell fractal outside the alligator mouth.
Types and designation of the patterns Buy 1 - "Sauce

Delta Pairs is an indicator for pair trading, it displays the divergence of two currency pairs. Does not redraw. A useful tool for the analysis of the behavior of two currency pairs relative to each other.
Purpose The Delta Pairs indicator is designed for determining the divergences in the movements of two currency pairs. This indicator is displayed as two line charts and the difference (delta) between these charts in the form of a histogram. The Delta Pairs indicator will be useful for those
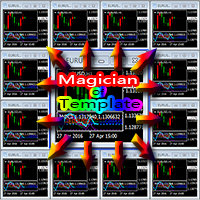
Everyone has their own style, for example, color of candle, color of chart blackground, used indicators, EAs, and script tools etc. If you often use a template to load your favorite style, you should already know that manual loading is cumbersome when using multiple charts. Now, you can use this tool to work better and faster. Magician Of Template (MOT) is a utility script tool for MetaTrader 4. After attaching the script to a chart, one template will auto load to all charts. The template should
The EA creates an order grid using labels. Opening and closing of the grid is done either automatically by the system signals or manually. In the same grid can be both Limit and Stop orders. It is possible to reverse the grid on specified condition. You can enter the breakdown/rebound from established levels. All types of Sell limit, Buy limit, Buy stop, Sell stop orders are supported. The grid is rebuilt with a single click. The stop loss and take profit lines can be easily modified. You are fr

XMaya Scalp ZR Series is a fully automated Expert Advisor designed for Traders. XMaya Scalp ZR Series is a robot trader with multi-currency scalper Expert Advisor. This robot trades on any Time Frame, Can be use on all pairs but not for use on XAU/GOLD . The system is ready-to-use with the setup is simple, with simple optimization on Take Profit, Stop Loss, and Trailing.
User-Defined Variables OrderCmt - used for comments Magic - Magic Number to identify the order's mode for the EA. TargetProf
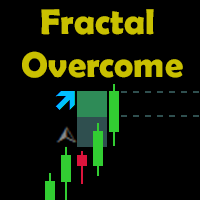
Indicator Description The indicator shows the breakout of the last fractal in real time. It considers the buy fractals above the balance line and sell fractals below the balance line (according to the Bill Williams' strategy), and also the fractals that are independent of the balance line. The direction and the distance of the fractal level breakout are displayed in real time. When a candle closes outside the suitable fractal, the levels of the specified offset, the distance to the candle closur
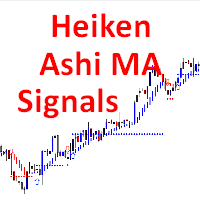
This is a fairly well-known indicator that smooths the market price fluctuations and allows you to see some hidden aspects of its movement. Generally, the indicator does not require additional explanations. However, please note the ability to enter (exit) the market the next candle after the one, at which an opposite signal was actually generated. Suppose that the market reverses from rise to fall. The indicator signals mark the possible position entries after crossing the BUY STOP or SELL STOP

Master Trend Dashboard is a new generation indicator, compact, light and efficient. Each element of this Dashboard is designed to return specific signals as: Price Action, Breakout, Net Change (performance of the instrument), algorithmic studies, correlations and statistical calculations. This tool will change your way of trading allowing you to receive important information. See the Graphic Signals to understand every single signal below:
Graphic Signals Symbol name and arrow color Green = Cu
Volume Levels is a very important indicator for exchange trading. Most of the trades were performed on those levels. This indicator displays the price level that had the most trade volumes over a certain period of time. Often, the price bounces from those levels in the future, and it can be successfully used in trading. It works on any currency pair.
Parameters HistoryBars - the number of bars to determine the near volume levels; Range - the maximum distance above and below the current price t

This scalper Expert Advisor uses instant execution pending orders. No grid and martingale. Each trade is protected by a tight stop loss. It is designed for 4-5-digit quotes. The EA is recommended for use on EURUSD, GBPUSD, AUDUSD, USDJPY, USDCHF, USDCAD, NZDUSD, EURJPY, EURGBP, and EURCHF. VPS is required for flawless operation, minimum deposit is 100 units of the base currency. Timeframe – from M15 to H4. Optimization tip! Only several parameters should be optimized for the period of the last f

The BOSS (Binary Option Super System) indicator is a ready TRADING SYSTEM for binary options. The system is designed specifically for the currency market and for the traders who operate on the web-terminals and the MetaTrader 4 platform. This is a counter-trend system, i.e. it is based on the assumption that the price of a traded asset revert sooner or later, and the final trade will cover the previously incurred losses and make a profit. Signals of the system are not redrawn, they appear once t
TMA Simplemartin Expert Advisor is based on TMA channel indicator, as well as Stochastic and CCI standard indicators. A market entry is performed according to indicators' aggregate signals using stop levels and trailing. A deposit is a part of the trading system. This is a martingale. Both arithmetic and geometric progressions are available. Besides, the EA features the function of recovery from a loss (TMA compiled into resources).
System settings averaging included – enable averaging. averag

DS Arrow is a simple indicator for buying/selling in MetaTrader 4, This straightforward indicator shows the market entry points. Perfect for both beginners and professionals. Designed for working only with the H1 timeframe, the indicator will not be displayed on other timeframes. Recommended currency pairs: GBP-USD, EUR-USD, USD-CAD, AUD-USD, USD-JPY, NZD-USD. Works with both4-digit and 5-digit quotes. This indicator does not redraw its signals.
Features The entry is made when the hourly candl

This is a grid EA that trades on all timeframes, pairs and instruments. You are to desire where and how to use it. The EA uses a four level system for signal confirmation, which allows you to filter out false market entry signals. 3 indicators are used for trading. Having received a signal to enter the market, the EA opens a Market Execution order, which is closed by TP. The EA uses martingale, to reduce the risk it is possible to automatically decrease or increase of the martingale multiplier.

The indicator displays ZigZag lines from a higher timeframe (see the example in the screenshot). The red thin line is the current timeframe's ZigZag, while a thicker yellow line is the higher timeframe's one. The indicator is repainted as the data is updated.
Parameters
Depth, Dev, Back - ZigZag parameters; BarsCount - amount of processed bars (reduces the initial download time and decreases the load when using in an EA); TimeFrame - indicator timeframe (cannot be lower than the current one).

The indicator detects and displays 3 Drives harmonic pattern (see the screenshot). The pattern is plotted by the extreme values of the ZigZag indicator (included in the resources, no need to install). After detecting the pattern, the indicator notifies of that by a pop-up window, a mobile notification and an email. The indicator highlights the process of the pattern formation and not just the complete pattern. In the former case, it is displayed in the contour triangles. After the pattern is com

The indicator detects and displays Cypher harmonic pattern also known as Anti-Butterfly (see the screenshot). The pattern is plotted by the extreme values of the ZigZag indicator (included in the resources, no need to install). After detecting the pattern, the indicator notifies of that by a pop-up window, a mobile notification and an email. The indicator highlights the process of the pattern formation and not just the complete pattern. In the former case, it is displayed in the contour triangle

The indicator detects and displays Shark harmonic pattern (see the screenshot). The pattern is plotted by the extreme values of the ZigZag indicator (included in the resources, no need to install). After detecting the pattern, the indicator notifies of that by a pop-up window, a mobile notification and an email. The indicator highlights the process of the pattern formation and not just the complete pattern. In the former case, it is displayed in the contour triangles. After the pattern is comple

RSI Breakout Dashboard is a tool for multiple currency pairs analysis at the same time in terms of breakout (return) from Oversold or Overbought Zone to Neutral Zone.
All displayed and used by indicator symbols are free to choose and are specified using a space separated list in parameters, so you're able to analyze not only predetermined ones, but everything that your broker offers, also commodities, equities, indices, ones with prefixes, suffixes etc.
You can choose 3 types of al

Found a great signal, but a provider's lot is too small? You need larger position volume, but terminal settings are too poor? SignalLotEnlarger will increase the provider's position volume by means of a duplicate order of the needed volume. Just set a lot size and a name of a signal for copying orders from. This is the version with extended functionality, the lite version can be found here: https://www.mql5.com/en/market/product/8117
With the Pro version you can:
disable copying new orders f

The indicator detects and displays the White Swan and Black Swan harmonic pattern on the chart according to the scheme provided in the screenshot. The pattern is plotted by the extreme values of the ZigZag indicator (included in the resources, does not require additional installation). After detecting the pattern, the indicator notifies of that by the pop-up window, a mobile notification and an email. The indicator highlights not only the complete figure, but also the time of its formation. Duri

The indicator detects and displays the AB=CD harmonic pattern on the chart according to the scheme provided in the screenshot. The pattern is plotted by the extreme values of the ZigZag indicator (included in the resources, does not require additional installation). After detecting the pattern, the indicator notifies of that by the pop-up window, a mobile notification and an email. The indicator highlights not only the complete figure, but also the time of its formation. During the formation the
Grid robot that maintains every open position opened by the trader. The buttons on the screen are used for opening the initial trade. The yellow labels display the price of total breakeven for each grid. The light blue labels display the level of total take profit for orders of each grid. The take profit is virtual. With each subsequent opened order the take profit of the grid is adjusted to get the total profit in the sum of the profit of the initial order, regardless of the size of all lots in

Be notified of every color change of Heiken Ashi (HA) candles. The indicator will trigger past and new signals every time that HA candles change their colors. Note : this tool is based on the code of Heiken Ashi indicator developed by MetaQuotes Software Corp.
Features The signals are triggered at closing of last bar/opening of a new bar; Any kind of alerts can be enabled: Dialog Box, Email message, SMS notifications for smartphones and tablets, and Sound alerts; By default, up arrows are plot
Oscillyator 3TF displays data on standard oscillators (RSI, MFI, STOCH, CCI, DeM, Momentum) on the current and two following timeframes. The modified version of Price Reversal oscillator is also added. The indicator allows you to track the situation on higher timeframes and select suitable entry points when oscillator lines are in oversold/overbought zones. The indicator may notify of all three lines located in specified zones via alerts, emails, and push notifications.
Parameters
Period – in

The indicator detects and displays the 5-0 harmonic pattern on the chart according to the scheme provided in the screenshot. The pattern is plotted by the extreme values of the ZigZag indicator (included in the resources, does not require additional installation). After detecting the pattern, the indicator notifies of that by the pop-up window, a mobile notification and an email. The indicator highlights not only the complete figure, but also the time of its formation. During the formation the f

Volumes are one of the most important factors of trading, as it is the high volumes that move the market in either direction. But there are very few standard indicators for volumes in MetaTrader 4. The Volume Candles analyses the volumes of the trades and displays candles depending on these volumes. The candle appears once the required number of volumes has passed during trading (the VolumeCandle parameter). If the candles close frequently and are thin, then the volumes on the market are current

New version of the semi-scalper multicurrency Expert Advisor that uses an advanced adaptive trading strategy based on a position averaging. It uses a completely different strategy for market entries. The new version features a new function – total trailing stop of the opened positions by equity in the deposit currency or as a percentage of profit. A virtual trailing stop can be applied to the first opened trade. A stop loss can be used to protect the capital. The product is designed for 4 and 5-

The indicator calculation is based on the analysis of the price characteristics of bars and is adjusted by the ATR value. The degree of the ATR influence is determined by the ratio. The color scheme of the indicator depends on the direction of the current trend. A change in the trend is displayed by an arrow and a corresponding message. Depending on the strategy chosen by the trader, this indicator can be used to generate market entry signals, to place stop loss or close trades, and can also be

Arrows appear after Reversal-Pattern and when the confirmation-candle reaches its value, it won't disappear (no repaint). but with fix settings no additional settings necessary Entry : immediately after arrow Stop loss : a few pips above the high of the arrow - candle / below the low of the arrow - candle Take Profit : at least the next candle / move to break even after candle closed / trail the SL works on : Major Forex-pairs / M15 and higher time-frames The Value of the confirmation-candle =>

Volume Volatility is an indicator which analyzes currency pairs, indices, commodities etc. in terms of extremely high and extremely low accumulation to distribution ratio in comparison to values from past. The most important parameter is "Volume Volatility Factor" - this parameter, in big simplification, determines how far distance in the past is analyzed. The lower value of the parameter, the indicator analyzes less data from the past. I recommend you to set and test e.g. 3, 5, 15, 35, and 48 w

Gegatrade Pro EA is a Cost Averaging System with a Sophisticated Algorithm. It is secured by a built-in “ News WatchDog ” system that suspends trading during news events.
Trading Strategy Gegatrade Pro EA is based on the fact that most of the time the price usually moves between the upper and lower boundaries of the trading channel. Basing on this fact, Gegatrade Pro places its first trade, assuming that the price is going to return to its average value and take the profit which is defined. If

The indicator takes screenshots of the active terminal chart. Available image saving options: At the opening of a new bar (candlestick) depending on the currently selected timeframe; After a certain time interval, e.g. every 10 minutes after indicator launch on a chart; When trade orders are opened/closed both by an Expert Advisor and manually; Each time when a user clicks the "Screeshot" button.
Indicator Parameters Settings Screenshot time Start Time (hh:mm) - sets the start time of indicato
Compruebe lo fácil y sencillo que es comprar un robot en la MetaTrader AppStore, la tienda de aplicaciones para la plataforma MetaTrader.
El Sistema de pago MQL5.community permite efectuar pagos con ayuda de PayPal, tarjeta bancaria y los sistemas de pago más populares. Además, le recomendamos encarecidamente testar el robot comercial antes de la compra, para así hacerse una idea más completa sobre él.
Está perdiendo oportunidades comerciales:
- Aplicaciones de trading gratuitas
- 8 000+ señales para copiar
- Noticias económicas para analizar los mercados financieros
Registro
Entrada
Si no tiene cuenta de usuario, regístrese
Para iniciar sesión y usar el sitio web MQL5.com es necesario permitir el uso de Сookies.
Por favor, active este ajuste en su navegador, de lo contrario, no podrá iniciar sesión.