Robots comerciales e indicadores para MetaTrader 4 - 254

aviso ¡El precio ha sido revisado! (148USD -> 84USD)
Descripción de este EA Es un EA de seguimiento de tendencias que detecta la ocurrencia de una tendencia y entra cuando el mercado comienza a ganar impulso. Se espera que sea efectivo en mercados con alta volatilidad y demuestre un alto rendimiento frente al yen cruzado, especialmente la libra yen. Funciona en una posición sin usar pasadores ni martingala. Sin vinculación de cuentas. Acerca de la configuración Este EA se basa en la suposición

ATTENTION!!! The EA works correctly only on the AUDCAD pair.
Revival AUDCAD is a shortened version of the Revival Expert Advisor which uses a unique combination of grid strategy and martingale. Trades are opened according to the author's algorithm using the Ichimoku Kinko Hyo indicator. Recommended for use on cent accounts with brokers with an allowed lot of 1000 or more (eg RoboForex my.roboforex.com/en/?a=ldky).
Monitoring: https://www.mql5.com/en/signals/1728523
Requirements
Tradin
The Knoxville Divergence EA uses advanced algorithms to analyze market indicators and identify profitable trading opportunities. It places trades based on the indicator values and is able to enter and exit trades quickly and efficiently, ensuring that traders are always on the right side of the market. In addition to its advanced trading capabilities, the Knoxville Divergence EA also incorporates a grid and martingale strategy for loss recovery. This means that if a trade goes against the trader

Stepping-GBPUSD - works in fully automatic mode! No settings needed, you can use the default settings. The Expert Advisor works like a scalpel during sharp price movements. The bot was tested on real tick data with a real spread for a 19-year period from 2004 to 2023 (this is how much tick history is available on the servers of Swiss brokers). It also passed the Monte Carlo stability test using 5,000 cycles of simulation of random trade generation, as well as a simulated delay and slippage test

Haifix is a breakout strategy on all forex currency pairs, indices and metals. ONLY USE THE AMOUNT YOU CAN LOSE Haifix is a limited edition. Maximum specific number of copies to be sold: 12. Sold so far: 0 FROM 12. It will be sold
from May 19, 2023 and only for a few weeks. Sales start price - 100 USD and final price - 12,500 USD Very soon the price
will increase, get your copy now because after that there will be no discount. The strategy works in the backtest. SL/TP, pending orders are
El indicador "indicador de mercado neutral Mt4" con flechas muestra puntos de reversión de precios. Las líneas muestran la dirección de la tendencia o corrección. Si observa detenidamente el gráfico, puede notar fácilmente que la precisión de las flechas es bastante alta. El indicador muestra bien las señales en todos los plazos y pares de divisas. Cuando este indicador se creó junto con ChatGPT. A lo largo del trabajo de redacción de este indicador, recurrimos al chat para crear código y algor

Based on data from the Bank for International Settlements, 78.8% of the world's major 8 currency pairs can be checked instantly. It tells you whether the U.S. dollar is being bought or sold in a matter of seconds. So, even in the fast-moving phase after the release of economic indicators, you can see the flow and pushes of the U.S. dollar,
We are live-streaming the actual operation of the system. Please check for yourself if it is usable. Please check it out for yourself. https://www.youtube.c

This EA used 3 candle follow buy/Sell 1.EMA 20 and EAM 60 monitoring of trend 2.Waiting 3 candle of bull or bear candle for entry 3.Used ATR for SL 4.Used risk/Order 5.Have breakeven 6.Can used with GBPUSD,EURUSD,AUDUSD,USDJPY,USDCHF Inside EA already include all setting you can only On off currency that you need to Open and make risk that you accept. EA work in timeframe H4 . Remark :For Full version& Setting . I can't upload to MQL5 If you need to test please contact to me directly Myfxbook

[ Introduction ] . [ Installation ] Introduction
This version can be used for live trading. If you want to try a free version for backtesting only, you can go to here . Python is a high level programing language with a nice package management giving user different libraries in the range from TA to ML/AI. Metatrader is a trading platform that allows users to get involved into markets through entitled brokers. Combining python with MT4 would give user an unprecedented convienance over the connect

All users need to have a unique setting. Please contact us after purchase. Should you have any trouble, please contact use immediately. Introducing the BTC Strategy - a revolutionary trading system that blends together advanced indicators and sophisticated techniques for a comprehensive and high-performance trading experience. There is no Martingale added - just scalp in a controlled manner!
Risk management We understand that risk management is crucial to trade successfully. To allow users mana

The multi-currency Expert Advisor is suitable for most pairs. For safe trading, the account must have at least $ 50 on a cent account or at least $ 5000 on a classic account .Recommended broker for a classic account www.icmarkets.com or Alpari for a cent account.The Expert Advisor should be installed only on a 15-minute timeframe (M15). Advisor Trades aggressively, suitable for overclocking the deposit.
Parameters:
Distance - the minimum distance between orders (if the first order is unpr
EasyTrend 3 AM is an indicator that allows you to open a position at the very beginning of a significant price movement. The second most important quality of the indicator is the ability to follow the trend as long as possible in order to obtain all potential profits while minimizing potential losses. The indicator allows you to notify the user about your signals by sending messages to the terminal and e-mail. This indicator does not repaint or not recalculate.
Signal of the indicator: red arro

DAO CÓDIGO OCULTO FX Esta oferta es única. No hemos buscado el Santo Grial en el delta del Amazonas ni desenterrado una tumba egipcia. Montamos un almacén y encargamos indicadores a programadores. Todos menos Tesla. Y los antiguos taoístas. 1.El concepto lógico es este: · El gráfico bursátil sólo tiene dos dimensiones: arriba o abajo. Comprar o vender.Dos vectores de movimiento. · El gráfico da una tercera dimensión - el tiempo. Los vectores de compra y venta se convierten

Product Description Fluidity EA is an auto trading system designed to capture and trade early trending markets profitably. It can also be adapted to different financial markets, such as forex, stocks, and commodities. The trading system is equipped with an advanced money management routine that enables you to maximize profits, minimize losses, use of dynamic lot sizing, and manually set distance between trades (trade gap). The auto trading system employs the use of price action strategy to dete
SuperTrend 3 AM is an indicator that allows you to open a position at the very beginning of a significant price movement. The second most important quality of the indicator is the ability to follow the trend as long as possible in order to obtain all potential profits while minimizing potential losses. The indicator allows you to notify the user about your signals by sending messages to the terminal and e-mail. This indicator does not repaint or not recalculate.
Signal of the indicator: red arr
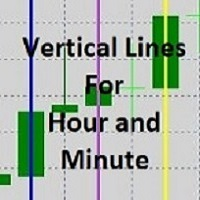
MT4 Indicator that puts up to 4 vertical lines for each selected hour and minute. Vertical line color and thickness are adjustable Input parameters: lineEnabled1 = true lineEnabled2 = true lineEnabled3 = true lineEnabled4 = true lineColor1 = Red lineColor2 = Blue lineColor3 = Green lineColor4 = Yellow lineTime1 = "12:00" lineTime2 = "14:00" lineTime3 = "16:00" lineTime4 = "18:00" lineWidth1 = 1 lineWidth2 = 1 lineWidth3 = 1 lineWidth4 = 1
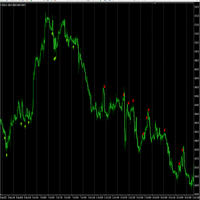
The MT4 trend arrow indicator is a powerful tool for technical analysis that will help traders determine the direction of the trend in financial markets. This indicator is based on the use of several mathematical algorithms and methods of price analysis, which allows you to give accurate and transparent signals to enter the market.
The working timeframe is H1.
The description of the indicator includes up and down arrows that indicate the future direction of price movement. In addition, the i

Need help managing your risk? Use Risk Helper
Drag this script onto your pair, enter your desired pip target, and open a trade. Once your pip target has been reached the Risk Helper will take partials profits, move the stop loss then double the profit target so it can do this process again on the next hit. A notification will be sent for every action the Risk Helper takes. Once the trade has been reduced to 0.01 lot size, Risk Helper will proceed to only move your stop loss for every pip tar
The indicator generates signals for opening positions. The principle of operation is to compare the current closing price with the closing price range for a longer period. The signals are confirmed when the price exceeds the High/Low of the bar where the indicator generated the signal. Maintenance of an open position is carried out on a smaller TF. Indicator signals to open an opposite position on a smaller TF are a signal to close the deal. This indicator does not repaint or not recalculate.

The EA is based on RCI and CCi indicators, uses StopLoss and Trailing Stop. Designed for trading the XAUUSD pair. The Expert Advisor was created for people who do not have a large stock of knowledge about the Forex market and with a small deposit. It is mandatory to have an ECN account with the lowest spread and slippage for the EA to work correctly. Timeframe doesn't matter, but M1 is preferable. Robot settings: flot = fixed lot size, dlot = dynamic lot (as a percentage of margin), dyn = enable

Using the Trend alternate indicator algorithm, you can quickly understand what kind of trend is currently developing on the market. The Trend Alternate Indicator accompanies lengths, can be used without instruments or timframes. With this indicator, you can try to predict future values. But the main application of the indicator is to generate signals for the purchase and sale. The indicator monitors the market trend with ignoring the sharp fluctuations in the market and the noise around the aver

Max Min Reversal Arrows - an arrow reversal indicator for predicting price movement. The indicator is built on the support and resistance levels at the local lows and highs of the price. Product features
Arrows appear on the current candle. The indicator does not redraw.
Can be used on all time frames and trading instruments. Recommended timeframes to use M30, H1, H4.
The dotted lines are the support and resistance levels within the signal. Price movement from these levels means a reversal.
Pr

B ot Speed Forex trading advisor is an automatic scalping system that opens and closes deals using a special tick analysis algorithm programmed in code without human intervention. The main task of the ego is to instantly make a deal where a person loses time for analysis and decision making. They also automate trading, removing the emotional burden from a person and allowing you to save time. Scalping is one of the varieties of short-term strategies, moreover, the shortest of them. Using this t

hello friend, there is an active adx based indicator for binary options, it only operates on 1 currency (eurusd) on TF M1, it operates the signal on the next candle. indicator test results within 2 months are very satisfactory, accuracy exceeds 85%. very optimal run in markets that issue news (medium impact and high impact). so of course it is very optimal, only a 1 month and lifetime trial is available.For orders, please go to the telegram developer: https://t.me/AgresivetradingSupport (@agresi

Market Viewer gives a quick glance on correlation and direction. This indicator takes a list of symbols (max 8) Leave a symbol setting empty if you wish not to use that many - like in the defaults… It will check for each timeframe (Monthly, Weekly, Daily, H4, H1, 30min, 15min, 5min and 1min) if the current candle on that timeframe is bullish or bearish. This will give a good indication of the direction for us to trade in. We need to be in sync with the bigger timeframes.

Description: For a comprehensive understanding of our indicators, we invite you to explore the entire Q&A section within this MQL5 blog post here . The "Divergence Strategy Indicator" is an advanced technical analysis tool designed to identify potential trend reversals and trend continuation opportunities in the market. It leverages the concept of divergence, a powerful phenomenon that occurs when price action diverges from an oscillator, indicating underlying shifts in market sentiment. Spo
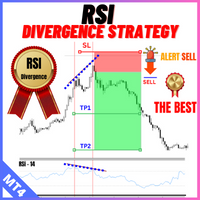
Description: For a comprehensive understanding of our indicators, we invite you to explore the entire Q&A section within this MQL5 blog post here . The "Divergence Strategy Indicator" is an advanced technical analysis tool designed to identify potential trend reversals and trend continuation opportunities in the market. It leverages the concept of divergence, a powerful phenomenon that occurs when price action diverges from an oscillator, indicating underlying shifts in market sentiment. Spot
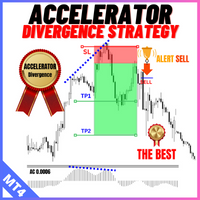
Description: For a comprehensive understanding of our indicators, we invite you to explore the entire Q&A section within this MQL5 blog post here . The "Divergence Strategy Indicator" is an advanced technical analysis tool designed to identify potential trend reversals and trend continuation opportunities in the market. It leverages the concept of divergence, a powerful phenomenon that occurs when price action diverges from an oscillator, indicating underlying shifts in market sentiment. Spo

Description: For a comprehensive understanding of our indicators, we invite you to explore the entire Q&A section within this MQL5 blog post here . The "Divergence Strategy Indicator" is an advanced technical analysis tool designed to identify potential trend reversals and trend continuation opportunities in the market. It leverages the concept of divergence, a powerful phenomenon that occurs when price action diverges from an oscillator, indicating underlying shifts in market sentiment. Spot
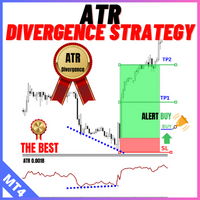
Description: For a comprehensive understanding of our indicators, we invite you to explore the entire Q&A section within this MQL5 blog post here . The "Divergence Strategy Indicator" is an advanced technical analysis tool designed to identify potential trend reversals and trend continuation opportunities in the market. It leverages the concept of divergence, a powerful phenomenon that occurs when price action diverges from an oscillator, indicating underlying shifts in market sentiment. Spo

Pandaman is a state-of-the-art mean reversion trading system that operates during US trading hours. It is very different from most other scalping systems in that it uses unique trading logic on cross pairs that have a strong tendency towards mean reversions with high profit targets. EA enters the market with a 19-23 hour market order and does not open positions during the extension period (0:00-1:00). In terms of trading duration, this is classic scalping: in and out of trades within a few hours

Description: For a comprehensive understanding of our indicators, we invite you to explore the entire Q&A section within this MQL5 blog post here . The "Divergence Strategy Indicator" is an advanced technical analysis tool designed to identify potential trend reversals and trend continuation opportunities in the market. It leverages the concept of divergence, a powerful phenomenon that occurs when price action diverges from an oscillator, indicating underlying shifts in market sentiment. Spo
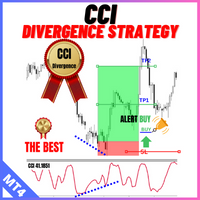
Description: For a comprehensive understanding of our indicators, we invite you to explore the entire Q&A section within this MQL5 blog post here . The "Divergence Strategy Indicator" is an advanced technical analysis tool designed to identify potential trend reversals and trend continuation opportunities in the market. It leverages the concept of divergence, a powerful phenomenon that occurs when price action diverges from an oscillator, indicating underlying shifts in market sentiment. Spo

Description: For a comprehensive understanding of our indicators, we invite you to explore the entire Q&A section within this MQL5 blog post here . The "Divergence Strategy Indicator" is an advanced technical analysis tool designed to identify potential trend reversals and trend continuation opportunities in the market. It leverages the concept of divergence, a powerful phenomenon that occurs when price action diverges from an oscillator, indicating underlying shifts in market sentiment. Spot
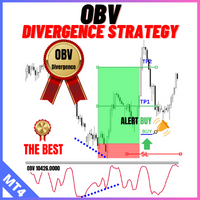
Description: For a comprehensive understanding of our indicators, we invite you to explore the entire Q&A section within this MQL5 blog post here . The "Divergence Strategy Indicator" is an advanced technical analysis tool designed to identify potential trend reversals and trend continuation opportunities in the market. It leverages the concept of divergence, a powerful phenomenon that occurs when price action diverges from an oscillator, indicating underlying shifts in market sentiment. Spot

Description: For a comprehensive understanding of our indicators, we invite you to explore the entire Q&A section within this MQL5 blog post here . The "Divergence Strategy Indicator" is an advanced technical analysis tool designed to identify potential trend reversals and trend continuation opportunities in the market. It leverages the concept of divergence, a powerful phenomenon that occurs when price action diverges from an oscillator, indicating underlying shifts in market sentiment. Spot
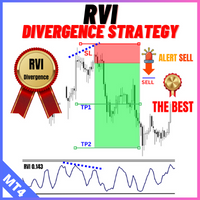
Description: For a comprehensive understanding of our indicators, we invite you to explore the entire Q&A section within this MQL5 blog post here . The "Divergence Strategy Indicator" is an advanced technical analysis tool designed to identify potential trend reversals and trend continuation opportunities in the market. It leverages the concept of divergence, a powerful phenomenon that occurs when price action diverges from an oscillator, indicating underlying shifts in market sentiment. Spo
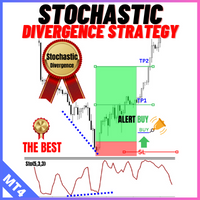
Description: For a comprehensive understanding of our indicators, we invite you to explore the entire Q&A section within this MQL5 blog post here . The "Divergence Strategy Indicator" is an advanced technical analysis tool designed to identify potential trend reversals and trend continuation opportunities in the market. It leverages the concept of divergence, a powerful phenomenon that occurs when price action diverges from an oscillator, indicating underlying shifts in market sentiment. Spo
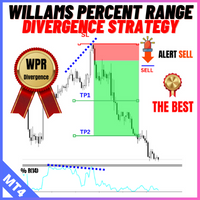
Description: For a comprehensive understanding of our indicators, we invite you to explore the entire Q&A section within this MQL5 blog post here . The "Divergence Strategy Indicator" is an advanced technical analysis tool designed to identify potential trend reversals and trend continuation opportunities in the market. It leverages the concept of divergence, a powerful phenomenon that occurs when price action diverges from an oscillator, indicating underlying shifts in market sentiment. Spo
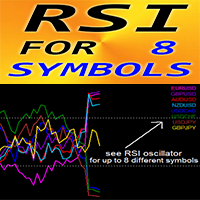
Indicador de Forex "RSI para 8 símbolos" para MT4. Sin repintado.
- El RSI es uno de los osciladores más populares para operar. - Es excelente para tomar entradas de venta desde una zona de fuerte sobrecompra (por encima de 70) y entradas de compra desde una zona de fuerte sobreventa (por debajo de 30). - El RSI es muy útil para la detección de divergencias. - "RSI para 8 símbolos" brinda la oportunidad de controlar los valores RSI de hasta 8 símbolos diferentes en un solo gráfico. - Este indi

Practice Simulator es un simulador de trading todo en uno para backtesting, práctica de trading y trading en vivo. Desde principiantes que necesitan práctica hasta traders experimentados que analizan los mercados, esta herramienta es adecuada para todos los niveles. Concéntrese en el trading de Forex, el análisis del mercado o la optimización de estrategias. Practice Simulator permite operar en cualquier momento, incluso en días festivos, con una interfaz sencilla pero potente para la gestión de

Golden Nugget EA are optimized for Gold vs USD H1 ( can be used for any instrument if u optimize ) Solid and strong System with stop and TP for each position- in and out. No Grid How to use it: just load the EA on XAUUSD H1 choose your risk and let him run.
0.01 per 1000$ recoment U can use Martingale but will not recomment by us. How it works? the EA use two Moving Averages to find an entry but take the Signals only if we have a trend. As a trendfilter we use the RSI In order to ensure exclusi

As a trader, it is essential to have access to the right trading tools and resources that can help you navigate the complex and constantly-changing markets. Get ready to elevate your trading game with Finanix Manager - a one-of-a-kind program that will revolutionize the way you trade. Are you ready to unlock your true potential and experience new levels of success? Try Finanix Manager today! First 10 customers - $30 Thus far: 0/10 buyers
Once 10 customers have bought the product, the price wi
A popular signal indicator marking buy/sell points. In this version, it is supplemented with optimal SL points. Recommended for use in conjunction with a trend indicator to filter signals. The indicator has only one adjustable parameter that determines its sensitivity, which greatly simplifies setting the indicator to the current market and the user's trading style. Indicator signals are given only after the full formation of the bar. The indicator can be used to trade any market. Its basic para
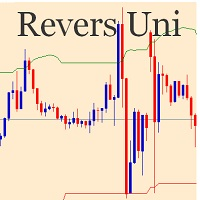
Индикатор разворота цены основанный на анализе трех таймфреймов. Когда вы выбираете параметр PERIOD, индикатор проводит рассчет по выбранному периоду и на два периода выше. Период М30 в рассчетах никак не участвует и его выбирать не рекомендуется. Максимальный верхний период для правильного рассчета применяйте не выше D1, т.к. в него уже войдут периоды W1 и MN. Период для установки индикатора выбирайте произвольно, а для более точного входа, я рекомендую М1,М5 и М15.
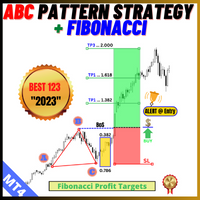
Description: The "ABC Pattern Strategy With Fibonacci" Indicator is a sophisticated technical analysis tool meticulously designed to recognize and leverage the power of the ABC chart patterns in combination with Fibonacci levels. This cutting-edge strategy empowers traders to make well-informed decisions in the dynamic forex market. By making spotting ABC patterns on price charts an easy task, the indicator offers insights into potential trend reversals or continuations. It seamlessly incorpor
This indicator displays the signals based on the values of the classic WPR indicator on the price chart. The WPR indicator can be used for determining the overbought or oversold areas on the chart. Reaching these levels means that the market can soon turn around, but it does not give signal, as in a strong trend the market can stay in the overbought or oversold state for quite a long time. As with most oscillators, the signals are generated when leaving these areas. This indicator allows to disp
This indicator displays the moment when the CCI oscillator crosses the zero value, and the moment when the CCI oscillator crosses its smoothed value. Crossing the zero value by the CCI oscillator is a buy/sell signal. If the CCI oscillator crosses its smoothed value, it is a signal of a trend change. The signal is given after the end of the formation of the candle. The signal is confirmed when the price crosses the high/low of the bar on which the signal was given. The indicator does not redraw.
El sistema IBT-R.BOLLINGER hace uso de tres indicadores, el RSI, las Bandas de Bollinger y el volumen para operar diversos activos en M5. El indicador Índice de Fuerza Relativa, RSI por sus siglas en inglés, es un oscilador de tipo momentum que nos permite distinguir cuando el precio se encuentra en zonas de sobrecompra o sobreventa. Para interpretar este indicador, establecemos dos zonas: 1. Zona de sobreventa. Cuando el RSI toma valores inferiores al nivel 20 indica una señal de compra. 2. Zon
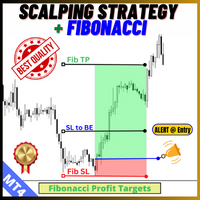
Description: For a comprehensive understanding of our indicators, we invite you to explore the entire Q&A section within this MQL5 blog post here . The "Scalping Strategy" Indicator is a cutting-edge technical analysis tool designed specifically for short-term traders who prefer to seize quick opportunities in fast-moving markets. As a scalping tool, it focuses on identifying rapid price fluctuations and generating concise yet actionable signals. Scalping Signals: Benefit from timely signals
Account tracker for a personal use.
Collect account balance, equity, margin, initial margin, p/l and push to a webserver. Lifetime license. Settings:
Allow dll import
Allow webrequest for certain urls drag and drop expert advisor on a new chart, minimize the chart and leave on the backgroud. Statistics will be update every 3 second and push it to the server.

Real Trade Entry indicator is designed for signal trading. This indicator generates trend signals.
It uses many algorithms and indicators to generate this signal. It tries to generate a signal from the points with the highest trend potential.
This indicator is a complete trading product. This indicator does not need any additional indicators.
The indicator certainly does not repaint. The point at which the signal is given does not change. Signals are sent at the beginning of new candles.

An extremely convenient indicator that truly makes the process of making money on the exchange easy. It is based on the scientifically rigorous theory of the market developed by the author, the beginning of which is presented here . The full algorithm of this indicator operation is presented in the article . The indicator calculates the most probable price movement trajectory and displays it on the chart. Based on the predicted price movement trajectory
The product is based on J.F. Ehlers' Center of Gravity indicator. Center of Gravity actually has a zero lag and allows to define turning points precisely. The indicator is a result of Ehlers' research of adaptive filters. It identifies main pivot points almost without any lag. The indicator places signals on the price chart according to COG data. The indicator does not repaint.
Parameters:
Length - indicator calculation period; MaPrice - price used to calculate the indicator; Signal - indica
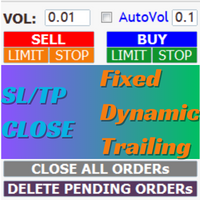
EaMinhonVN – TradeManagement (Telegram Contact: @AutoInvestorPro) The main functions of Ea TradeManagement 1. GUI o Interact with running EAs o GUI for placing orders o Closing orders by Ticket o Closing orders by MagicNumber o Closing all orders o Delete Pending orders 2. General management: o Management based on Symbol, manually orders , orders from the EA, and orders from other EAs o User-friendly trade interface with the ability to drag and drop SL,T

Informes V4 desde 2010 | Versión MT5 | FAQ !!! NUEVA VERSIÓN V4 - EL 23/09/2023 !!! Añadido un nuevo algoritmo más estable (ver más abajo para más detalles). CONFIGURE CORRECTAMENTE ANTES DE PRUEBAR
Es importante que el Asesor Experto funcione en la zona horaria correcta, por lo que antes de probar debe configurar correctamente el parámetro GMT. ¿Cómo configurar correctamente el parámetro GMT? El ajuste debe realizarse en el momento en que el mercado está abierto y se reciben ticks en el t

PSI - индикатор скорости цены. Он основан на измерении длинны каждого поступающего тика в терминал. Таким образом мы можем понять насколько сильно (с какой скоростью) цена движется вверх или вниз, и видеть остановку движения цены.
При увеличенной тиковой скорости цены вверх (тики вверх имеют большую длину чем тики вниз) - индикатор показывает зеленую гистограмму, при увеличенной скорости цены вниз (тики вниз имеют большую длину чем тики вверх) - индикатор показывает красную гистограмму. Индикат

For unbelievable results check my signals at:
https://www.mql5.com/en/signals/1963007?source=Site+Signals+My#!tab=account Just Launched! Price $99 for first 50 purchase then 299. The most Unique Ea for Forex Pairs on MT4! I invite you to Test the EA on Low time frames and check how powerful it is in Scalping. Ea Uses Support & Resistance + Moving Averages on large time frames. it is also having low draw down percentage. Testing the Ea on Live Demo Account will Guarantee more accurate results. T

The Trend Engine indicator is good for any trader, suitable for any trader for both forex and binary options. Trend indicator, a revolutionary trend trading and filtering solution with all the important features of a trend tool built into one tool! You don’t need to configure anything, everything is perfected by time and experience, it works great during a flat and in a trend.

Breaking TrendLine This Forex Expert Advisor is a semi-automated trading system that utilizes trend lines and support/resistance levels to execute buy and sell orders in the foreign exchange market. The system automatically places stop-loss and take-profit orders based on predefined parameters set by the user. The Expert Advisor operates on an algorithmic approach to trading, allowing for precise and timely execution of trades without the need for human intervention. This system provides traders

Current Price: $199--> (Next price $349) Live signal: https://www.mql5.com/en/signals/1590997 Fish n Grid – an automatic trading robot that works on multiple currencies. It takes advantage of the market's mean reversion characteristic with a calculated, dynamic, multicurrency grid system. Main features: Fully automatic Easy one chart setup Multicurrency grid profolio Basically trading everyday Calculated parameters for each currency Dynamic stoploss occasionally during night market Manual

Fox AI es un sistema totalmente automatizado que opera con divisas por la noche, utilizando el aprendizaje automático y algoritmos inteligentes para abrir operaciones durante el periodo de rollover y cerrarlas en un plazo de 12 horas . Se basa en una aplicación de aprendizaje profundo llamada Kras, que se ejecuta en la plataforma Tens. Kras es ampliamente utilizado por organizaciones como la NASA, YouTube y CORN. El sistema Fox AI ha tenido un éxito constante desde 2003 y no utiliza técnicas arr

For unbelievable results check my signals at:
https://www.mql5.com/en/signals/1963007?source=Site+Signals+My#!tab=account Just Launched! Price $260 for first 50 purchase then 565. The most Unique Ea for GOLD/USD on MT4! I invite you to Test the EA on Low time frames 5M and check how powerful it is in Scalping. Ea Uses Support & Resistance + Moving Averages on large time frames. it is also having low draw down percentage. Testing the Ea on Live Demo Account will Guarantee more accurate results.

Este EA utiliza una estrategia de tendencia de 4EMA y retest. El nivel de SL se determina por los máximos o mínimos recientes. Los objetivos de TP se calculan luego utilizando un RR fijo de las entradas. El modo Hedging utiliza una ecuación para modificar su riesgo con el fin de salir de una racha perdedora con un RR especificado en Bail. Es una especie de Martingale, pero más adaptable porque los factores cambian en función de RR y Bail. El modo puede ser encendido o apagado. Cuando compre o de
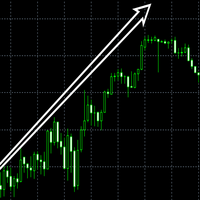
Absolute High Low indicator is a discretionary tool for assessing extremes in the price. It is very self-explanatory, and you can test against other default oscillators to see the difference. Combine with your trend following systems to master entry and exit at extremes. Back test and study the indicator to see the results up against a system or indicator. The indicator calculates a number of max bars so a gap will appear at the end, and it will restart. MT5 Version: https://www.mql5.com/en
This indicator displays on the price chart (coloring candles graphics) signals about the standard MACD crossing the zero value, as well as about crossing the signal line. The indicator does not redraw.
Custom Parameters: Fast_EMA_Period - fast moving average period; Slow_EMA_Period - slow moving average period; Signal_Period - signal line period; MACD_Price - the price at which the indicator is built;
The indicator improves the idea implemented in the standard Bulls and Bears indicator. The indicator colors candles by analyzing the divergence of the maximum and minimum prices of the current bar with the average value of the maximum and minimum prices over a longer period of time. The indicator does not re-paint on fully formed bars. The indicator is easy to set and efficient on trendy market segments.
Adjustable parameters: i_Period - smoothing period for forming the channel; i_Method - smoo

The Quantum Trade Resolver - High-Frequency Micro-Profits Edition is an advanced trading bot designed to help traders maximize their profits in the forex market by capitalizing on small price reversals. This expert advisor uses a combination of Bollinger Bands, Stochastic, and RSI indicators to generate high-quality trading signals, while focusing on frequent small wins that accumulate over time. This trading strategy ensures the bot's long-term profitability by avoiding the issue of overfittin

Please note that the price of the EA will change after every 3 copies sold. Therefore, the next price will be $390. (Only 2 left)
The Hamster EA was created for my real account about two years ago, and over the course of that time, I have made continuous improvements and bug fixes to the EA while it has been in use. Unlike some other EAs, the Hamster EA does not rely on risky methods such as Martingale or grid trading. It is capable of functioning across multiple charts, but can be activated f

Este EA es una poderosa herramienta de trading en forma de grilla que utiliza un algoritmo sofisticado para calcular las posiciones de entrada de cada operación individual. No se ajusta excesivamente a los datos históricos, en su lugar utiliza la volatilidad del mercado para optimizarse a sí mismo. Al utilizar la volatilidad del mercado, el algoritmo es capaz de adaptarse rápidamente y eficientemente a los cambios en el mercado. Esto significa que puede aprovechar las oportunidades del mercado,
Compruebe lo fácil y sencillo que es comprar un robot en la MetaTrader AppStore, la tienda de aplicaciones para la plataforma MetaTrader.
El Sistema de pago MQL5.community permite efectuar pagos con ayuda de PayPal, tarjeta bancaria y los sistemas de pago más populares. Además, le recomendamos encarecidamente testar el robot comercial antes de la compra, para así hacerse una idea más completa sobre él.
Está perdiendo oportunidades comerciales:
- Aplicaciones de trading gratuitas
- 8 000+ señales para copiar
- Noticias económicas para analizar los mercados financieros
Registro
Entrada
Si no tiene cuenta de usuario, regístrese
Para iniciar sesión y usar el sitio web MQL5.com es necesario permitir el uso de Сookies.
Por favor, active este ajuste en su navegador, de lo contrario, no podrá iniciar sesión.