Nuevos robots comerciales e indicadores para MetaTrader 4 - 308

Support and resistance represent key junctures where the forces of supply and demand meet. On an interesting note, resistance levels can often turn into support areas once they have been breached. This indicator is calculating and drawing 5 pairs of "Support and Resistance" lines as "High and Low" from the current and 4 previous days.
Identifying the trend of the market is an essential task of traders. Trendometer implements an advanced algorithm to visualize the trend of the market. The major focus of this indicator is to evaluate the market in the lower time frames (i.e., M1, M5 and M15) for the scalping purposes. If you are a scalper looking for a reliable indicator to improve your trade quality, Trendometer is for you. The indicator runs on a separate window showing a histogram of red and green bars. A two consecutive gre

MWC COX indicator shows the extreme zones of net short/long positions for four periods of time. Default settings are periods of 12, 26, 52 and 156 weeks.
Additional Features
- Displays the sum of all 4 periods in one line
- MA, MOM and RSI indicators are integrated
Please make sure that you download the MWC_Demo.zip file and unpack it into [...]/MQL4/Files folder. -> www.myweeklycot.com/teaser-demo
FREE

The indicator draws a histogram of important levels for several major currencies attached to the current cross rates. It is intended for using on charts of crosses. It displays a histogram calculated from levels of nearest extremums of related major currencies. For example, hidden levels for AUDJPY can be detected by analyzing extremums of AUD and JPY rates against USD, EUR, GBP, and CHF. All instruments built from these currencies must be available on the client. This is an extended version of
"Support" and "Resistance" levels - points at which an exchange rate trend may be interrupted and reversed - are widely used for short-term exchange rate forecasting. One can use this indicator as Buy/Sell signals when the current price goes above or beyond Resistance/ Support levels respectively and as a StopLoss value for the opened position.

Description Strongest Higher Level is an indicator that automatically plots the nearest level of strongest resistance and support in the main chart based on prices of the higher timeframe that differs it from Strongest Level indicator. Repeated usage of the indicator with various number of bars creates a system of support and resistance! The indicator calculates and plots levels based on number of bars set by the user. It is recommended to set numbers from a golden ratio according to Fibonacci

I like trading manually, so I created this tool to make my trade more easier and faster.
Features Money management. Click for place order ( Buy/Sell/BuyStop/BuyLimit/SellStop/SellLimit). Many buttons for control your account (Close All, Remove Pendings, Breakeven, Hedging). Auto hide if not use for 2 minutes. See profit on current symbol. Free to move panel to where you want. Save your settings for using on next time. Special: It's work on backtest mode! You can use this for training yourself.

This is a semi-automatic Expert Advisor. A user draws a support or a resistance line in the form of a horizontal line or a trendline on a chart. A command in the format of UP|DN_xxxx:yyyy is specified in the line name; the Expert Advisor understands it as a signal to buy or sell setting a stop loss and a take profit. EA settings include a parameter with a lot size and a value for moving stop loss to breakeven. If stop loss = 0, the EA does not use breakeven. If this parameter is greater than zer

Este indicador detecta reversiones de precios en forma de zig-zag, utilizando solo análisis de acción de precios y un canal donchian. Ha sido diseñado específicamente para el comercio a corto plazo, sin repintar ni pintar en absoluto. Es una herramienta fantástica para comerciantes astutos con el objetivo de aumentar el tiempo de sus operaciones. [ Guía de instalación | Guía de actualización | Solución de problemas | FAQ | Todos los productos ]
Increíblemente fácil de comerciar Proporciona va

Auto Trade Driver es una potente herramienta automática (trabaja como Asesor Experto) que le ayudará a gestionar los riesgos y controlar las órdenes para maximizar los beneficios con las reglas de multiprotección y Trailing Stop. Esta herramienta va a ser muy útil tanto para los scalpers, como para los traders que operan siguiendo la tendencia. No sólo calcula con precisión el riesgo de trading, sino también protege y aumenta el beneficio en tiempo real. Lo único que necesita hacer a la hora de

Automatic, live & interactive picture of all trendlines. Assign push, email and sound alerts to the lines of your choice and be informed about price rollback, breakout, rollback after breakout, number of rollbacks, line expiration by double breakout. Correct, drag or delete the lines and interactively tune the line system. https://youtu.be/EJUo9pYiHFA . Chart examples https: //www.mql5.com/en/users/efficientforex
Price Interaction Events
All events are effective immediately and only after one

Introduction Harmonic Patterns are best used to predict potential turning point. Traditionally, Harmonic Pattern was identified manually connecting peaks and troughs points in the chart. Manual harmonic pattern detection is painfully tedious and not suitable for everyone. You are often exposed under subjective pattern identification with manual pattern detection. To avoid these limitations, Harmonic Pattern Plus was designed to automate your harmonic pattern detection process. The functionality
El indicador muestra en las señales de gráficos de Acelerador oscilador (AC) de acuerdo con las estrategias de Bill Williams.
Gráfico de barras de AC es la diferencia entre el valor de 5/34, de la conducción de la fuerza gráfica de barras y el promedio móvil simple de 5 periodos, tomada a partir de ese gráfico de barras.
Interpretación de la Acelerador de oscilador (AC) se basa en las siguientes reglas - Si de CA es mayor que la línea de cero, se considera que la aceleración continuará el movi

Description Abuza 4 is an intraday trading system making profit during the price rollback. The Expert Advisor has been optimized for working on EURUSD. However, it can successfully work with other currency pairs as well. Martingale can be enabled, but you should be extremely careful (take profit often and at a proper time!). You can examine the Expert Advisor's trading statistics for different brokers and symbols in the MetaTrader 4 Trading Signals sections. Parameters Risk management: enter vol

Fibonacci Arcs in the full circles are based on the previous day's candle (High - Low).
These arcs intersect the base line at the 23.6%, 38.2%, 50%, 61.8%, and 78.6%. Fibonacci arcs represent areas of potential support and resistance.
Reference point - the closing price of the previous day.
These circles will stay still all day long until the beginning of the new trading day when the indicator will automatically build a new set of the Fibonacci Arcs.
Relative Strength Index (RSI) is one of the most popular and accurate oscillators widely used by traders to capture overbought and oversold areas of price action. Although the RSI indicator works fine for a period of market, it fails to generate profitable signals when market condition changes, and hence produces wrong signals which results in big losses. Have you ever thought about an adaptive RSI indicator that adapts its period of calculation based on the market conditions? The presented indi

This indicator shows price changes for the same days in past years. D1 timeframe is required. This is a predictor indicator that finds D1 bars for the same days in past 8 years and shows their relative price changes on the current chart. Parameters: LookForward - number of days (bars) to show "future" price changes; default is 5; Offset - number of days (bars) to shift back in history; default is 0; ShowAverage - mode switch; true - show mean value for all 8 years and deviation bounds; false - s
FREE

The indicator calculates running total of linear weighted returns. It transforms rates into integrated and difference-stationary time series with distinctive buy and sell zones. Buy zones are shown in blue, sell zones in red. Parameters: period - number of bars to use for linear weighted calculation; default value - 96; smoothing - period for EMA; default value - 5; mode - an integer value for choosing calculation mode: 0 - long term trading; 1 - medium term trading; 2 - short term trading; defa
FREE

UPDATE: I apologize for increasing the price from 15$ to 30$, but that was required by MetaQuotes during the version update. The old compilation from 2015 stopped working due to incompatibility with a new terminal. What is Squeeze? A contraction of the Bollinger Bands inside the Keltner Channel reflects a market taking a break and consolidating, and is usually seen as a potential leading indicator of subsequent directional movement or large oscillation movement. When Bollinger bands leave Keltn

What is Squeeze? A contraction of the Bollinger Bands inside the Keltner Channel reflects a market taking a break and consolidating, and is usually seen as a potential leading indicator of subsequent directional movement or large oscillation movement. When Bollinger bands leave Keltner Channel it means markets switching from a low volatility to high volatility and high volatility are something all traders are looking for. What I was missing in some indicators is possibility of monitoring many ti

Of all the four principle capital markets, the world of foreign exchange trading is the most complex and most difficult to master, unless of course you have the right tools! The reason for this complexity is not hard to understand. First currencies are traded in pairs. Each position is a judgment of the forces driving two independent markets. If the GBP/USD for example is bullish, is this being driven by strength in the pound, or weakness in the US dollar. Imagine if we had to do the same thing

The Supertrend Expert Advisor The Supertrend Expert Advisor with averaging elements. It has been developed during three months until I finally got good results. It is not a scalper. The minimum balance to start trading - 100 $. Is automatically adjusted to the 4 and 5-digit prices. Has an efficient risk management system. The lot and limit on the maximum lot is automatically calculated based on the settings specified in the EA. As a result, you have a complete automated trading system. Download

El objetivo de esta nueva versión del indicador MT4 estándar, incluido en el suministro de la plataforma, es mostrar en una subventana varios marcos temporales de un mismo indicador. Ver el ejemplo mostrado en la figura de más abajo. Sin embargo, el indicador no se representa como un indicador MTF simple. Es la representación real del indicador en su marco temporal. Ajustes disponibles en el indicador FFx: Elección del marco temporal a mostrar (desde M1 hasta MN) Ajuste de la anchura (cantidad d
FREE

El propósito de esta nueva versión del indicador estándar para MT4, que forma parte de la entrega de la plataforma, consiste en visualizar varios períodos de tiempo del mismo indicador en una subventana. Véase la imagen que se muestra más abajo. Sin embargo, su visualización no es como de un simple indicador MTF. Es la visualización real del indicador en su período de tiempo. A continuación, puede ver los ajustes disponibles en el indicador FFx: Selección del período de tiempo para la visualizac
FREE

El objetivo de esta nueva versión del indicador MT4 estándar, incluido en el suministro de la plataforma, es mostrar en una subventana varios marcos temporales de un mismo indicador. Ver el ejemplo mostrado en la figura de más abajo. Sin embargo, el indicador no se representa como un indicador MTF simple. Es la representación real del indicador en su marco temporal. Ajustes disponibles en el indicador FFx: Elección del marco temporal a mostrar (desde M1 hasta MN) Ajuste de la anchura (cantidad d
FREE

El objetivo de esta nueva versión del indicador estándar MT4 que entra en la entrega de la plataforma consiste en mostrar en la subventana varios períodos de tiempo del mismo indicador. Véase la imagen que se muestra más abajo. Sin embargo, su visualización no es como de un simple indicador MTF. Es la visualización real del indicador en su período de tiempo. A continuación, puede ver los ajustes disponibles en el indicador FFx: Selección del período de tiempo para la visualización (de M1 a MN) D
FREE

El propósito de esta nueva versión del indicador estándar para MT4, que forma parte de la entrega de la plataforma, consiste en visualizar varios períodos de tiempo del mismo indicador en una subventana. Véase la imagen que se muestra más abajo. Sin embargo, su visualización no es como de un simple indicador MTF. Es la visualización real del indicador en su período de tiempo. A continuación, puede ver los ajustes disponibles en el indicador FFx: Selección del período de tiempo para la visualizac
FREE

Este índicador técnico calcula directamente el valor del dólar index basado en la fórmula del índice que se negocía en la ICE por lo que no necesitas que tu broker tenga disponible este índice (DX) para ayudarte como referencia. Pequeñas discrepancias pueden encontrarse en el valor exacto de las velas y el tiempo debido a diferencias de horarios del cierre de piso de remates y el manejo de decimales. Pero en general te servirá bien de referencia. Necesitas que tu broker ofrezca el feed de los s
FREE

The purpose of this new version of the MT4 standard indicator provided in your platform is to display in a sub-window multiple timeframes of the same indicator. See the example shown in the picture below. But the display isn’t like a simple MTF indicator. This is the real display of the indicator on its timeframe. Here's the options available in the FFx indicator: Select the timeframes to be displayed (M1 to Monthly) Define the width (number of bars) for each timeframe box Alert pop up/sound/ema
FREE

The purpose of this new version of the MT4 standard indicator provided in your platform is to display in a sub-window multiple timeframes of the same indicator. See the example shown in the picture below. But the display isn’t like a simple MTF indicator. This is the real display of the indicator on its timeframe. Here's the options available in the FFx indicator: Select the timeframes to be displayed (M1 to Monthly) Define the width (number of bars) for each timeframe box Alert pop up/sound/ema
FREE
The purpose of this new version of the MT4 standard indicator provided in your platform is to display in a sub-window multiple timeframes of the same indicator. See the example shown in the picture below. But the display isn’t like a simple MTF indicator. This is the real display of the indicator on its timeframe. Here's the options available in the FFx indicator: Select the timeframes to be displayed (M1 to Monthly) Define the width (number of bars) for each timeframe box Alert pop up/sound/ema
FREE

This indicator provides a statistical analysis of price changes (in points) versus time delta (in bars). It calculates a matrix of full statistics about price changes during different time periods, and displays either distribution of returns in points for requested bar delta, or distribution of time deltas in bars for requested return. Please, note, that the indicator values are always a number of times corresponding price change vs bar delta occurred in history. Parameters: HistoryDepth - numbe
FREE

The purpose of this new version of the MT4 standard indicator provided in your platform is to display in a sub-window multiple timeframes of the same indicator. See the example shown in the picture below. But the display isn’t like a simple MTF indicator. This is the real display of the indicator on its timeframe. Here's the options available in the FFx indicator: Select the timeframes to be displayed (M1 to Monthly) Define the width (number of bars) for each timeframe box Alert pop up/sound/ema
FREE


The indicator displays signals according to the strategy of Bill Williams on the chart. Demo version of the indicator has the same features as the paid, except that it can work only on a demo account .
Signal "First Wise Man" is formed when there is a divergent bar with angulation. Bullish divergent bar - with lower minimum and closing price in the upper half. Bearish divergent bar - higher maximum and the closing price at the bottom half. Angulation is formed when all three lines of Alligator
FREE

The indicator displays signals according to the strategy of Bill Williams on a chart:
1. Signal "First Wise Man" is formed when there is a divergent bar with angulation. A bullish divergent bar has a lower minimum and the closing price in its upper half. A bearish divergent bar has a higher maximum and the closing price at the bottom half. Angulation is formed when all three lines of Alligator are intertwined, and the price has gone up significantly(or downwards). A valid bullish/bearish diver

Indicator Cloud is drawing "clouds" on the chart. If the current price is behind the cloud then no actions should be done. If the current price departs from the cloud then one should consider to go Long or Short according to the price movement. Input parameters: Period1 and Method1 could be used as indicator settings for each TimeFrame and Currency pairs.

The Alex Week Expert Advisor trades GBP/USD, EUR/USD, USD/JPY using pending orders only. Pending orders are placed at the breakthrough of important levels, which are accumulated throughout a trading week. Upon completion of the trading week, pending orders are deleted. The main rule of the EA is to preserve and increase the account balance without large risks. Unlike Alex Profis , this EA stores old signals for one week. It is very useful for a sharp change of trend. The EA works on H1. The Expe

This is an intraday indicator that uses conventional formulae for daily and weekly levels of pivot, resistance and support, but updates them dynamically bar by bar. It answers the question how pivot levels would behave if every bar were considered as the last bar of a day. At every point in time, it takes N latest bars into consideration, where N is either the number of bars in a day (round the clock, i.e. in 24h) or the number of bars in a week - for daily and weekly levels correspondingly. So,
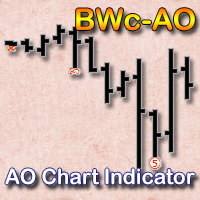
Indicator displays signals of the Awesome Oscillator on the chart according to the strategy of Bill Williams:
Signal "Saucer" - is the only signal to buy (sell), which is formed when the Awesome Oscillator histogram is above (below) the zero line. A "Saucer" is formed when the histogram changes its direction from descending to ascending (buy signal) or from ascending to descending (sell signal). In this case all the columns AO histogram should be above the zero line (for a buy signal) or below

Most of traders use resistance and support levels for trading, and many people draw these levels as lines that go through extremums on a chart. When someone does this manually, he normally does this his own way, and every trader finds different lines as important. How can one be sure that his vision is correct? This indicator helps to solve this problem. It builds a complete set of virtual lines of resistance and support around current price and calculates density function for spatial distributi

The indicator provides a statistic histogram of estimated price movements for intraday bars. It builds a histogram of average price movements for every intraday bar in history, separately for each day of week. Bars with movements above standard deviation or with higher percentage of buys than sells, or vice versa, can be used as direct trading signals. The indicator looks up current symbol history and sums up returns on every single intraday bar on a specific day of week. For example, if current

This is an easy to use signal indicator which shows and alerts probability measures for buys and sells in near future. It is based on statistical data gathered on existing history and takes into account all observed price changes versus corresponding bar intervals in the past. The statistical calculations use the same matrix as another related indicator - PointsVsBars. Once the indicator is placed on a chart, it shows 2 labels with current estimation of signal probability and alerts when signal

CCFpExtra is an extended version of the classic cluster indicator - CCFp. This is the MT4 version of indicator CCFpExt available for MT5. Despite the fact that MT5 version was published first, it is MT4 version which was initially developed and tested, long before MT4 market was launched. Main Features Arbitrary groups of tickers or currencies are supported: can be Forex, CFDs, futures, spot, indices; Time alignment of bars for different symbols with proper handling of possibly missing bars, in

The indicator displays most prominent price levels and their changes in history. It dynamically detects regions where price movements form attractors and shows up to 8 of them. The attractors can serve as resistance or support levels and outer bounds for rates. Parameters: WindowSize - number of bars in the sliding window which is used for detection of attractors; default is 100; MaxBar - number of bars to process (for performance optimization); default is 1000; when the indicator is called from
Self Explanatory Indicator: buy when the Aqua line crossing the Yellow line upward and Sell when the Aqua line crossing the Yellow line downwards. Input parameters: Period1 = 13. Method1 = 2. MODE_SMA=0, MODE_EMA=1, MODE_SMMA=2, MODE_LWMA=3. Period2 = 5. Method2 = 0. MODE_SMA=0, MODE_EMA=1, MODE_SMMA=2, MODE_LWMA=3.

The Commitments of Traders Ratio Indicator is one of these things you never thought about it before you really see the magic behind it. The indicator shows the Ratio of long/short positions released by the CFTC once a week.
If you have a look on the Sreenshot you can see two (three) zones of interest. Zone 1: The Switches (Red -> Green, Green -> Red) Zone 2: MA cross Zone 3: If you combine this with the COX indicator an additional zone will appear. You also can experiment with Ratio crossing MA
FREE

This indicator is designed for H1 timeframe and shows: Sum of points when the price goes up (Green Histogram). Sum of points when the price goes down (Red Histogram). In other words, by the number and ratio of bullish points to bearish ones, you can do a technical analysis of the state of the market.
If the green histogram prevails over the red one, you can conclude that at the moment the buyers are stronger than the sellers, and vice versa, if the red histogram prevails over the green, the se

Este indicador analiza la acción pasada de los precios para anticipar la presión de compra y venta en el mercado: lo hace mirando hacia atrás en el pasado y analizando los picos y valles de precios en torno al precio actual. Es un indicador de confirmación de última generación. [ Guía de instalación | Guía de actualización | Solución de problemas | FAQ | Todos los productos ] Predecir la presión de compra y venta en el mercado Evite quedar atrapado comprando vendiendo frenéticos No se necesita

Los niveles de Fibonacci se usan comúnmente en el comercio de los mercados financieros para identificar y compensar los niveles de soporte y resistencia.
Después de un movimiento significativo de precios hacia arriba o hacia abajo, los nuevos niveles de soporte y resistencia a menudo están en o cerca de estas líneas de tendencia
Las líneas de Fibonacci se están construyendo sobre la base de los precios altos / bajos del día anterior.
Punto de referencia: el precio de cierre del día anterior.
El soporte se produce cuando los precios caen, se detienen, cambian de dirección y comienzan a subir. El soporte a menudo se ve como un "piso" que es el soporte o la retención de los precios. La resistencia es un nivel de precios donde los precios crecientes se detienen, cambian de dirección y comienzan a caer. La resistencia a menudo se ve como un "techo" que impide que los precios suban más. Este indicador dibuja las líneas de soporte y resistencia calculadas según las barras nBars . Si el par

El indicador Display Trend Moving Averages System ( ver descripción ) muestra información sobre las direcciones de las tendencias H1, H4, D1, W1, MN en todos los intervalos temporales en una ventana, lo que permite observar los cambios del precio medio antes de que se cierre la barra mayor. Como unidad de la tendencia se toma una Media Móvil con el periodo "1" al cerrarse la barra mayor (H1, H4, D1, W1, MN). El indicador recalcula los valores de las barras mayores en interiores y muestra el

El indicador Two Moving Averages, muestra simultáneamente en la ventana principal del gráfico dos líneas Medias Móviles con los ajustes por defecto: la Verde y la Roja, que representan la tendencia a corto plazo. Es posible cambiar los ajustes de las medias móviles, así como el color. Sin embargo, debo observar que los parámetros han sido elegidos de tal forma que permitan comerciar en todos los intervalos temporales. Es una variante de aplicación de las líneas Medias Móviles en una Estrategia

El indicador Three Moving Average, muestra simultáneamente en la ventana principal del gráfico tres líneas Medias Móviles con los ajustes por defecto: la Verde y la Roja, que representan la tendencia a corto plazo, la Roja y la Azul, que representan la tendencia a medio plazo. Es posible cambiar los ajustes de las medias móviles, así como el color. Sin embargo, debo observar que los parámetros han sido elegidos de tal forma que permitan comerciar en todos los intervalos temporales. Es una varian
MetaTrader Market es el mejor lugar para vender los robots comerciales e indicadores técnicos.
Sólo necesita escribir un programa demandado para la plataforma MetaTrader, presentarlo de forma bonita y poner una buena descripción. Le ayudaremos publicar su producto en el Servicio Market donde millones de usuarios de MetaTrader podrán comprarlo. Así que, encárguese sólo de sus asuntos profesionales- escribir los programas para el trading automático.
Está perdiendo oportunidades comerciales:
- Aplicaciones de trading gratuitas
- 8 000+ señales para copiar
- Noticias económicas para analizar los mercados financieros
Registro
Entrada
Si no tiene cuenta de usuario, regístrese
Para iniciar sesión y usar el sitio web MQL5.com es necesario permitir el uso de Сookies.
Por favor, active este ajuste en su navegador, de lo contrario, no podrá iniciar sesión.