Indicadores técnicos de pago para MetaTrader 4 - 9

Chart Patterns Detect 15 patterns (Ascending Triangle, Descending Triangle, Rising Wedge, Falling Wedge, Bullish Flag, Bearish Flag, Bullish Rectangle, Bearish Rectangle Symmetrical triangle, Head and Shoulders, Inverted Head and Shoulders, Triple top, Triple Bottom, Double Top, Double Bottom) Use historical data to calculate the probability of each pattern to succeed (possibility to filter notification according to the chance of success) gives graphic indication about the invalidation level and

The Smart Liquidity Profile is color-coded based on the importance of the traded activity at specific price levels, allowing traders to identify significant price levels such as support and resistance levels, supply and demand zones, liquidity gaps, consolidation zones, Buy-Side/Sell-Side Liquidity and so on. Smart Liquidity Profile allows users to choose from a number of different time periods including 'Auto,' 'Fixed Range,' 'Swing High,' 'Swing Low,' 'Session,' 'Day,' 'Week,' 'Month,' 'Quar

WARNING!! THIS SWORD IS TOO SHARP! ONLY 10 COPIES LEFT FOR THE NEXT PRICE TO BE 8,000$ FOR UNLIMITED PLAN. Dear traders I am very glad once again to introduce to you my other tool called "Forex Sword Indicator". In short this tool is meant to give you an edge over the market that you have been waiting for so long. Now, here it is. It is a very very simple tool but yet a dangerous sword. I call it a Holy grail indicator!. I will not talk a lot about this tool. Just let the tool speak by itse

Gold Venamax : este es el mejor indicador técnico de acciones. El algoritmo del indicador analiza el movimiento del precio de un activo y refleja la volatilidad y las posibles zonas de entrada.
Características del indicador:
Este es un súper indicador con Magia y dos bloques de flechas de tendencia para un comercio cómodo y rentable. El botón rojo para cambiar de bloque se muestra en el gráfico. La magia se establece en la configuración del indicador, por lo que puede instalar el indicador
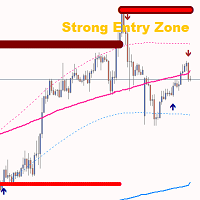
Gold TMAF MTF - es el mejor indicador técnico bursátil. El algoritmo del indicador analiza el movimiento del precio de un activo y refleja la volatilidad y las posibles zonas de entrada.
Las mejores señales del indicador:
- Para VENTA = límite superior rojo de TMA2 por encima del límite superior rojo de TMA1 + indicador fractal rojo por encima + flecha amarilla de señal SR en la misma dirección. - Para COMPRA = límite inferior azul de TMA2 por debajo del límite inferior azul de TMA1 +

Tendencia del oro : se trata de un buen indicador técnico bursátil. El algoritmo del indicador analiza el movimiento del precio de un activo y refleja la volatilidad y las posibles zonas de entrada.
Las mejores señales del indicador:
- Para VENTA = histograma rojo + puntero rojo CORTO + flecha amarilla de señal en la misma dirección. - Para COMPRA = histograma azul + puntero azul LARGO + flecha de señal aqua en la misma dirección.
Ventajas del indicador:
1. El indicador produce seña
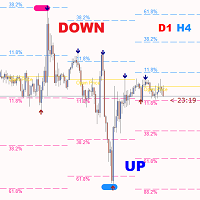
Gold ATR MTF: este es un excelente indicador técnico de acciones. El algoritmo del indicador ATR (Average True Range) analiza el movimiento del precio del activo y refleja la volatilidad dibujando los niveles correspondientes en porcentajes específicos (%) del precio de apertura del período de tiempo especificado (D1). Los indicadores (rojo y/o azul D1 H4) de la dirección del movimiento del precio del símbolo y las señales de flecha son ayudas adicionales y esenciales para una negociación y/o
Muestra el volumen de compradores y vendedores de una manera más amigable y comprensible. De esta forma podemos determinar con mayor precisión si ganan los bajistas o los alcistas. Hay patrones de comportamiento que estudiamos de antemano, pero en esencia nos serviremos de apoyo a la hora de tomar decisiones. Además si ya estamos dentro del mercado podemos confirmar si se acerca un cambio de tendencia y así salir antes del cambio de la misma. Parametros Estilo de dibujo Compradores Volumen Color

Optimice sus decisiones de trading con nuestro indicador de fuerza y sentimiento del mercado y deje de operar contra tendencia! Diseñado meticulosamente para los operadores serios que valoran la información precisa y oportuna, nuestro indicador proporciona una vista de pájaro de los 28 pares principales de una manera muy sencilla. Esta herramienta es capaz de clasificar los pares de divisas basándose en términos de popularidad, fuerza de tendencia alcista o bajista y porcentaje de compradores y

Este es fácilmente el indicador más pasado por alto que le brinda más información sobre la acción del precio. Es el único indicador que uso yo mismo.
Este indicador le brinda información sobre cuánto se moverá el precio hoy y en qué dirección es más probable.
ADR significa rango diario promedio. Si opera o especula intradía, debe conocer el rango de cuánto se moverá el precio.
Digamos que el precio se ha movido la mitad de lo normal para el día, y está en la parte inferior de la acción de

CS ATR FIBO CHANNELS MULTI TIMEFRAME
Additional tool to trade with Cycle Sniper Indicator.
Cycle Sniper : https://www.mql5.com/en/market/product/51950 Indicator Draws Channels based on: - Cycle Sniper Price and Moving Averages - ATR Deviations - Fibonacci Retracement and Extensions
Features: - Multi TimeFrame - Full alert and Notification options. - Simple Settings - Finds the trend change or extreme reversals.
Inputs: - Arrow Mode: ATR Levels or Median Line If Median Line is selected
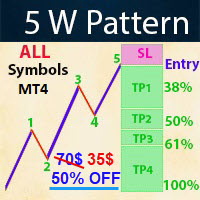
- Real price is 70$ - 50% Discount ( It is 35$ now )
Contact me for instruction, any questions! Introduction The Elliott Wave in technical analysis describes price movements in the financial market that are related to changes in trader sentiment and psychology. The 5 W Pattern (Known as 3 Drives) is an Elliott Wave pattern that is formed by 5 consecutive symmetrical moves up or down. In its bullish form, the market is making 5 drives to a bottom before an uptrend forms. In a bearish 5-d

Attention! Friends, since there have been many scammers on the Internet recently selling indicators called ForexGump, we decided to warn you that only on our page is the LICENSE AUTHOR'S VERSION of the INDICATOR sold! We do not sell this indicator on other sites at a price lower than this! All indicators are sold cheaper - fakes! And even more often sold demo versions that stop working in a week! Therefore, in order not to risk your money, buy this indicator only on this site!
Forex Gump Pro i

Monster Harmonics Indicator is a harmonic pattern indicator. It recognizes Gartley, Bat, Crab, Butterfly, Cypher, White Swan, Black Swan, Shark and several other patterns. Projected patterns that are not yet completed are recognized, too. Monster even shows the PRZ (Potential Reversal Zone). Users can add their own user defined patterns to Monster. Besides the current pattern, Monster also shows all patterns in the symbols history. Monster will provide alerts for developing patterns. Introduced

Libere el poder de la información de volumen real con el indicador Candle Power Pro . Esta herramienta dinámica captura los datos del volumen real de cada vela y los presenta como un porcentaje del volumen total. Al hacerlo, le permite discernir la lucha en curso entre compradores y vendedores en el mercado. Candle Power Pro muestra la batalla entre compradores y vendedores como un porcentaje del volumen total, brindándole información valiosa sobre la dinámica del mercado. Puede confirmar fá
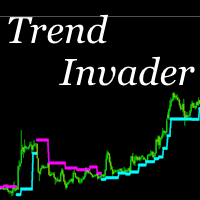
This indicator is very simple. It tracks the trend and leads it until it changes. You can also set or trail a stop using this indicator. The indicator is equipped with the ability to track older trends on lower charts. Optimal use is achieved by using this indicator together on the current and senior charts. Write after purchase to receive personal recommendations.

Features for software
Main functions: Accurate entry signals WITH NON REPAINTING! Once a signal appears, it remains valid! This is a significant distinction from other indicators that might provide a signal and then alter it, potentially leading to deposit losses. Now, you can enter the market with higher probability and precision. There's also a function to colour candles after an arrow appears until the target (take profit) is reached or a reversal signal appears . Display of STOP LOSS / TA

El tablero de fuerza de la moneda promedio móvil es un indicador poderoso y completo que proporciona una visión profunda del impulso de la moneda a través de múltiples símbolos y marcos de tiempo. Esta sólida herramienta utiliza promedios móviles para identificar los puntos de cruce más recientes y realiza un seguimiento eficaz de la fortaleza de las divisas hasta el precio actual. Con su diseño intuitivo y su interfaz fácil de usar, este tablero ofrece una gran cantidad de información para
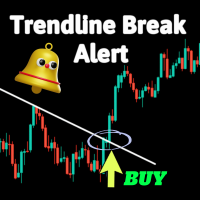
Este es un indicador simple que proporciona una alerta cuando se rompe una línea de tendencia.
Puede ser útil si estás acostumbrado a utilizar líneas de tendencia en tu trading. Los parámetros ajustables incluyen:
Identificador de vela: en qué vela dar la señal después de una ruptura Y tres tipos de alertas: Enviar correo electrónico Alertas audibles Notificaciones push Mira este video para aprender cómo configurar alertas de notificación en tu teléfono: https://www.youtube.com/watch?v=4oO-

El indicador Boom and Crash Spike Detector está codificado en base a una estrategia avanzada principalmente para detectar Boom and Crash en los precios. Se implantaron algoritmos complejos para detectar auges y caídas de alta probabilidad en los precios. Alerta sobre posibles fases de auge o choque: Fase de auge: cuando el precio aumenta demasiado rápido. Crash Phase: cuando el precio baja demasiado rápido.
OFERTA POR TIEMPO LIMITADO: El indicador está disponible por solo 30$ y de por vida. C

Barras de pasador Bermaui
O (BPB) es un indicador que encuentra el patrón de acción del precio de Pin Bars en el gráfico. Pin Bars es un atajo para "Pinocchio Bars", que es un patrón de barra clásico alternativo a los candelabros japoneses con sombras altas o inferiores y cuerpos muy pequeños como Hammer, Inverted-Hammer, Hanging Man, Shooting Star, Dragon Fly Doji o Grave Stone Doji . El indicador Bermaui Pin Bars encuentra este patrón en función de una fórmula que se puede explicar en los

Contact me after payment to send you the User-Manual PDF File. How To Test
You can test the indicator by free version, to get the free version please contact me ( the free version scans charts in W1 and MN1 time-frames ) it's free.
123 Pattern Breakout
Trend is your friend, trade along the trend, but how do we identify trends? Sometimes the simplest methods have the best results. Pattern 123 is based on the breakout important price levels, when the price is trying to break the previou

Las ondas de Wolfe son patrones comerciales naturales presentes en todos los mercados financieros y representan una lucha por un precio de equilibrio. Estos patrones pueden desarrollarse en períodos de tiempo a corto y largo plazo y son uno de los patrones de reversión predictiva más confiables que existen, normalmente preceden movimientos de precios fuertes y largos. [ Guía de instalación | Guía de actualización | Solución de problemas | FAQ | Todos los productos ] Señales comerciales claras I
This is a multi timeframe version of the Supply and Demand indicator . It allows you to analyze a chart using the law of supply and demand on three different timeframes at a time. You will see zones of sales and purchases and determine the most profitable points to open positions. The indicator is based on the principle of market fractality. Supply and demand zones show places where a strong buyer or seller has made the price reverse and change its direction. The indicator has several types of

The swing continuation pattern happens in a trend direction after a short reversal / pull back . As the name suggests , these patterns occurs along the swing high and swing lows of a trend , this makes the patterns very low risk patterns with potential high rewards . The swing continuation indicator also combines Currency Meter as a filter for its execution. The idea is to go with both the price trend flow and currency trend flow. Which means the price action must be supported by the currency st

BeST_Hull MAs Directional Strategy is a Metatrader Indicator based on the corresponding Hull Moving Average.It timely locates the most likely points for Entering the Market as well as the most suitable Exit points and can be used either as a standalone Trading System or as an add-on to any Trading System for finding/confirming the most appropriate Entry or Exit points. This indicator does use only the directional slope and its turning points of Hull MAs to locate the Entry/Exit points while it a
El indicador VR ATR Pro es una potente herramienta profesional para determinar los niveles objetivos en un instrumento financiero. La eficacia del indicador ha sido comprobada por miles de pruebas en cuentas reales y de demostración. El indicador VR ATR Pro funciona con datos reales utilizando estadísticas reales vivas. La estadística es una cosa terca, el uso de datos estadísticos reales en los cálculos matemáticos permite calcular niveles objetivos precisos para un instrumento financiero. Para

Este indicador de panel de zona de oferta y demanda de múltiples períodos de tiempo y múltiples símbolos envía alertas cuando el precio ha alcanzado una zona de oferta / demanda. También es posible usarlo para recibir alertas sobre dobles techos / fondos regulares en lugar de zonas. Se puede utilizar con todos los marcos de tiempo de M1 a MN. Es posible utilizar filtros de RSI, divergencia (MACD, OsMA, RSI o Awesome) y patrones de velas (pin bar, envolvente, pinzas y estrella matutina / nocturna

Black series MT4 - The indicator is designed for trading on binary options with
Timeframe M1-M5-M15
Multicurrency (Works on cryptocurrency and currency pairs)
The signal appears when the candle opens
Up to 90% correct signals
There is no signal redrawing at all
Can be used with other indicators.
Good for scalping!
In Settings there is:
-Indicator working methods
-I Allert
Arrow color Red signal down Blue signal up
Also watch the video how the indicator works and signals

Dashboard for Ma Speedometer: https://www.mql5.com/en/market/product/116784
Non standard attitude to the standard moving average indicator. The essence of the indicator is to determine the strength and speed of the price direction by determining the tilt angle of the moving average. A point is taken on the fifteenth MA candle and a point on the last closed MA candle, a straight line is drawn between them, it is movable and on a hemisphere shows an angle of inclination from 90 degrees to -90.

Introduction to Sideways Market Analyzer Notable period of Low volatility and non-trending movements in the financial market is considered as Sideways Market. Sooner or later, the low volatility will increase and the price will pick up a trend after Sideways Market. In terms of trading point of view, Sideways Market can serve as the very good entry timing for traders. Sideways Market is also quite often the representation of accumulation of large orders from big investors. Therefore, knowing the

3 Level ZZ Semafor Scanner:
This is a Dashboard indicator which uses 3LZZ Indicator in the background to find semafors. It will give priority to the semafors3 because they specify a strong signal. So, even if there is a sem1 or 2 on current bar, and if Sem3 was within "Check Previous Bars for Sem 3". Then it will show Sem3 instead. Read about this in detailed post: https://www.mql5.com/en/blogs/post/758250
And get all extra Indicators/Template from above link.
Please note: Number of setti

The Identify Market State indicator allows you to set the beginning of a new trends and pullbacks on an existing trend. This indicator can be used both for trading on scalper strategies and for long-term trading strategies. The indicator is based on the 14 periodic DeMarker indicator and the 8 periodic simple moving average from this indicator. Statistical studies have shown that the sharp peaks of the DeMarker indicator curve when they drop below its minimum li

[ Versión MT 5 ]
Order Block Indicator MT5
Order Block Indicator MT4 es actualmente el indicador más preciso y personalizable del mercado. Ha sido desarrollado para facilitar el análisis de operativas basadas en Bloques de Órdenes y Zonas de Oferta y Demanda. Estas zonas son posibles puntos de reversión de un movimiento. Order Block Indicator MT4 resalta los bloques de órdenes activos de hasta 4TFs simultáneamente. A su vez, Order Block Indicator MT4 provee de un sistema de alerta visual que
This indicator is based on the work of legendary trader William Gann, specifically using mathematical models and data from past days. It calculates potential time for a reversal based on selected parameters for the current day. The time is displayed in the future, at the opening of the day and does not change thereafter. The indicator also includes alerts when potential reversal time approaches. An algorithm for possible price movement is built into the indicator. When the time comes, an alert i

ALQANNAS (Sniper) Indicator Overview: Welcome to ALQANNAS, your ultimate sniper in the forex market! ALQANNAS is a powerful and versatile trading indicator designed to enhance your trading experience. Whether you're a beginner or an experienced trader, ALQANNAS provides you with accurate non repainting signals, trend direction and strength, and advanced features to elevate your trading strategy. Key Features: Buy and Sell Signals: ALQANNAS is equipped with a sophisticated algorithm that genera

This multicurrency indicator is the Lite version of the Cosmic Diviner Reversal Zone Pro indicator. The indicator is based on original formulas for analyzing the volatility and price movement strength. This allows determining the overbought and oversold states of instruments with great flexibility, as well as setting custom levels for opening buy or sell orders when the overbought or oversold values of the instruments reach a user-defined percentage. A huge advantage of Reversal Zone Lite is the

Universal author's strategy, allows to determine the entry points for Buy and Sell both in the direction of the trend, on the reversals of trends and in the flat market. The indicator is equipped with a unique scanner which each tick analyzes the price chart, calculates optimal levels and patterns for finding entry points by one of the 3 strategies. Each of the strategies combines author formulas and algorithms, for optimal trading we recommend using 3 strategies simultaneously as they are compl
Presenting the SMT Divergence indicator, a versatile tool designed to aid in analyzing market dynamics.
The indicator helps identify divergences between the highs and lows of two correlated major currency pairs during specific market periods ("killzones" abbrev. KZ). These periods are characterized by increased market activity, allowing traders to observe market behavior more closely.
The indicator provides customizable options to adjust time settings and visually display the divergences an

The indicator shows divergence between the slope of lines connecting price and MACD histogram peaks or troughs. A bullish divergence (actually a convergence) occurs when the lines connecting MACD troughs and the lines connecting the corresponding troughs on the price chart have opposite slopes and are converging. A bearish divergence occurs when the lines connecting MACD peaks and the lines connecting corresponding price peaks have opposite slopes and are diverging. In such a case, the indicato
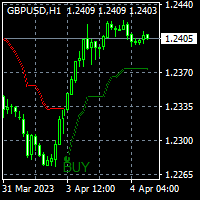
To get access to MT5 version please click here . This is the exact conversion from TradingView: "Supertrend" by " KivancOzbilgic ". This is a light-load processing and non-repaint indicator. Highlighter option isn't available in MT4 version. You can message in private chat for further changes you need. Here is the source code of a simple Expert Advisor operating based on signals from Supertrend . #property strict input string EA_Setting= "" ; input int magic_number= 1234 ; input double fixed_lo
To get access to MT5 version please click here . This is the exact conversion from TradingView:"HIGH AND LOW Optimized Trend TrackerHL OTT" by "kivancozbilgic" This is a light-load processing indicator. It is a non-repaint indicator. Colored Candle and Highlighting options are not available. Buffers are available for processing in EAs. You can message in private chat for further changes you need. Thanks.
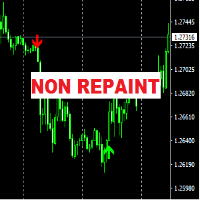
The "FCK Trend Arrow No Repaint" indicator is designed for analyzing market dynamics and determining potential trading signal moments. The main feature of this indicator is the absence of signal repainting, which contributes to more accurate and reliable forecasting of price movements in the market.
Mechanism of Operation: The "FCK Trend Arrow No Repaint" indicator uses several types of graphical elements to indicate trading signals: Up and Down Arrows: The indicator marks possible market ent

SmartChanel is a universal indicator for all types of markets. This indicator should have in its arsenal every trader, since it represents a classic approach to analyzing the price of a trading instrument and is a ready-made trading strategy. The indicator forms the upper, average price movement limit.
Advantages of the indicator works with any trading tool works on any time period can be used both in the classical market and in the binary options market the indicator has no settings and is s

50% off. Original price: $60 Triangle Finder is a multi symbol multi timeframe dashboard that monitors and finds symmetrical triangle pattern in 28 symbols and 9 timeframes with a deep scan feature to scan all market watch symbols (up to 1000 instruments!).
Download Demo here (Scans only M1 and M5) Settings description here MT5 version here
Triangle Finder features: Realtime monitoring of 28 customizable instruments and 9 timeframes at the same time. Deep scan mode to scan all market w

Presentamos ProEngulfing: su indicador profesional de patrón Engulf para MT4 Desbloquee el poder de la precisión con ProEngulfing, un indicador de vanguardia diseñado para identificar y resaltar patrones Engulf calificados en el mercado de divisas. Desarrollado para MetaTrader 4, ProEngulfing ofrece un enfoque meticuloso para el reconocimiento de patrones Engulf, asegurando que solo reciba las señales más confiables para sus decisiones comerciales. Cómo funciona ProEngulfing: ProEngulfing utili
¿Estás listo para llevar tus operaciones al siguiente nivel? Presentando WH Divergencia Pro MT4 ,
un indicador de divergencia avanzado que le permite elegir entre una variedad de indicadores técnicos populares.
Ahora puede adaptar sus señales de divergencia para que coincidan con su estrategia comercial única. Contáctame después de la compra para guiarte a través de los procesos. Características clave :
Selección de indicador : elija su indicador preferido entre las siguie

RSI Divergence Full +10 other divergence indicators
Contact me after payment to send you the User-Manual PDF File. Download the MT5 version here. Also you can download the >>> Hybrid Trading EA <<< that is designed and implemented based on RSI Divergence Indicator. RSI is a pretty useful indicator in itself but it's even more effective when you trade divergence patterns with that. Because the divergence signal of the RSI indicator is one of the most powerful signals among the indicators. D
El indicador RSI Pro Analyzer es una poderosa herramienta diseñada para operadores que buscan tomar decisiones informadas en múltiples períodos de tiempo simultáneamente. Este indicador utiliza el RSI para proporcionar señales de sobrecompra, sobreventa y tendencia , lo que facilita la identificación de oportunidades de entrada al mercado. Su principal ventaja es su facilidad de lectura gracias a sus códigos de colores claros y distintos para indicar las diferentes condiciones del mercado.
El

Este indicador de marco de tiempo múltiple y símbolo múltiple identifica formaciones superiores / inferiores dobles o triples o una ruptura del escote siguiente (superior / inferior confirmada). Ofrece filtros RSI, pin bar, envolvente, pinzas, estrella matutina / vespertina, así como opciones de filtro de divergencia MACD, Awesome (AO) o RSI que permiten filtrar solo las configuraciones más fuertes. El indicador también se puede utilizar en modo de gráfico único. Lea más sobre esta opción

This is diamond! Diamond Pattern is based on Read The Market(RTM) concepts. The purpose of this model is to face the big players of the market (financial institutions and banks), As you know in financial markets, big traders try to fool small traders, but RTM prevent traders from getting trapped. This style is formed in terms of price candles and presented according to market supply and demand areas and no price oscillator is used in it. RTM concepts are very suitable for all kinds of investment

Martingale Arrow es un indicador mt4 de tipo flecha diseñado para el comercio de opciones binarias martingala, esta flecha se imprime en la barra abierta/intra barra y da alerta. CÓMO UTILIZAR: abra la operación en el momento en que aparezca la flecha, si la operación ganó, espere la siguiente señal y opere con el mismo lote. Si la operación pierde el doble lote en la siguiente señal y continúa haciéndolo hasta que gane una señal, reinicie y opere con el primer lote comercial. PLAZO RECOMENDADO
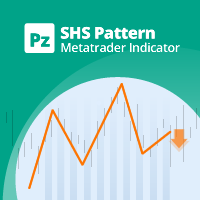
Un patrón de cabeza y hombros es una formación de gráfico que se asemeja a una línea de base con tres picos, los dos exteriores tienen una altura cercana y el medio es el más alto. Predice una inversión de tendencia alcista a bajista y se cree que es uno de los patrones de inversión de tendencia más confiables. Es uno de varios patrones principales que indican, con diversos grados de precisión, que una tendencia está llegando a su fin. [ Guía de instalación | Guía de actualización | Solución de

El patrón 123 es uno de los patrones de gráficos más populares, potentes y flexibles. El patrón se compone de tres puntos de precio: un fondo, un pico o valle, y un retroceso de Fibonacci entre 38.2% y 71.8%. Un patrón se considera válido cuando el precio se rompe más allá del último pico o valle, momento en el que el indicador traza una flecha, levanta una alerta y se puede colocar el comercio. [ Guía de instalación | Guía de actualización | Solución de problemas | FAQ | Todos los productos ]

The PERFECT TREND HIT creates BUY and SELL perfect trend arrow signals based on ADX EMA AND RSI And all filters inbuilt with accurate trend entries. Furthermore, the indicator and template display the trend direction, strength, and trade recommendation for independent price charts. ROCK WITH THE TREND Moreover, it shows the final trade recommendation to BUY or SELL with all filters and displays that information as arrow signals and pop up in the chart. The indicator works well for new and

1分足から使える高精度のスキャルピング用逆張りサインツールです。
・すべての通貨ペア、時間足で利用でき、絶好のタイミングでのエントリー・チャンスをお知らせします ・ ボリンジャーバンドにタッチしてからの反転を 基本戦略とし、 独自のアルゴリズムを加えることで、精度の高い反転ポイントでサインを発信します ・勝敗判定機能により 直近の相場環境に対するこのインディケータの有用性を確認することができます ・ 初心者から上級者まで設定不要ですぐにお使いいただけます ・本サインツールの性能を確認いただくための専用EAを提供いたします。コメント欄をご覧ください
1分足での使用にも耐えるので、トレード頻度を高めることができます。またより高い時間足での使用では精度の向上が期待できます。トレンド・フィルターの機能を利用することで、トレンド方向での押し目買い、戻り売りに際し最適なタイミングでトレードすることができます。
設定項目は以下の通りです。 Bollinger Bands Period
Bollinger Bands Deviation
Bollinger Bands Shift

Best strategy,
Easy trade ,
Support of version update in the future MT My Way: For new traders with no experience It is a very simple trade. Open the order when there is signal
and close the order when there is exit or found the next opposite signal.
You can set Stop Loss at the arrow and set the distance at Arrow Gap. For experienced traders, It will be very easy to trade.
indicator for trade by yourself
TRADE: Forex
TIME FRAME: All Time Frame (Not M1)
SYMBOL PAIR: All Sym

Versión MT5 | FAQ El Indicador Owl Smart Levels es un sistema comercial completo dentro de un indicador que incluye herramientas de análisis de mercado tan populares como los fractales avanzados de Bill Williams , Valable ZigZag que construye la estructura de onda correcta del mercado y los niveles de Fibonacci que marcan los niveles exactos de entrada. en el mercado y lugares para tomar ganancias. Descripción detallada de la estrategia Instrucciones para trabajar con el indi

The "Easy Ichimoku Wave Meter" indicator is a basic tool to automatically determine Waves according to Ichimoku!
The indicator gives the possibility to simultaneously apply the Wave Theory, Time Theory and Target Price Theory according to the "Little Ichimoku" strategy developed by Sense Hosoda on the MT4 platform. The use of this tool allows not only novice traders to instantly (fully automatic) determine the waves and their rapid interpretation, it also allows to automatically measure the p
Please feel free to contact me if you need any further information.
Please let me know if you have any questions.
I hope the above is useful to you. MT Magical : is a swing trade and trend and supply&demand strategy through signal filtering with experience. We worked really hard on this project. But it's worth it for investors.
indicator for trade by yourself
TRADE: Forex
TIME FRAME: All Time Frame (Not M1)
SYMBOL PAIR: All Symbol, Recommended
SETTINGS:
SIGNAL: Aggressive

Professional histogram (PH) es una herramienta altamente eficiente y confiable para el comercio de divisas, CFD y opciones binarias.
El PH es fácil de usar y configurar tanto para principiantes como para comerciantes experimentados.
A diferencia de la mayoría de los indicadores, Professional histogram encuentra tendencias más largas y ofrece menos señales falsas.
Cuando aparece una señal de compra o venta, se activa una alerta que le permite abrir una posición de manera oportuna y evita
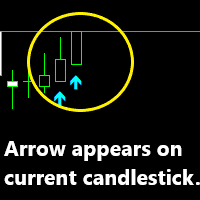
Advanced artificial intelligence indicator that is 100% non-repaint and appears on current candlestick. The indicator is based on arrows which serve as your entry points. Buy arrow is your buy signal and orange arrow are your sell signal as more arrows appear the stronger the trend and you can add more entries. The indicator works on all timeframe from the one-minute timeframe to the monthly timeframe. The AI Non-repaint indicator works on all forex pairs.

Little Trade Helper is a fine tool for manual traders.
It can quickly draw trendlines and support/resistance lines that will help to identify good price levels for placing entries, or set SL/TP levels.
This indicator will not provide any direct buy/sell signals or notification, but is purely meant for those traders that want to get a quick graphical help in finding important levels on the chart. When switching to another timeframe, the indicator will immediately adjust and re-calculate all

Apollo Price Action System es un indicador que se basa completamente en el principio Price Action. El indicador da una señal para comprar o vender tan pronto como se forman las condiciones para ingresar al mercado de acuerdo con el indicador de estrategia. El indicador se puede utilizar como un sistema comercial general o como una adición a su propio sistema comercial. Este indicador es muy fácil de usar. Sólo tienes que seguir las señales. El indicador muestra líneas de tendencia en el gráfico,

El indicador dibuja automáticamente los niveles de Fibonacci basándose en el indicador ZigZag, sesiones de negociación, fractales o velas (incluidos períodos de tiempo no estándar: año, 6 meses, 4 meses, 3 meses, 2 meses) (retroceso automático de Fibo). Puede elegir cualquier período de tiempo superior para el cálculo de Fibonachi. Los niveles se vuelven a dibujar cada vez que se cierra la barra actual. Es posible habilitar alertas al cruzar los niveles especificados.
También puedes analizar

This indicator displays the wave structure of the market in the form several wave levels nested in each other. For each of these levels an automatic preliminary (draft) marking of waves in Elliott's style (123..., ABC... etc.) is created. This markup is completely automatic and absolutely univocal. The indicator is especially useful for beginner wave analysts, because among all the possible versions for wave marking, it allows you to immediately take the most adequate version as a ba

"Turbo Helper para scalping" es un sistema de trading completamente preparado. Muestra al trader con una flecha en el gráfico cuándo abrir una orden y en qué dirección. También indica al trader con un símbolo cuadrado cuándo cerrar la operación. Después de eso, el indicador muestra en el gráfico la cantidad estimada de puntos para la operación. Este valor puede variar ligeramente ya que el indicador no tiene en cuenta el tamaño real del spread y swap de su bróker. Sin embargo, para calcular de m

ATR es un indicador importante para cualquier mercado financiero. La abreviatura ATR corresponde a Average True Range. Este indicador es un instrumento para determinar la volatilidad del mercado, este es su propósito directo. ATR muestra el movimiento medio del precio para el período de tiempo seleccionado. El precio inicial del indicador es 63$. El precio aumentará cada 10 ventas hasta 179$ El indicador ATR original está presente en muchos programas de trading. El indicador ATR no es muy inform
Indicador de scalping 2 en 1. Comprando este indicador, ¡te llevas de regalo un robot automático! Sistema automático de búsqueda de puntos de inversión de precios. El indicador con puntos en el gráfico de un par de divisas muestra los posibles puntos de reversión del movimiento de precios. Un punto rojo indica una inversión del movimiento hacia abajo y un punto azul indica una inversión en el movimiento del precio hacia arriba. El indicador es excelente para el comercio intradía utilizando una

MetaBands utiliza algoritmos potentes y únicos para dibujar canales y detectar tendencias para que pueda proporcionar a los traders puntos potenciales para entrar y salir de operaciones. Es un indicador de canal junto con un potente indicador de tendencia. Incluye diferentes tipos de canales que se pueden fusionar para crear nuevos canales simplemente utilizando los parámetros de entrada. MetaBands utiliza todos los tipos de alertas para notificar a los usuarios sobre eventos del mercado. Caract
El Mercado MetaTrader es una plataforma única y sin análogos en la venta de robots e indicadores técnicos para traders.
Las instrucciones de usuario MQL5.community le darán información sobre otras posibilidades que están al alcance de los traders sólo en nuestro caso: como la copia de señales comerciales, el encargo de programas para freelance, cuentas y cálculos automáticos a través del sistema de pago, el alquiler de la potencia de cálculo de la MQL5 Cloud Network.
Está perdiendo oportunidades comerciales:
- Aplicaciones de trading gratuitas
- 8 000+ señales para copiar
- Noticias económicas para analizar los mercados financieros
Registro
Entrada
Si no tiene cuenta de usuario, regístrese
Para iniciar sesión y usar el sitio web MQL5.com es necesario permitir el uso de Сookies.
Por favor, active este ajuste en su navegador, de lo contrario, no podrá iniciar sesión.