Indicadores técnicos para MetaTrader 4 - 52

Supplement for Alpha Trend Spotter (ATS) Indicator: https://www.mql5.com/en/market/product/8590 This indicator acts by price action. Use it when ATS shows clear Bullish or Bearish Trend for finding the strongest trend each day. Suitable for timeframes M5, H1, H4 and D1. Suitable for Binary Option 5 minutes signal. How to Use: RED Arrow means Sell
GREEN Arrow means Buy

This indicator works on every currency pairs and time frames (TF). One input parameter: nPeriod - number of bars for histogram calculation. I recommend to optimize nPeriod value for each TF. If Green histogram poles are crossing the zero line from below then Long position may be opened. If Red histogram poles are crossing the zero line from above then Long position may be opened.

This is a well-known ZigZag indicator. But it differs by the fact that its plot is based on values of the middle line which is set by a user. It can display Andrews’ Pitchfork and standard or Bobokus Fibo levels. NO REPAINTING.
Parameters Period МА — middle line period. Default value is 34. Minimum value is 4. Maximum value is set at your discretion. Used to calculate price - base price to calculate the middle line. The averaging method - method of smoothing the middle line. Turning pitchfork —
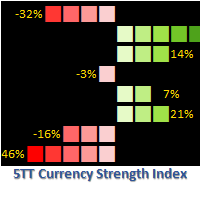
Want to know if to go long or short on any currency pair? 5TT Currency Strength Index is the answer! 5TT Currency Strength Index is a unique indicator for determining the short-term strength of any currency. Each currency strength is determined by an index of the currency with the strength of 7 other major currencies. The indicator is constantly monitoring price action across 28 currency pairs and 56 combinations; taking the following into consideration Price volatility. Short-term price range.

The ProfileVolumesMarket indicator calculates tick volume on each price level in a selected range. Volume is vital when determining strength and therefore significance of price levels. The calculation range is set by a trader by means of moving two vertical lines. Thus the indicator allows to track important levels on different steps of a symbol price formation. A histogram of volume profile can be displayed on the chart (or removed from the chart) if you press "ON" ("OFF") button. When you chan
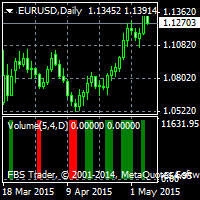
Alpha Trend Spotter (ATS) Volume Break Out This is an indicator that combines Volume breakout/breakdown and Moving Average Breakout/breakdown. It is able to predict further price changes. It is not repainted, not recalculated. All lines are shown at the open of a new candlestick, never winking or vanishing in the current candle. These lines are appeared at the beginning of the current candle. Suitable for M5 to D1 Timeframe. How to Use: If Green line appears, that shows the "oversold" area, so t

Simply drop the indicator on a chart, and you will always know when candlesticks form one of the Price Action patterns! The indicator automatically analyzes recently closed candles, and notifies if they form any of the Price Action patterns. The following classical patterns are analyzed: Pin bar Outer bar Pivot Point Reversal Double base Closing price reversal Force bar Mirror bars Move-congestion-move For each pattern, the indicator also shows trade direction in accordance with the classical Pr

The indicator is created for professional trading by Fibonacci levels. AutoFiboLevels plots Fibonacci retracement and extension levels on impulse and corrective wave. The indicator unambiguously interprets a market situation. Points of extremum for level plotting are calculated using fractal analysis. A trader can independently set retracement and extension levels and calculation time frame adjusting the indicator for various strategies.
Parameters: WorkTF - time frame for indicator calculation

The indicator determines Dragon pattern. It is based on the zigzag. There is buffer 0 which has no color located in the Colors tab. You will see the zigzag if you set it to some color. The indicator draws an up arrow when it detects a pattern which assumes further upward movement of the indicator. Similarly, the indicator draws a down arrow when it detects a pattern which assumes further downward movement of the indicator. Parameters: Alerts - show alert when an arrow appears. Push - send a pus
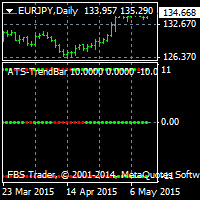
This indicator searches for the strongest trend and works on any timeframe. D1 timeframe is recomended. The product features three lines showing fast, medium and slow bars. If red bars appear at each of the three lines simultaneously, there is a strong bearish trend.
If green bars appear at each of the three lines simultaneously, there is a strong bullish trend. The indicator does not repaint and can be combined with other indicators. It is also suitable for binary option trading.

The indicator displays the moving average of all periods on one chart. It shows the MA of a one step lower timeframe and all the MAs equal to and higher than it.
Parameters Period moving average - Moving Average period (default is 34); Used to calculate price - price used for the MA calculation (default is the average price = (high+low)/2); The averaging method - default is linear-weighted; Moving average shift - MA shift (default is 0). Just enter the MA calculation period and its parameters,

5TT Pivot Lines is a visual display of pivot lines. These are primarily support and resistance points with the 'Blue' Pivot Point. Pivot points are useful for determining key levels for entry or exits (setting targets and stop loss levels). Having these support & resistance lines visually displayed on the chart is very useful for intraday traders. 5TT Pivot Lines come with some user-friendly settings to decide if to display the lines or connectors on the chart Settings CandlesBack: This gives th

true Momentum - time-based Indicator it will inform about Momentum, a strong impulse in the appropriate direction it's based on a self-developed candle Pattern, in relation to the ATR (Average True Range)
Quick Start : the indicator is ready to use choose your personal times to trade try an indicator-preset or use an additional indicator, below the pro-settings
Filter Hours Weekdays Moving Averages Correlation Instruments - Moving Averages MACD RSI ADX PSAR Stochastic Bollinger Bands Keltner-
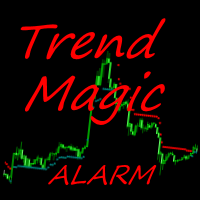
The Trend Magic Alarm shows the direction of a trend and indicates when it changes with a sound, popup window, push or email notice. Blue dots in the chart indicate an uptrend, red dots indicate a downtrend. Levels of former highs + lows give orientation in a chart. Trend Magic Alarm can draw these levels as lines in the chart, see inputs.
Input Parameters Counter : number of bars used for calculation PowerSet : shows how near to the bars the trigger dots are placed DotSize : size of the shown

TrafficLight provides simple trading buy and sell signals. The indicator shows reversal points and ambiguous points on current chart using cross rates. Only completed bars are counted. Buys are denoted by green arrows, sells - by red arrows. Yellow diamonds denote bifurcation points. Distance to the arrows relatively to the current price is a measure of volatility on the cross rates, and can be used as future price movement estimate for the work symbol. Due to the fact that indicator is calculat
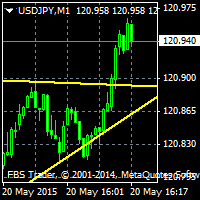
This Indicator will draw support and resistance (SR) in chart and give alert whenever there is a Support or Resistance Breakout. It has a variable to control SR line length (default 100) 500 is recommended. Support and resistance (SR) The concepts of support and resistance are undoubtedly two of the most highly discussed attributes of technical analysis and they are often regarded as a subject that is complex by those who are just learning to trade or even the expert traders. As we all know that
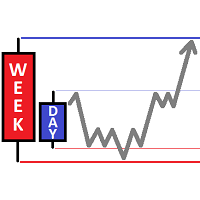
The indicator places levels on the chart: day and week high, day and week low. When the price crosses the high's level upwards or the low's level downwards, the indicator beeps and send a notification (Alert and Push-notification on mobile phone ) indicating a direction and an instrument by which crossing has occurred, and also draws arrows. Visual parameters: Day_Width - daily level width. Days_Alerts - enabling Alerts. Days_Arrows - enabling drawing arrows. Day_High - color of daily high
The indicator calculation is based on the analysis of the price characteristics of bars and is adjusted by the ATR value. The degree of the ATR influence is determined by the ratio. The color scheme of the indicator depends on the direction of the current trend. A change in the trend is displayed by an arrow and a corresponding message. Depending on the strategy chosen by the trader, this indicator can be used to generate market entry signals, to place stop loss or close trades, and can also be

The indicator has been developed as a trading system component. It has proven to be an efficient technical tool when following a trend. The indicator shows the most suitable market entry points. It can be especially useful to those who add to positions after corrections in the trend direction. When a signal appears, the indicator generates an alert.
The settings contain the depth of the indicator display history and ability to disable alerts. The signal is generated upon closing of the current

This indicator draws Fibonacci level automatically from higher high to lower low or from lower low to higher high. With adjustable Fibonacci range and has an alert function.
How to use Fibonacci Risk Reward Ration (R3) into trading strategy Forex traders use Fibonacci-R3 to pinpoint where to place orders for market entry, for taking profits and for stop-loss orders. Fibonacci levels are commonly used in forex trading to identify and trade off of support and resistance levels. Fibonacci retracem

The idea for indicator is using multi-SuperTrend line to define market trend and Multi Moving Average line to find good entry point. The signal doesn't repaint, wait until the bar closed to make sure the signal is confirmed. Lowest RoyalBlue line is used for Buy stoploss. Highest Magenta line is used for Sell stoploss. Indicator supports alert when signal is coming (sends email, push notifications, sound alert). High Timeframe is better for using.
Indicator parameters:
CountBars = 500 — How man

This is a great indicator to find an exit point. We never know when the market is going to change its trend. Many indicators give you a good entry point, but not good to use opposite signal as an exit point, because the signal always comes too late. This indicator will protect your profit as soon as possible when a signal to exit is found! Don't use this signal to enter, it may not be good for making an entry. The signal doesn't repaint, wait until a bar closes to make sure it is confirmed. Indi

The "Market Profile" indicator displays the profiles and volumes of periods – weekly, daily, session (8-hour), 4-hour, hour, summary. The VAH/VAL price area is automatically highlighted by a dotted line for each profile (except for the summary). The indicator includes chroma Delta, which colors the profile areas. The areas of prevailing Buys is colored in green, that of Sells - in red. The intensity histogram features blue/red respectively. In the filter mode, the indicator displays the volume a
This indicator automatically draws Support and Resistance lines based on High and Low Candle at every timeframe. Support and resistance have a recurring nature as a trader goes through the process of building a strategy. Because of its importance, it is often reasonable for a trader to build object patterns for incorporating these prices into a strategy. When strong support and resistance levels are found, this can enable traders to effectively plot their approach, manage trades, and adjust risk

Fibox4 indicator displays Fibonacci Retracement, Pivot Point, and many other useful information for analysis. The interface is improved by providing clickable button on chart to switch on/off H4, daily, weekly, monthly swing retracement level.
In addition, fibox4 displays Current Daily Range and Weekly Range.
This version can be used for all pairs..

The indicator automatically sets trendlines on the really important points directly on the chart. Timeframe, color and style of the lines can be adjusted. Notification of a breakout above or below the line via a smartphone is possible.
Inputs Timeframe - Choose timeframe TrendlineColor - Choose line color TrendlineStyle - Line styles (solid, dash, dot, dash dot, dash dot dot) Alerts - True = alert SendNotifications - True = Notification via a smartphone

This indicator is customized for binary option trading like M1 timeframe or turbo option trading. The way a binary option works is from the traders perspective is that you choose whether or not a certain underlying asset (a stock, commodity, currency etc.) is going to go up or down in a certain amount of time. You essentially bet money on this prediction. You are shown how much money up front you will earn if your prediction is correct. If your prediction is wrong, you lose your bet and the mone

The Nash Equilibrium MT4 draws the channel as a Trend and as Envelopes or Bands. You may use these white lines as levels for overbought and oversold conditions. Inside Bands, this indicator draws dot white line as a median line between the two bands and Aqua or Orange line and you may use this change of colors as moment to enter the market. Parameters nPeriod = 13 - number of Bars for indicator's calculation. nBars = 500 - number of Bars where the indicator is to be shown. Attention : This indic

Orders Info El indicador muestra información general y resumida en una ventana de gráfico. Conveniente para el comercio simultáneo en múltiples pares de divisas. El indicador indica el número total de posiciones de mercado y órdenes pendientes. Indica por separado para posiciones abiertas: para un par de divisas, para el número de compras abiertas en este par de divisas y su beneficio total en la divisa de depósito, sobre el número de ventas abiertas y su beneficio total, sobre el beneficio to

This indicator signals about Stochastic crossing in the trend direction which is determined by the position of the price relative to the Ichimoku cloud.
Features: Flexible settings: filtering signals by bullish/bearish bars ( parameter "BUY - the bullish bar only; SELL - the bear bar only" ); setting levels of Stochastic crossing ( parameters "BUY-signal if Stochastic below this level" and "BUY-signal if Stochastic below this level" ) ability to use the Ichimoku cloud of higher timeframes ( par

Indicator of divergences. It can help you identify the flat and trend areas. It can be applied as a trading filter. It has only one parameter - Period . The indicator does not show entry points, but only visualizes the information. Keep in mind that the approach to trading should be comprehensive, additional information is required for entering the market. Parameters Period - period of the indicator.

Trend indicator based on the price divergence. It can help you in finding the entry points during the analysis. It can be applied as a trading filter. It has two parameters: Period and Level . The Level parameter allows filtering out unnecessary signals. For example, the Level parameter can be set to 0.0001 for EURUSD. The indicator can work both as an entry point generator and as a filter. The indicator clearly visualizes the information. Keep in mind that the approach to trading should be comp

Introduction to Smart Renko The main characteristics of Renko Charting concern price movement. To give you some idea on its working principle, Renko chart is constructed by placing a brick over or below when the price make the movement beyond a predefined range, called brick height. Therefore, naturally one can see clear price movement with less noise than other charting type. Renko charting can provide much clearer trend direction and it helps to identify important support and resistance level
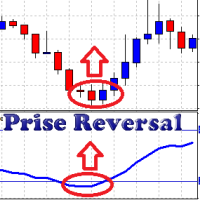
Oscilador, que toma en cuenta los datos de una serie de indicadores estándar, y en base a ellas forma sus señales ya más precisos. Prise Reversión ayuda a identificar puntos de inflexión tanto en el plano y los extremos de movimiento de precios en la tendencia. En estos puntos, se puede introducir una contra-tendencia a corto Tome, y muestran los momentos en los que no se puede abrir una transacción en la tendencia. Después de unos días de usar el indicador será una parte integral de su sistema

El indicador calcula la fortaleza de la moneda de ocho principales y también puede calcular la fortaleza de cualquier otra moneda, metal o CFD. No es necesario que revise muchos gráficos para determinar las monedas fuertes y débiles, así como su dinámica actual. La imagen de todo el mercado de divisas durante cualquier período se puede ver en un solo indicador. Las herramientas integradas de monitoreo y control de la situación ayudarán a no perder ganancias.
Características Principales Es capaz

The indicator MilkyWay is calculating and draws a blue or red ribbon as a trend and as a filter. In case the price is moving inside the ribbon you should not enter the market. In case you see a blue trend and the current price is above the blue ribbon than this is a good time to go Long. In case you see a red trend and the current price is below the red ribbon than this is a good time to go Short. Only 1 input parameter: nBars = 500; - number of Bars where the ribbon will appears.
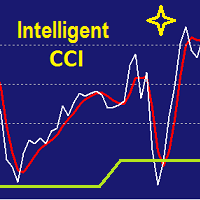
It is CCI indicator with very smooth and noiseless movement that calculates four levels of buy, sell, overbought and oversold dynamically. Professional traders know well that level of 100, 200 or -100 and -200 are not always right and need fine adjustments. This indicator calculates those levels dynamically by using mathematics and statistic methods in addition to shows divergence between indicator and price. Like original CCI, for best result you have better to set proper value for CCI period b

Advanced Bollinger Bands (BB) indicator. The standard Bands.mq4 indicator was complemented with a range of upper/lower band and signal of possible reverses.
Parameters: BandsPeriod - indicator period. BandsRange - period of determining a range. BandsDeviations - number of standard deviations. Averaging Fast Period - fast period of averaging. Averaging Slow Period - slow period of averaging.
Buffer indexes: 0 - Middle line, 1 - Upper line, 2 - Lower line, 3 - Upper range, 4 - Lower range, 5 -
This indicator creates more stable Aqua histogram, which crosses the zero line up and down indicating UP and DOWN trend for long and short positions. The indicator generates a pulse red signal, which crosses the zero line up and down more frequently than the histogram. You may use only the histogram for entering the market in the point where the histogram crosses the zero line. You may use only the red line for entering the market in the point where the red line crosses the zero line. You may us
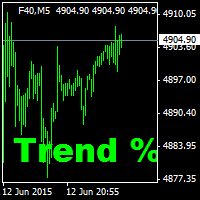
These indicators are suitable for scalper tradition. At least 5-10 pips of income should be targeted. The stop should be at least 11 pips. It is suitable to be used in brokers with not much spread. This indicator is used to determine the trend percentage. Trend direction is made in color. It has the indicator warning system: beep, e-mail and has three types of alerts, including messages to mobile phone. The position can be in 4 different corners of the screen. When trend value reaches the value
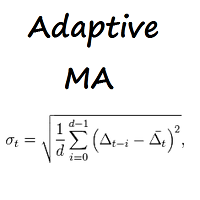
Adaptive MA Media móvil. El método de cálculo es el promedio de todos los precios utilizados en la definición de la barra.
Descripción de la configuración externa del indicador: MA_period : período promedio para calcular el indicador. Valores recomendados: 5, 13, 21, 34. ma_method : método de promediado. Puede ser cualquiera de los valores del método de media móvil. 0 - (SMA) Media móvil simple. 1 - (EMA) Media móvil exponencial. SMMA 2 - (SMMA) Promedio móvil suavizado. LWMA 3 - (LWMA) M

Cardiogram Market Descripción de la configuración: MA_period_fast : período de promedio para calcular el promedio móvil rápido. MA_period_slow : período de promedio para calcular el promedio móvil lento. precio : el precio a utilizar. Puede ser cualquiera de las constantes de precio. 0 - (CERRAR) Precio de cierre. 1 - (ABIERTO) Precio de apertura. 2 - (ALTO) Precio elevado. 3 - (BAJO) Precio más bajo. 4 - (MEDIANO) Precio medio, (alto + bajo) / 2. 5 - (TÍPICO) Precio típico, (máximo + mí
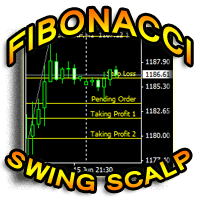
Fibonacci Swing Scalp (Fibonacci-SS) This indicator automatically places Fibonacci retracement lines from the last highest and lowest visible bars on the chart with an auto Pending Order (Buy/Sell), Stop Loss, Taking Profit 1, Taking Profit 2 and the best risk and reward ratio. This is a very simple and powerful indicator. This indicator's ratios are math proportions established in many destinations and structures in nature, along with many human produced creations. Finding out this particular a
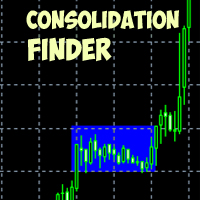
The indicator allows to find consolidations. It is meant for channel breakthrough. Easy to use, it has only three parameters: Minimum number of bars to analyze Consolidation tunnel Indicator color It works on all timeframes . Approximate settings are adjusted for H1 by default. Works on all currency pairs. This indicator does not repaint and is not recalculated. All screenshots are real!

This is a professional multi currency tool. Its main purpose is semi-automatic Forex trading following Elder's Triple Screen strategy. Its wide functionality and ability to quickly change some essential parameters makes it an ideal market interpretation tool, which is indispensable in the common trade analysis. Its main advantage is almost unlimited number of simultaneously analyzed instruments. If the potential technical limits of your monitor resolution allow, multiple indicators can be used.

The use of a polynomial expansion of data opens up new possibilities for analysis and decision making. But the problem of all existing algorithms is a very slow computation. The main feature of this indicator is its fast algorithm. The speed of calculation of the polynomial algorithm and its standard deviation values is several thousand times faster than conventional algorithms. So this is a convenient algorithm for use without the need to apply supercomputers. Also, starting from version 1.4

The Supply and Demand with Swap zones MTF indicator is a powerful tool for technical analysis that has been modified and enhanced to provide traders with even more valuable information. This tool is based on the rule of supply and demand and allows traders to analyze a chart on three different timeframes at once, providing a more comprehensive view of the market. One of the key features of this indicator is the so-called swap zones, which are areas that have been broken through by the price but

The Trend Trade indicator displays assumed turning points of the price on the chart in the direction of the trend after correction. It is based on data of the Prise Reversal oscillator with the period 6 and indicators which characterize strength and availability of the trend. When the value of Prise Reversal is in overbought or oversold area (area size is set by a user), and the current trend is confirmed, the Trend Trade indicator draws an arrow pointed to the further assumed price movement.
I
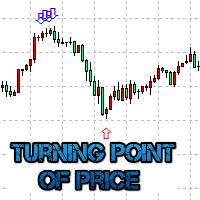
Indicador de Turning point of price de la gráfica el precio estimado del punto de pivote. Dibuja flechas. Utiliza datos de la Prise Reversal oscilador y el indicador ADX. Si el valor del indicador Prise Reversal está sobrecomprado o sobrevendido (propio usuario define el tamaño de la zona), y el valor de la línea principal ADX dado más tiempo, Turning point of price se basa en la Carta de la flecha. Esta idea se describe en el artículo " El indicador de reversión de precios ." Parámetro
The Stretch is a Toby Crabel price pattern which represents the minimum average price movement/deviation from the open price during a period of time, and is used to calculate two breakout levels for every single trading day. It is calculated by taking the 10 period SMA of the absolute difference between the open and either the high or low, whichever difference is smaller. This value is used to calculate breakout thresholds for the current trading session, which are displayed in the indicator as

The presented indicator draws the pivot points for different timeframes – 4 hours, day, week and month. Before you leave, download the demo version of this indicator, evaluate its performance. After all, this does not oblige you to anything. And then you will see that it has the best price to quality ratio, buy it now and receive updates for free. In the new version, an information panel with control buttons is displayed on the screen. The "Symbol properties" information panel shows: Symbol - na
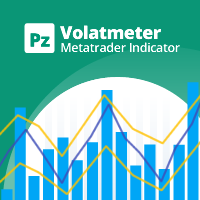
This indicator measures volatility in a multi-timeframe fashion aiming at identifying flat markets, volatility spikes and price movement cycles in the market. [ Installation Guide | Update Guide | Troubleshooting | FAQ | All Products ] Trade when volatility is on your side Identify short-term volatility and price spikes Find volatility cycles at a glance The indicator is non-repainting The ingredients of the indicator are the following... The green histogram is the current bar volatility The blu

PROscalper is a perfect tool for traders who use the scalping strategy! It gives you the visual view of the main Stoploss, Takeprofits and current/last pips on the chart and also in the integrated menu. So with this overview you have the high quality indicator for scalping! You can use PROscalper on any timeframes and on any pairs, but lower timeframes are recommended. To improve results, you can combine PROscalper with a Trendindicator (TrendfollowerSR) to get a dual confirmation for the entrie

Do you like scalping? Th is indicator displays information about the latest price quotes received from the broker. [ Installation Guide | Update Guide | Troubleshooting | FAQ | All Products ]
Identify tick trends easily A blue row means the price has increased A red row means the price has decreased Customizable colors and font sizes Display your desired amount of rows The indicator is non-repainting
Parameters Rows: amount of rows with data to display in the chart Font size: font size of the t

This indicator displays a complete tick chart with two optional moving averages, and makes paying attention to sub-m1 price data really easy. [ Installation Guide | Update Guide | Troubleshooting | FAQ | All Products ] Identify price spikes easily The blue line is the ask price The red line is the bid price The indicator doesn't lose tick data when reloaded It implements two optional moving averages The indicator is non-repainting
Input Parameters
Display Moving Averages: Display or hide the mo
The indicator compares quotes of the current symbol and a synthetic quote calculated from two specified referential symbols. The indicator is useful for checking Forex symbol behavior via corresponding stock indices and detecting their convergence/divergence which can forecast future price movements. The main idea is that all stock indices are quoted in particular currencies and therefore demonstrate correlation with Forex pairs where these currencies are used. When market makers decide to "buy"
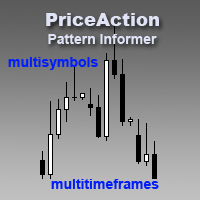
Pattern Informer is a convenient indicator for recognizing Price Action patterns on selected instruments. It presents a convenient overview form of all instruments on three timeframes (Н1, Н4, D1) in a single chart. It's an indispensable tool for manual trading based on the Price Action method. Pattern Informer recognizes the following patterns: PinBar Inside Bar Outside Bar DBLHC DBHLC TBL TBH
Indicator Parameters symbols_list - the list of currency pairs separated by commas for which patterns

El indicador incluye dos partes. Parte I: Las velas de colores muestran la tendencia principal Las velas de colores sirven para identificar el estado del mercado mediante las velas de colores. Como se muestra en las capturas de pantalla, si el color es Aqua, el mercado se encuentra en un estado en el que se deben realizar órdenes largas o salir de órdenes cortas. Si el color es Tomate, es el momento de realizar pedidos cortos o salir de pedidos largos. Si el color cambia, es mejor esperar a que

This indicator builds so called "random walk" bands: on every bar it finds maximal or average distance between current price and multiple expanding parabolic curves starting at predefined number of bars in the past. If you like Bollinger bands or Envelopes you may find this indicator useful as well. As you may know, price movements are very similar to random walk time series (specifically, Gaussian random walk), yet they do effectively break the hypothesis of randomness. One of the features of t
The main rule of the profitable trading is opening trades in the direction of a trend. You can define the current trend using fractal analysis. The Important Zone ResSup indicator displays important price support and resistance levels on the chart. The breakthrough or bounce from those levels shows further price direction. The data panel allows you to track the current trends on all timeframes. The current timeframe's important level values are shown in the comments. The indicator can be useful

This indicator allows you to see the strength of the trend on all timeframes. It can be used for all currency pairs. The indicator can be displayed in the form of a column (from left to right): status buy / sell / strong buy / strong sell, strength of the trend in percentage, pips last candle, body candle now, remaining time, and the timeframe of M1 to MN. Information contained below (from left to right): total trend percent, sell percent, buy percent.

The National Prise Reversal indicator represents an oscillator of a national currency (options: USD, CAD, CHF, JPY, GBP, EUR, AUD . It is based on already known Prise Reversal oscillator. But it analyzes particularly movement of a selected national currency on pairs with other specified currencies. Basing on these data the National Prise Reversal indicator determines overbought or oversold of the selected currency. When the indicator is in the overbought zone, it indicates possible weakening of

This indicator is meant for Harmonic Traders, it helps them in identifying the formed patterns by analyzing the market past data, looking for Harmonic Patterns. The Patterns that this indicator can detect are: AB=CD Butterfly Gartely Crab Bat The indicator shows the following: The completed pattern, with the critical zone highlighted in Gray box The suggested 3 take profit levels (in green) The Suggested Stop Loss level (in Red) The formed pattern ratios can be checked by hovering the mouse on t

The Correlation Matrix indicator shows the actual correlation between the selected instruments. The default setting is set to 28 currency pairs, gold, and silver, but the indicator can compare any other symbols.
Interpretation of the indicator Positive correlation (correlation is above 80 %). Negative correlation (correlation is below -80 %). Weak or no correlation (correlation is between -80 and 80 %).
Main features The indicator shows the actual correlation between the selected instrumen
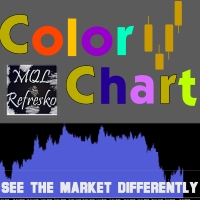
Visualice sus graficos de una manera diferente en Metatrader 5, y tome la ventaja que ello le da. excelente para comparar el Precio, ya que el indicador dibuja High, close, hlc,ETC. Util cuando se usa con otros indicadores, (como MACD) este sencillo indicador llena de color todo el espacio inferior del grafico, permitiendo visualizar el mercado con mayor realidad.
Indicator parameters Applied_Price : desde esta opcion se selecciona el tipo de precio que desee dibujar con el indicador, puede ser

The Candle Patterns indicator shows popular candle patterns on the chart. The possible patterns are Inside Bar, Large Wick, Engulfing, Marubozu, Hammer, Shooting Star, Three White Soldiers and Three Black Crows. Candles are colored to easily identify the patterns. Also, a point and click function displays the pattern found.
Settings Message box - when a candle is clicked, the pattern identified will be shown in a Message Box on the charts. All 'Message Box' settings pertain to the box. Show Ins

DailyBreakouts is the perfect tool for traders who use the breakout strategy! First, DailyBreakouts analyzes the last day; then, the beginning of the new day. After that, it gives you the signal for the breakout . With the integrated menu, you have the perfect overview of the pips, breakout zones, stop loss, and take profit. DailyBreakouts works on M30 and H1 timeframes, because it gives you one signal per day - so it is pointless to use lower or higher timeframes. To improve results, you can co
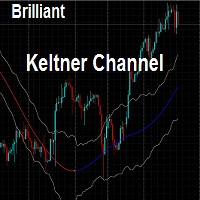
This indicator draws the Keltner Channel for any time frame Displayed on the current Time frame allowing user to choose which moving average type for the calculations. The available Moving Averages are: Simple Moving Average (MA_Mode=Mode_SMA)
Exponential Moving Average (MA_Mode=Mode_EMA) Smoothed Moving Average (MA_Mode=Mode_SmoothedAverage) Linear Weighted Moving Average (MA_Mode=Mode_LinearWeighted) Tillson's Moving Average (MA_Mode=Mode_Telsons) Moving Average line is coded into RED or BLUE

The Pairs Cross indicator is a unique tool for negatively correlated trading instruments, such as EURUSD and USDCHF currency pairs. It is based on a concept called pairs trading (or spread trading). Our indicator compares the strength of two currency pairs that are inversely correlated and quickly tells you when it’s time to buy the first pair and short a second pair, and vice versa. This is a straightforward approach to trading currency pairs that works very well.
How to you use the Pairs Cro
MetaTrader Market es el mejor lugar para vender los robots comerciales e indicadores técnicos.
Sólo necesita escribir un programa demandado para la plataforma MetaTrader, presentarlo de forma bonita y poner una buena descripción. Le ayudaremos publicar su producto en el Servicio Market donde millones de usuarios de MetaTrader podrán comprarlo. Así que, encárguese sólo de sus asuntos profesionales- escribir los programas para el trading automático.
Está perdiendo oportunidades comerciales:
- Aplicaciones de trading gratuitas
- 8 000+ señales para copiar
- Noticias económicas para analizar los mercados financieros
Registro
Entrada
Si no tiene cuenta de usuario, regístrese
Para iniciar sesión y usar el sitio web MQL5.com es necesario permitir el uso de Сookies.
Por favor, active este ajuste en su navegador, de lo contrario, no podrá iniciar sesión.