Pon "Me gusta" y sigue las noticias
Deje un enlace a él, ¡qué los demás también lo valoren!
Evalúe su trabajo en el terminal MetaTrader 5
- Visualizaciones:
- 27298
- Ranking:
- Publicado:
- 2016.07.01 10:28
-
¿Necesita un robot o indicador basado en este código? Solicítelo en la bolsa freelance Pasar a la bolsa
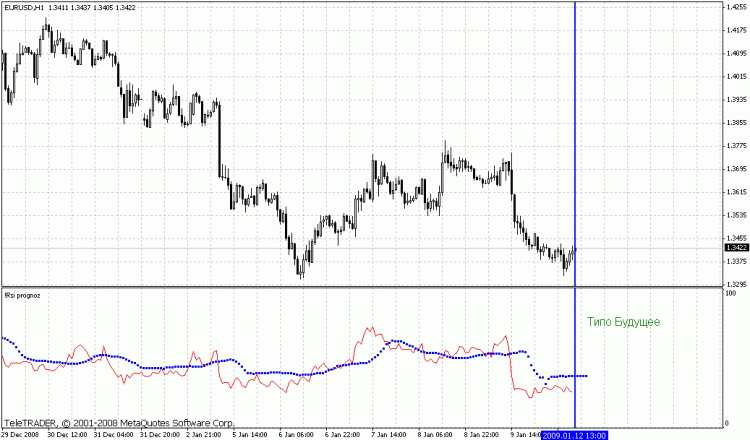
Settings:
start - start date for indicator calculation
period - period of the predicted RSI
pr_period - cluster size in bars
progn - number of bars for the prediction
err - error threshold for the cluster, at which the cluster is considered (form 0 to 100)
glubina - depth to search for suitable clusters (0-entire array)
exp - averaging mode of the prediction based on found clusters (0-simple moving average, 1 - linearly-weighted moving average)
The idea was simple: take the history values of RSI over pr_period bars and see the indicator values after progn bars, i.e. obtain a set of indicator values and a pseudo-value of what this set resulted in, store everything to an array. Then iterate over the array at a specified glubina depth and see if there had been any similar situations (satisfying err error) in the past and what they had lead to. The obtained results are averaged using the exp method. This concludes the calculation of the prediction.
Traducción del ruso realizada por MetaQuotes Ltd
Artículo original: https://www.mql5.com/ru/code/8669
 Example of plotting a function spectrum using the FFT library
Example of plotting a function spectrum using the FFT library
 Divergence based on a standard MACD with Alert and language selection.
The MACD is not required to be present on the chart. However, if a standard MACD is attached, the divergence lines will be drawn both on the chart and in the indicator window, and the indicator will use the MACD settings.
 7_Macd
Another variation of the Macd. I do not remember it had already been published.
 MTF PCCI-as a filter
Multi-timeframe PCCI indicator.
