Pon "Me gusta" y sigue las noticias
Deje un enlace a él, ¡qué los demás también lo valoren!
Evalúe su trabajo en el terminal MetaTrader 5

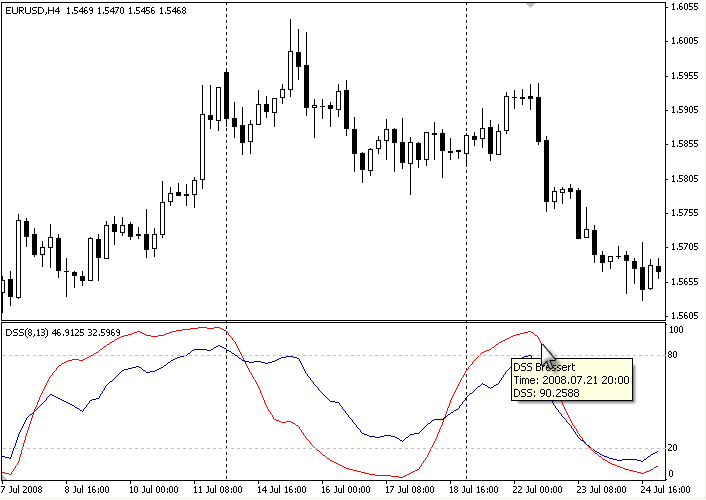
DSS Bressert - estocástico suavizado doblemente (Double Smoothed Stochastic Indicator by Walter Bressert) - indicador para MetaTrader 4
- Visualizaciones:
- 2416
- Ranking:
- Publicado:
- 2016.04.26 17:29
-
 Está perdiendo oportunidades comerciales:
- Aplicaciones de trading gratuitas
- 8 000+ señales para copiar
- Noticias económicas para analizar los mercados financieros
Registro EntradaUsted acepta la política del sitio web y las condiciones de uso
Si no tiene cuenta de usuario, regístrese -
 ¿Necesita un robot o indicador basado en este código? Solicítelo en la bolsa freelance
Pasar a la bolsa
¿Necesita un robot o indicador basado en este código? Solicítelo en la bolsa freelance
Pasar a la bolsa
Su algoritmo del cálculo es muy parecido al estocástico. El valor superior a 80 significa la sobrecompra, el valor inferior a 20 significa la sobreventa.
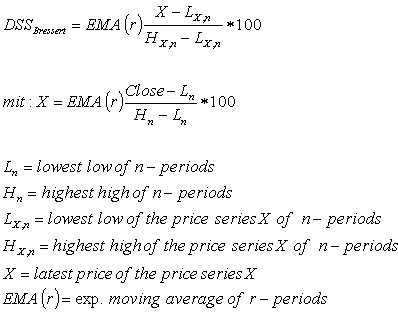
La fórmula del cálculo proviene de la página http://www.tradesignalonline.com/Lexicon/Default.aspx?name=DSS%3A+Double+Smoothed+Stochastics+(Bressert)
Description
One after the other, William Blau and Walter Bressert each presented a version of the Double Smoothed Stochastics. Two exponentially smoothed MAs are used to even out the input values (H, L and C), in a similar way to the well-known stochastic formula.
Calculation
Calculation of the DSS indicator according to Bressert is similar to stochastics.
1.) The numerator: first the difference between the current close and the period low is formed. The denominator: here the difference between the period high minus the period low is calculated. Now the quotient of numerator and denominator is calculated, exponentially smoothed and then multiplied by 100.
2.) The method is analogous to 1.) with the distinction that now the prices of the newly calculated price series of 1.) is used.
Parameters
The adjustable period length can be chosen from 2 to 500. The most common settings will have a period length ranging from 5 to 30. In addition, the indicator can be smoothed in the interval from 1 to 50. Meaningful smoothing values lie in the short-term range.
Interpretation
The application of the DSS is comparable with that of the stochastic method. Accordingly, values above 70 or 80 must be regarded as overbought and values below 20 or 30 as oversold. A rise of the DSS above its center line should be viewed as bullish, and a fall of the DSS below its center line as bearish.
Traducción del ruso realizada por MetaQuotes Ltd
Artículo original: https://www.mql5.com/ru/code/8310

 Altarius_RSI&Stoh
El EA ha sido probado en EUR/USD M15, utiliza el estocástico y RSI.
Waddah Attar Super Support Resistance
Muestra más de 160 tipos de los niveles de soporte y resistencia.