Pon "Me gusta" y sigue las noticias
Deje un enlace a él, ¡qué los demás también lo valoren!
Evalúe su trabajo en el terminal MetaTrader 5
- Visualizaciones:
- 1352
- Publicado:
- 2022.09.05 23:14
- Actualizado:
- 2022.09.05 23:15
-
¿Necesita un robot o indicador basado en este código? Solicítelo en la bolsa freelance Pasar a la bolsa
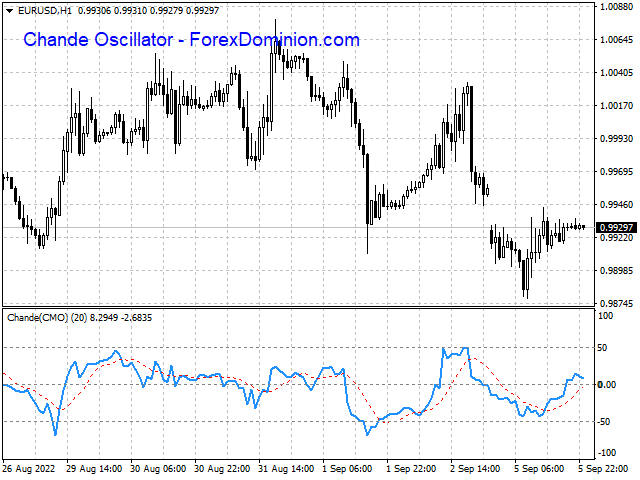
This custom indicator is designed to plot the Chande Momentum Oscillator on any chart and time frame in Metatrader 4.
The Chande Momentum Oscillator (CMO) is a price momentum technical indicator invented by Tushar Chande. Chande introduced the indicator in his 1994 book “The New Technical Trader”. This indicator is created by calculating the difference between the sum of all recent gains and the sum of all recent losses in the analyzed market, and dividing the result by the sum of all price movements during the period.
As a momentum oscillator, it belongs to the same group as indicators such as RSI, ROC, Stochastic Oscillator, CCI and Williams %R, which are designed to measure the rate of change in price series, in order to detect trend variations of greater or lesser amplitude.
The Chande momentum oscillator formula is:
CMO = 100 x ((Su – Sd) / (Su + Sd))
Where:
Su = Sum of price differences in bullish periods.
Sd = Sum of price differences in bearish periods.

Like other oscillators, the Chande indicator offers the following signals:

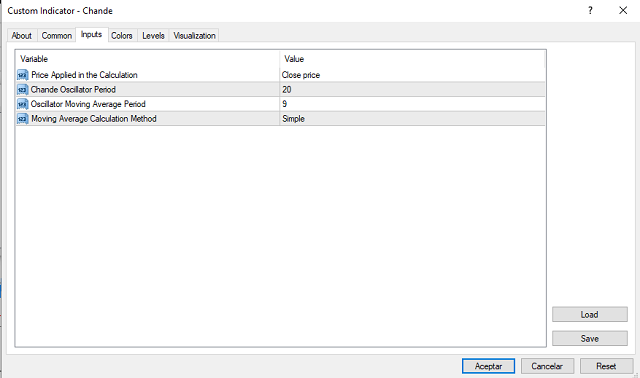
The parameters that we can modify in the indicator are the following:
- Price Applied in the Calculation: Here we can use the closing price, opening price, maximum price, minimum price, median price, typical price and weighted price.
- Chande Oscillator Period: In this parameter we can indicate the calculation period of the oscillator. The default value is 20.
- Oscillator Moving Average Period: It is the calculation period of the Chande moving average.
- Moving Average Calculation Method: Here we indicate the type of moving average used to calculate the average of the Chande oscillator.
A Dashboard RSI Oscillator Signals Indicator can be accessed at: RSI Signals Dashboard for MT4
 Draw trade history onto chart
Draw trade history onto chart
 Signals CSV to chart objects
Plot entry and exit as line objects from MQL5 signal CSV onto chart
 Price Horizontal Line Notifications
Get notifications when hit price level
 News Detector for Mt4 & MT5
One code that works for both Mt4 and Mt5 combined. Salient features of the code: -Filter News by High, Low or Medium Volatility -Filter By currencies -Filter by News Keyword -Auto GMT offset check -Dashboard to show upcoming News (Can be enabled or disabled) -Lines on chart for all Upcoming events -Code can be easily modified to place trade at certain time before or after an event or to just stop trading during events.